| Param | Original file | Final file |
|---|---|---|
| Filename | modeM0/AS1T05_233T01_9000006438_49632cztM0_level2.fits | modeM0/AS1T05_233T01_9000006438_49632cztM0_level2_quad_clean.evt |
| Size (bytes) | 1,084,224,960 | 43,632,000 |
| Size | 1.0 GB | 41.6 MB |
| Events in quadrant A | 14,729,026 | 81,777 |
| Events in quadrant B | 3,779,844 | 598,261 |
| Events in quadrant C | 5,698,453 | 13,761 |
| Events in quadrant D | 15,457,322 | 196,461 |
| Mode M9 | |||
|---|---|---|---|
| Quadrant | BADHDUFLAG | Total packets | Discarded packets |
| A | 0 | 9 | 0 |
| B | 0 | 9 | 0 |
| C | 0 | 9 | 0 |
| D | 0 | 9 | 0 |
| Mode SS | |||
|---|---|---|---|
| Quadrant | BADHDUFLAG | Total packets | Discarded packets |
| A | 0 | 122 | 0 |
| B | 0 | 122 | 0 |
| C | 0 | 122 | 0 |
| D | 0 | 122 | 0 |
| Mode M0 | |||
|---|---|---|---|
| Quadrant | BADHDUFLAG | Total packets | Discarded packets |
| A | 0 | 47890 | 0 |
| B | 0 | 15397 | 0 |
| C | 0 | 21109 | 0 |
| D | 0 | 50105 | 0 |
| Quadrant | Total seconds | Saturated seconds | Saturation percentage |
|---|---|---|---|
| A | 6045 | 6045 | 100.000000% |
| B | 6045 | 224 | 3.705542% |
| C | 6046 | 6046 | 100.000000% |
| D | 6046 | 5879 | 97.237843% |
Noise dominated data is calculated using 1-second bins in cleaned event files. If a bin has >2000 counts, and if more than 50% of those come from <1% of pixels, then it is considered to be noise-dominated and hence unusable.
| Quadrant | # 1 sec bins | Bins with >0 counts | Bins with >2000 counts | High rate bins dominated by noise | Noise dominated (total time) | Noise dominated (detector-on time) | Marked lightcurve |
|---|---|---|---|---|---|---|---|
| A | 6919 | 6044 | 5483 | 5483 | 79.25% | 90.72% | 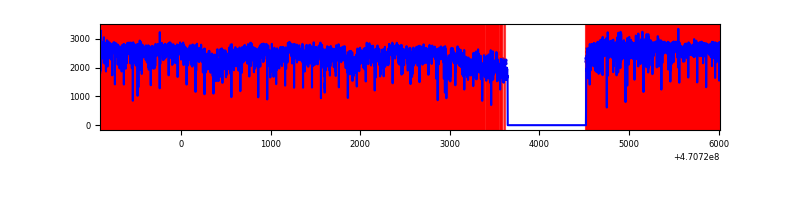 |
| B | 6920 | 6046 | 119 | 119 | 1.72% | 1.97% | 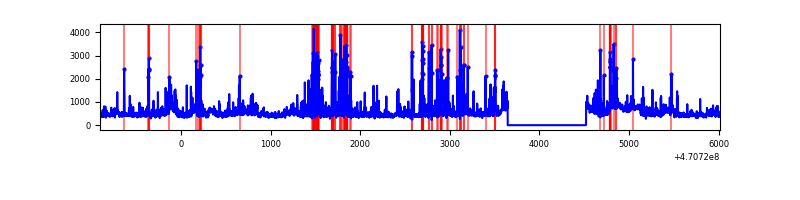 |
| C | 6920 | 6045 | 913 | 913 | 13.19% | 15.10% | 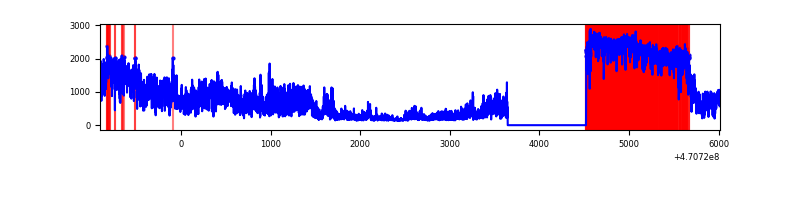 |
| D | 6921 | 6046 | 5656 | 5656 | 81.72% | 93.55% |  |
Top three noisy pixels from each quadrant. If the there are fewer than three noisy pixels in the level2.evt file, extra rows are filled as -1
| Pixel properties | Quadrant properties | ||||||
|---|---|---|---|---|---|---|---|
| Quadrant | DetID | PixID | Counts | Sigma | Mean | Median | Sigma |
| A | 0 | 99 | 8393145 | 214242.82 | 109 | 104 | 39.2 |
| A | 10 | 83 | 1752709 | 44737.42 | 109 | 104 | 39.2 |
| A | 3 | 130 | 1020474 | 26046.21 | 109 | 104 | 39.2 |
| B | 4 | 206 | 368958 | 2758.25 | 628 | 609 | 133.5 |
| B | 4 | 170 | 241186 | 1801.48 | 628 | 609 | 133.5 |
| B | 10 | 44 | 148256 | 1105.6 | 628 | 609 | 133.5 |
| C | 15 | 180 | 1749569 | 84142.36 | 32 | 30 | 20.8 |
| C | 15 | 181 | 1304078 | 62716.91 | 32 | 30 | 20.8 |
| C | 15 | 163 | 467577 | 22486.22 | 32 | 30 | 20.8 |
| D | 15 | 40 | 4840724 | 31802.14 | 271 | 246 | 152.2 |
| D | 7 | 60 | 1272019 | 8355.6 | 271 | 246 | 152.2 |
| D | 7 | 45 | 977989 | 6423.81 | 271 | 246 | 152.2 |
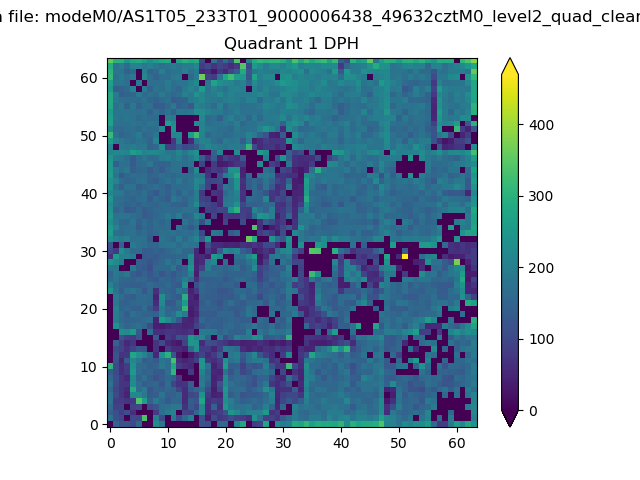
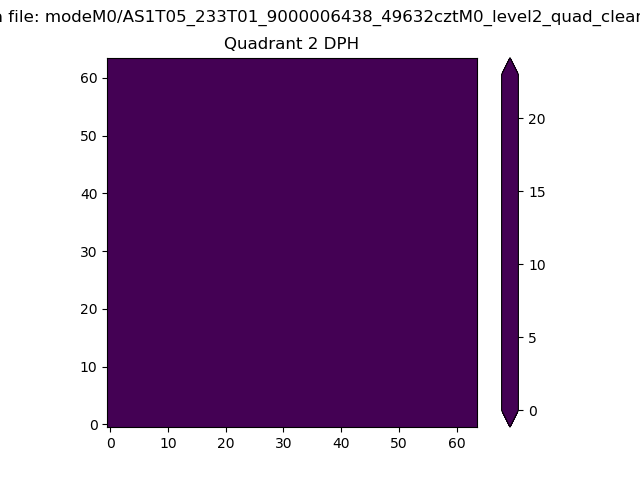
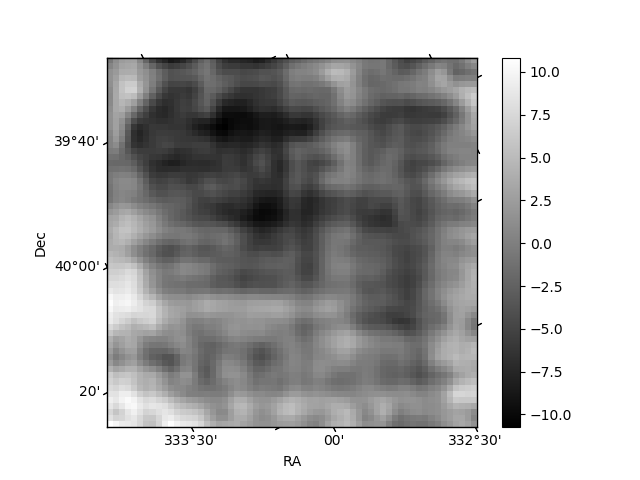
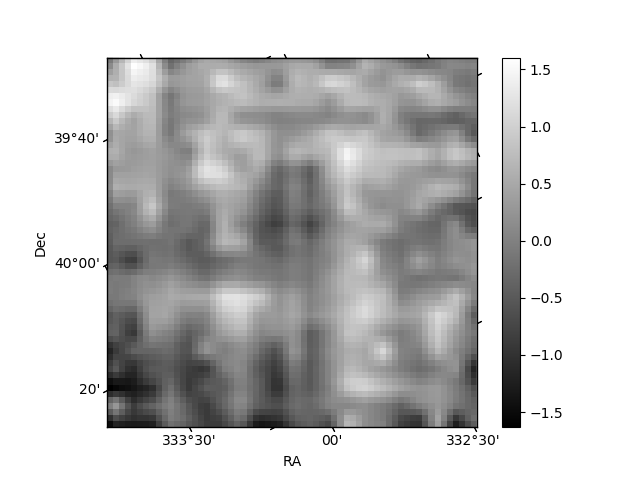
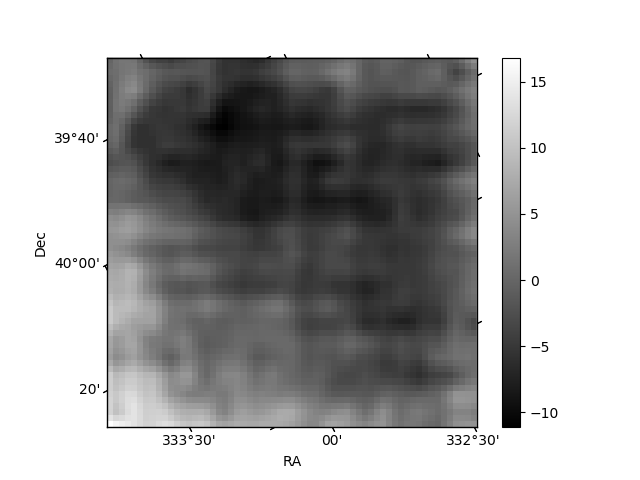
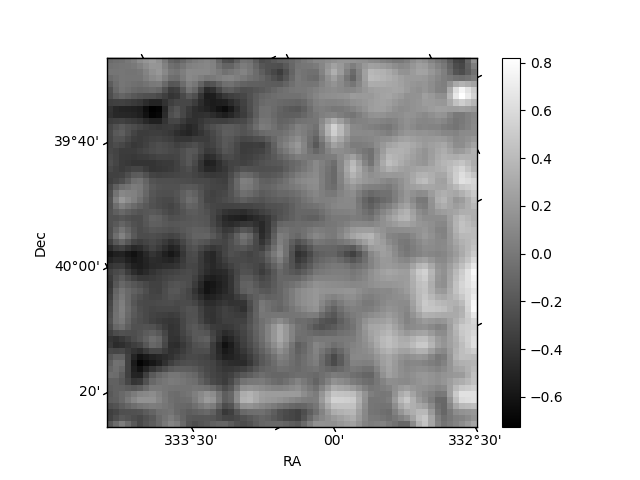
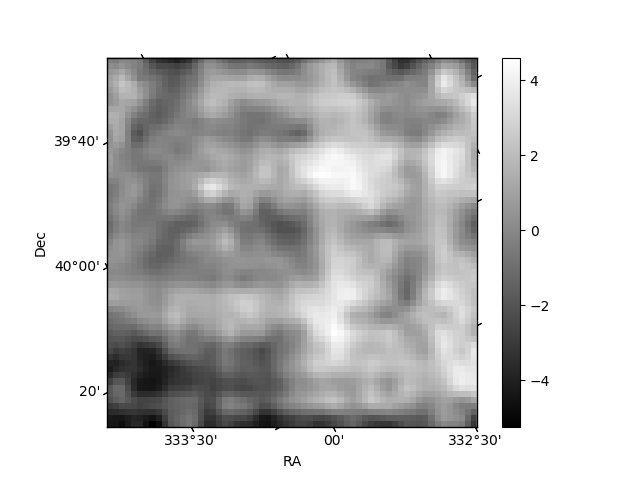
Histogram calculated using DETX and DETY for each event in the final _common_clean file
| Quadrant A | 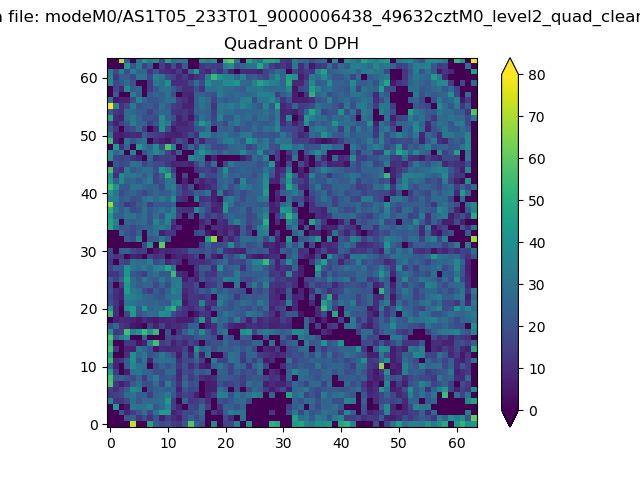 |
 |
Quadrant B |
|---|---|---|---|
| Quadrant D | 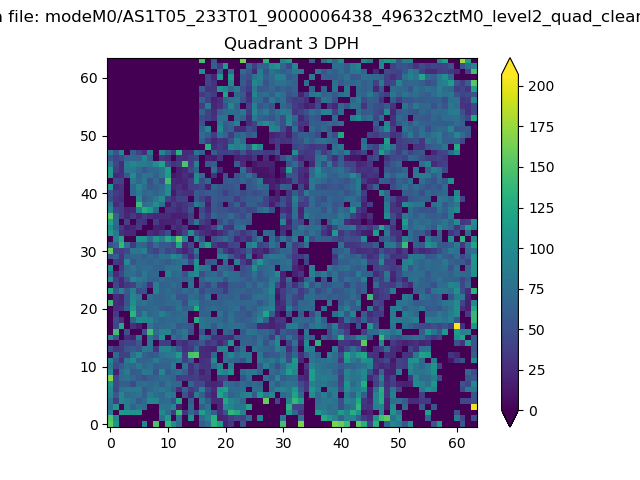 |
 |
Quadrant C |
| Plot type | Count rate plots | Images |
|---|---|---|
| Comparison with Poisson distribution Blue bars denote a histogram of data divided into 1 sec bins. Red curve is a Poisson curve with rate = median count rate of data. |
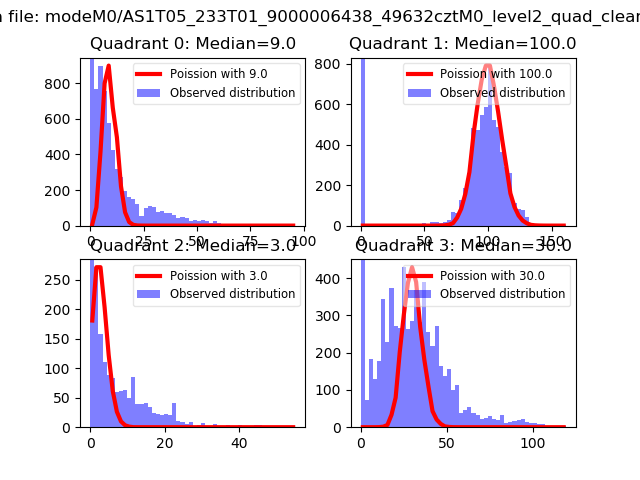 |
 |
| Quadrant-wise count rates Data is divided into 100 sec bins |
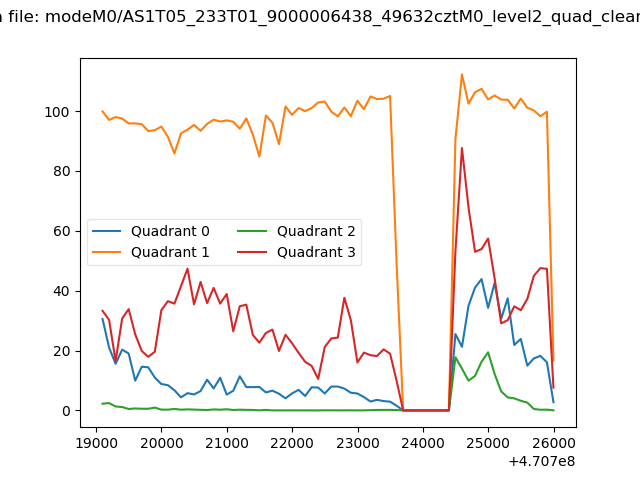 |
|
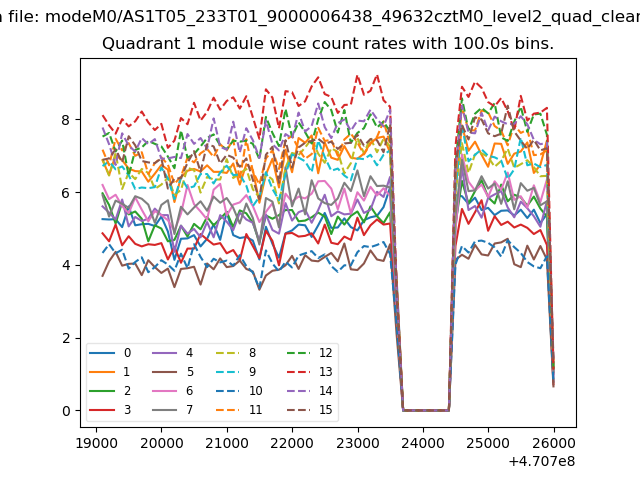
| Module-wise count rates for Quadrant A Data is divided into 100 sec bins |
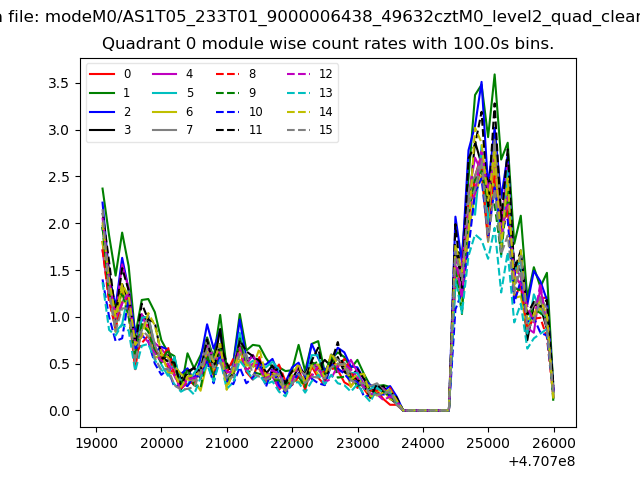 |
 |
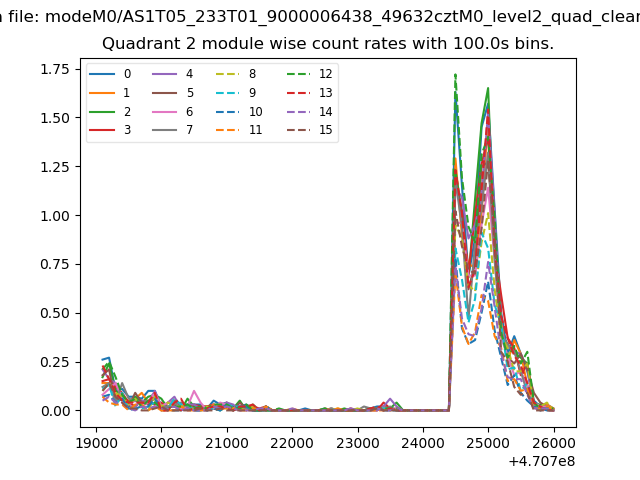
| Module-wise count rates for Quadrant B Data is divided into 100 sec bins |
 |
 |
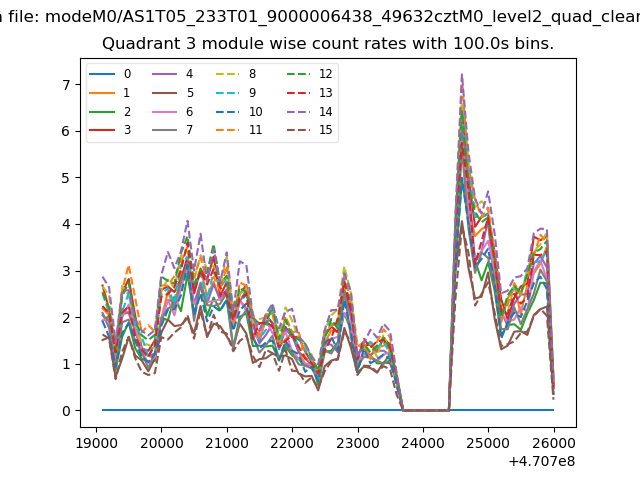
| Module-wise count rates for Quadrant C Data is divided into 100 sec bins |
 |
 |
| Module-wise count rates for Quadrant D Data is divided into 100 sec bins |
 |
 |
| Parameter | Plot |
|---|---|
| CZT HV Monitor |  |
| D_VDD | 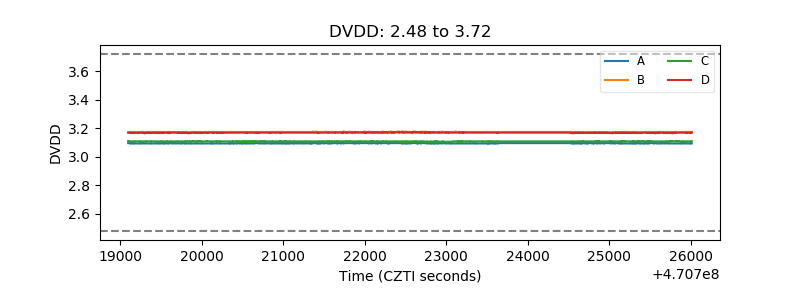 |
| Temperature 1 | 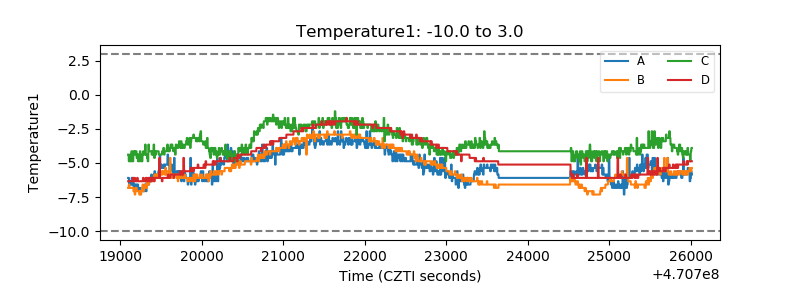 |
| Veto HV Monitor | 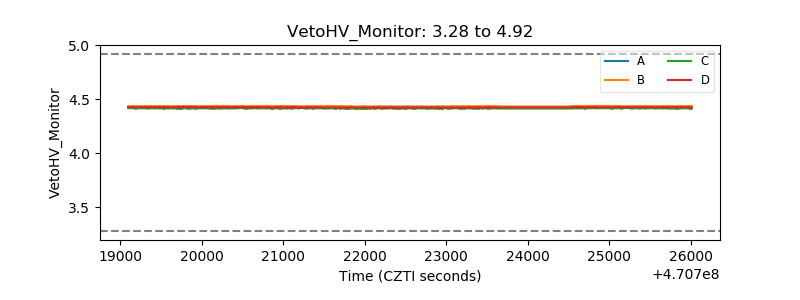 |
| Veto LLD | 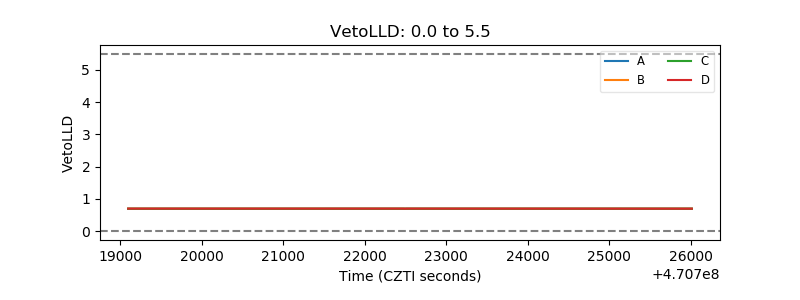 |
| Alpha Counter | 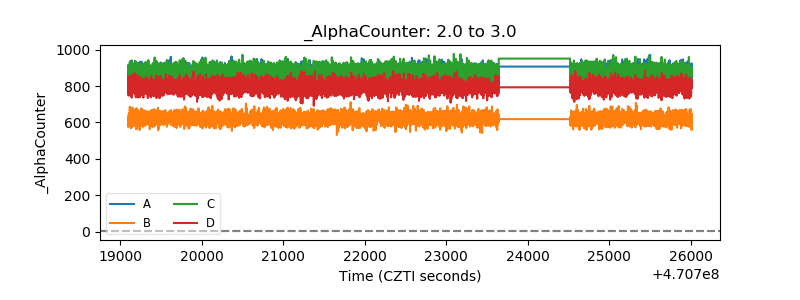 |
| _CPM_Rate | 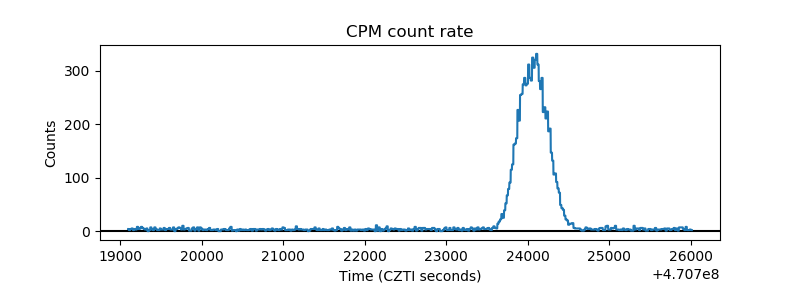 |
| CZT Counter | 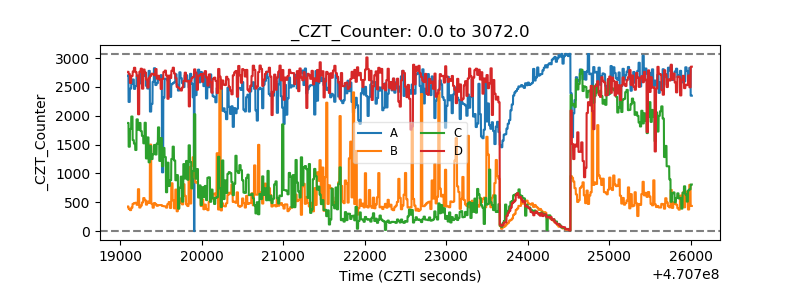 |
| +2.5 Volts monitor | 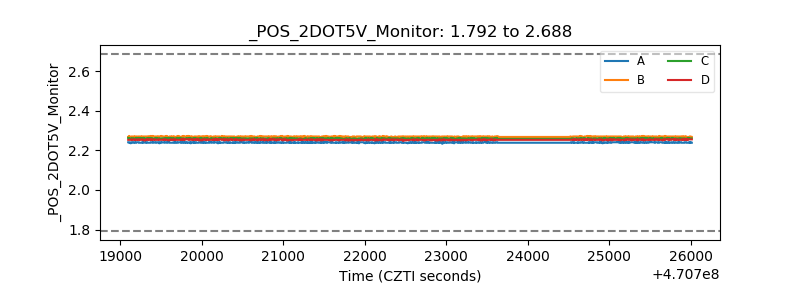 |
| +5 Volts monitor | 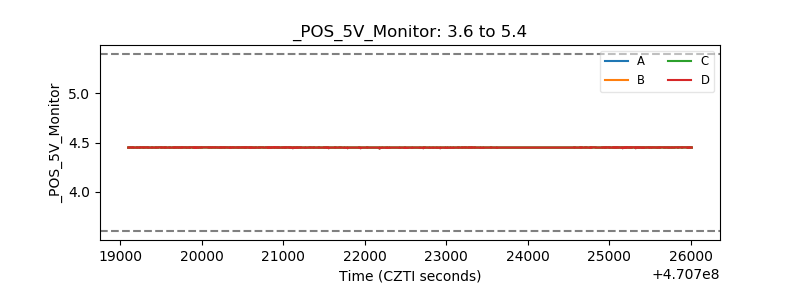 |
| _ROLL_ROT | 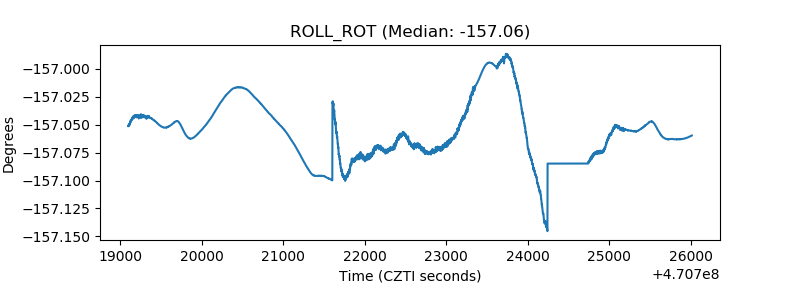 |
| _Roll_DEC | 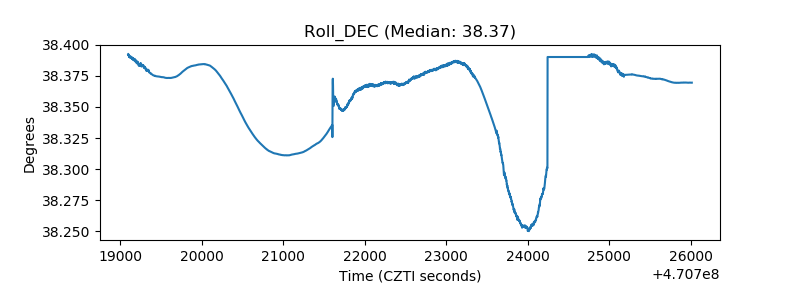 |
| _Roll_RA | 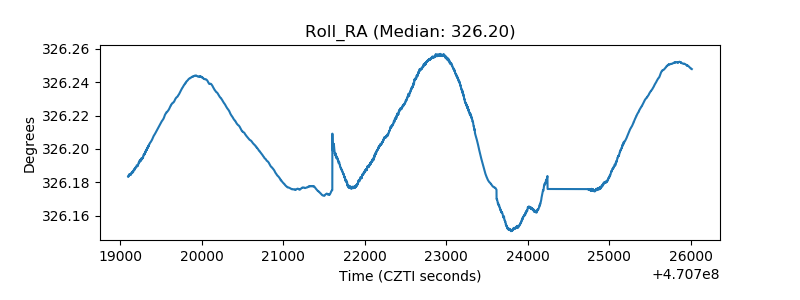 |
| Veto Counter | 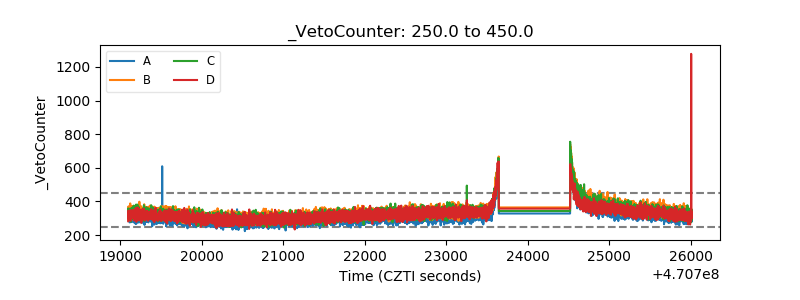 |