| Param | Original file | Final file |
|---|---|---|
| Filename | modeM0/AS1T05_233T01_9000006438_49634cztM0_level2.fits | modeM0/AS1T05_233T01_9000006438_49634cztM0_level2_quad_clean.evt |
| Size (bytes) | 1,192,455,360 | 49,754,880 |
| Size | 1.1 GB | 47.4 MB |
| Events in quadrant A | 14,747,959 | 127,675 |
| Events in quadrant B | 4,018,877 | 654,628 |
| Events in quadrant C | 8,571,231 | 36,435 |
| Events in quadrant D | 16,303,401 | 229,128 |
| Mode M9 | |||
|---|---|---|---|
| Quadrant | BADHDUFLAG | Total packets | Discarded packets |
| A | 0 | 10 | 0 |
| B | 0 | 10 | 0 |
| C | 0 | 10 | 0 |
| D | 0 | 10 | 0 |
| Mode SS | |||
|---|---|---|---|
| Quadrant | BADHDUFLAG | Total packets | Discarded packets |
| A | 0 | 132 | 0 |
| B | 0 | 132 | 0 |
| C | 0 | 132 | 0 |
| D | 0 | 132 | 0 |
| Mode M0 | |||
|---|---|---|---|
| Quadrant | BADHDUFLAG | Total packets | Discarded packets |
| A | 0 | 48216 | 0 |
| B | 0 | 16468 | 0 |
| C | 0 | 30042 | 0 |
| D | 0 | 52836 | 0 |
| Quadrant | Total seconds | Saturated seconds | Saturation percentage |
|---|---|---|---|
| A | 6437 | 6437 | 100.000000% |
| B | 6437 | 310 | 4.815908% |
| C | 6437 | 6437 | 100.000000% |
| D | 6437 | 6279 | 97.545440% |
Noise dominated data is calculated using 1-second bins in cleaned event files. If a bin has >2000 counts, and if more than 50% of those come from <1% of pixels, then it is considered to be noise-dominated and hence unusable.
| Quadrant | # 1 sec bins | Bins with >0 counts | Bins with >2000 counts | High rate bins dominated by noise | Noise dominated (total time) | Noise dominated (detector-on time) | Marked lightcurve |
|---|---|---|---|---|---|---|---|
| A | 7421 | 6436 | 4856 | 4856 | 65.44% | 75.45% | 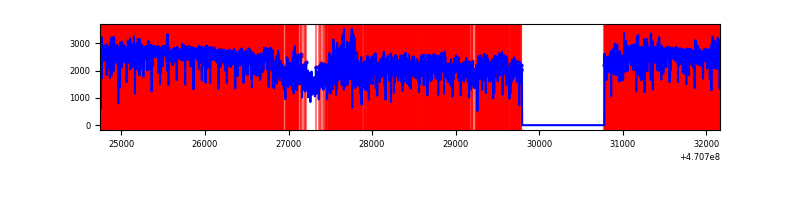 |
| B | 7422 | 6437 | 163 | 163 | 2.20% | 2.53% | 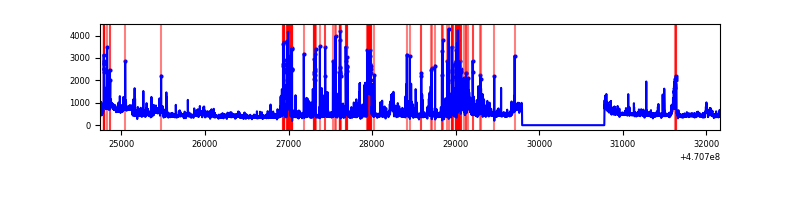 |
| C | 7421 | 6436 | 1708 | 1708 | 23.02% | 26.54% | 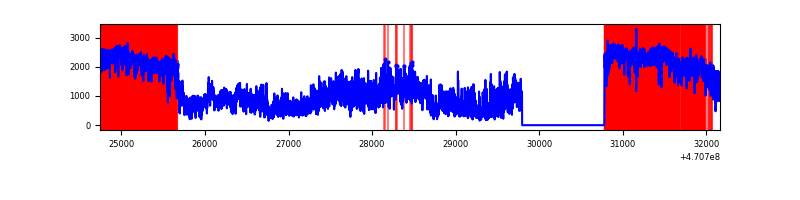 |
| D | 7421 | 6436 | 6003 | 6003 | 80.89% | 93.27% | 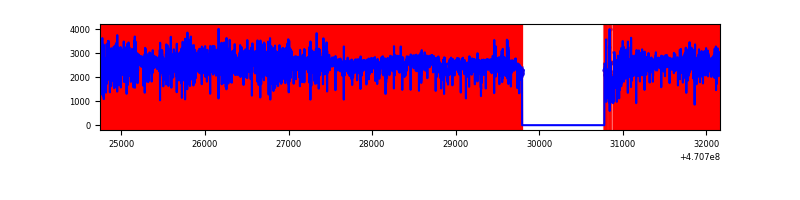 |
Top three noisy pixels from each quadrant. If the there are fewer than three noisy pixels in the level2.evt file, extra rows are filled as -1
| Pixel properties | Quadrant properties | ||||||
|---|---|---|---|---|---|---|---|
| Quadrant | DetID | PixID | Counts | Sigma | Mean | Median | Sigma |
| A | 0 | 99 | 8083813 | 148958.59 | 161 | 154 | 54.3 |
| A | 10 | 83 | 2471295 | 45536.02 | 161 | 154 | 54.3 |
| A | 12 | 50 | 908869 | 16745.0 | 161 | 154 | 54.3 |
| B | 4 | 206 | 430472 | 2975.37 | 679 | 658 | 144.5 |
| B | 10 | 41 | 199774 | 1378.37 | 679 | 658 | 144.5 |
| B | 3 | 233 | 109887 | 756.13 | 679 | 658 | 144.5 |
| C | 15 | 180 | 2930089 | 70738.41 | 58 | 53 | 41.4 |
| C | 15 | 163 | 1235433 | 29825.17 | 58 | 53 | 41.4 |
| C | 15 | 181 | 1039326 | 25090.65 | 58 | 53 | 41.4 |
| D | 15 | 40 | 5464742 | 42223.05 | 300 | 281 | 129.4 |
| D | 7 | 60 | 1559766 | 12049.9 | 300 | 281 | 129.4 |
| D | 15 | 184 | 989007 | 7639.73 | 300 | 281 | 129.4 |
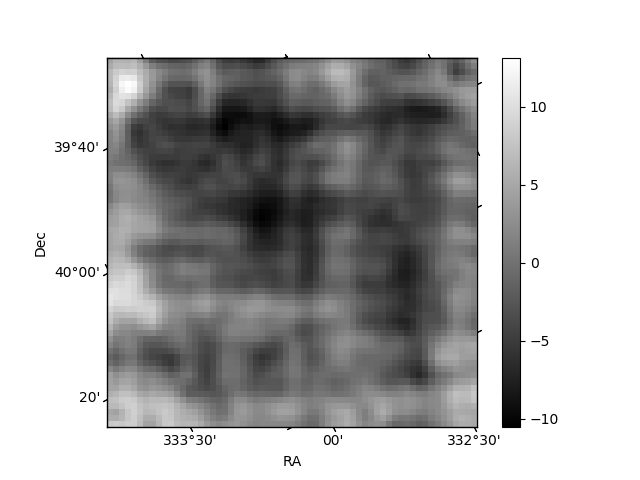
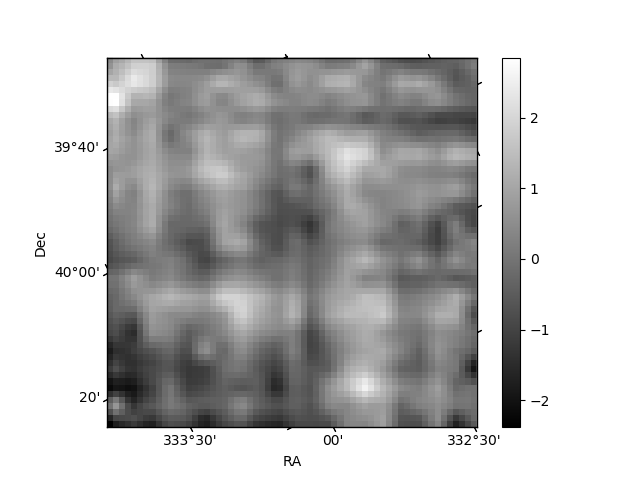
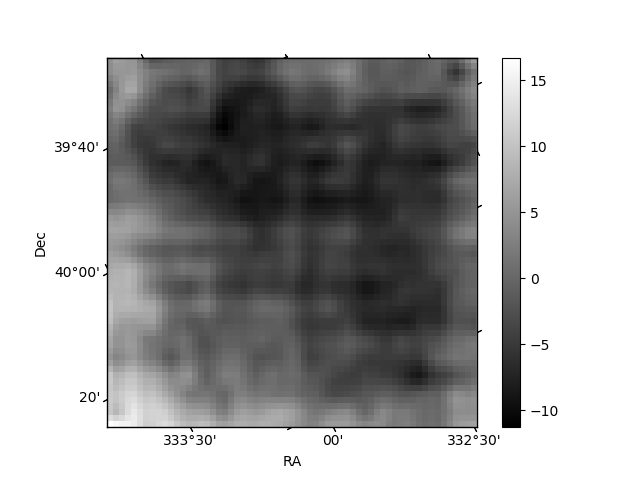
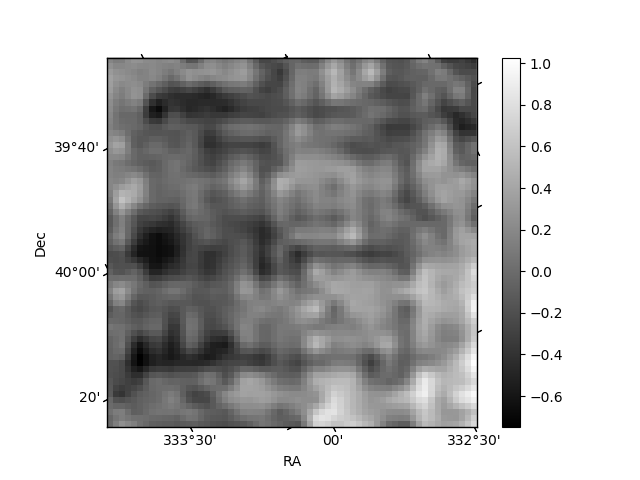
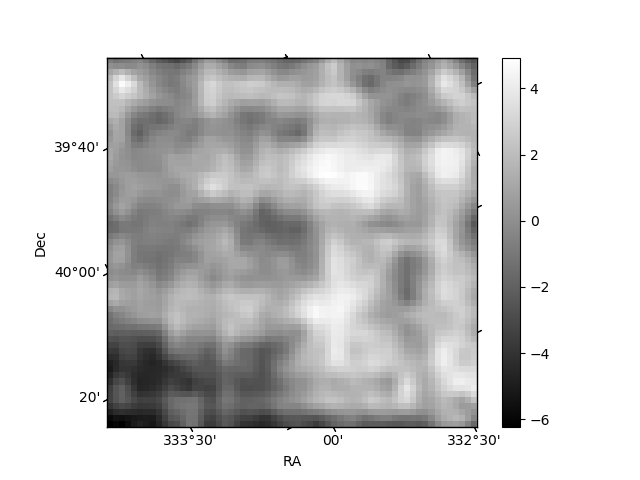
Histogram calculated using DETX and DETY for each event in the final _common_clean file
| Quadrant A | 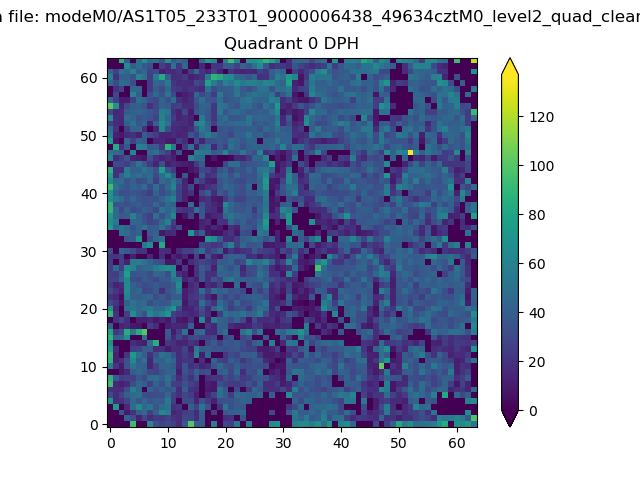 |
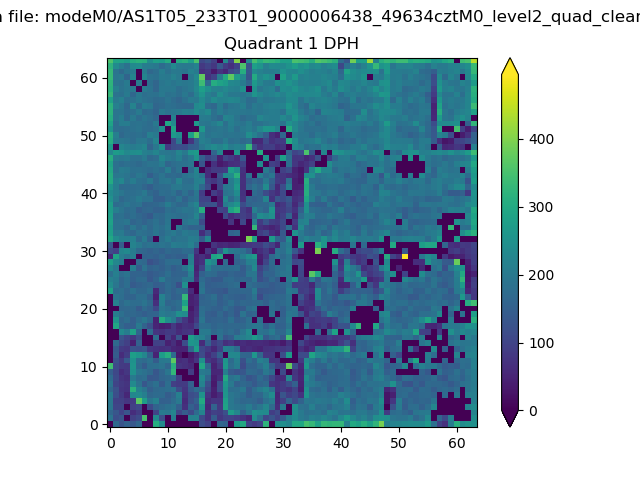 |
Quadrant B |
|---|---|---|---|
| Quadrant D | 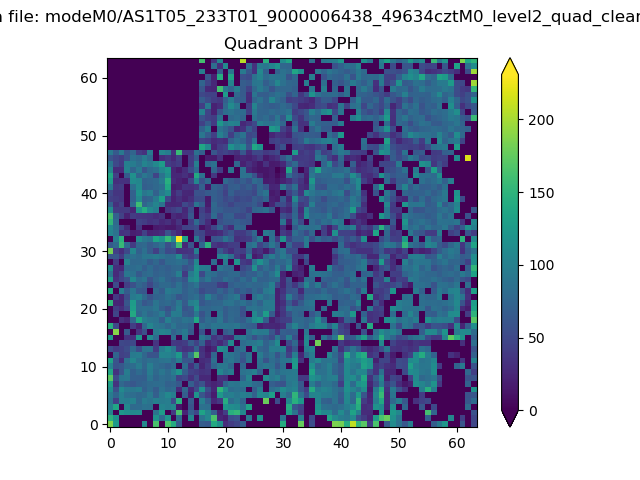 |
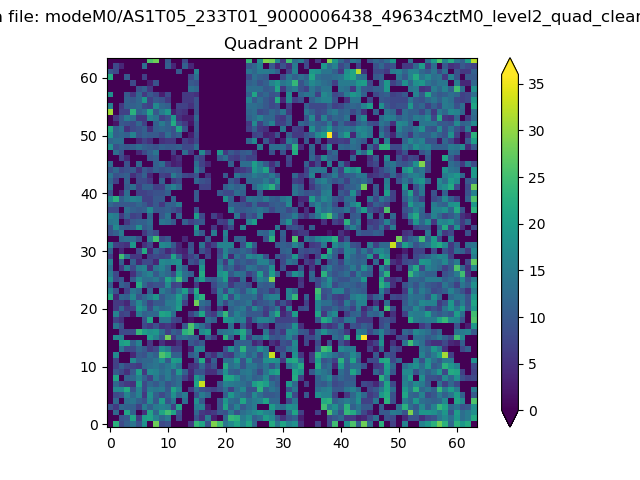 |
Quadrant C |
| Plot type | Count rate plots | Images |
|---|---|---|
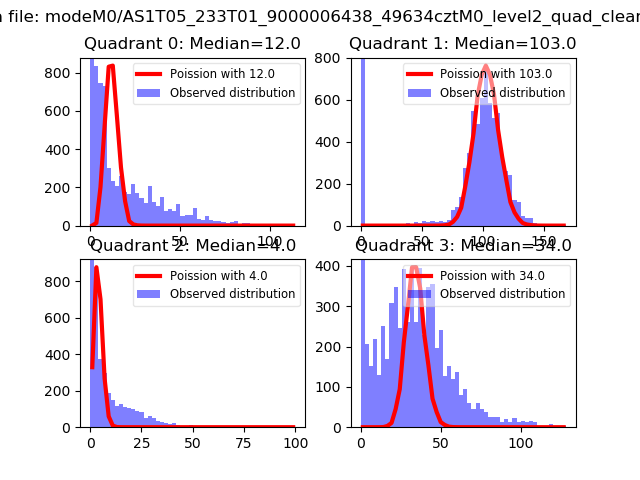
| Comparison with Poisson distribution Blue bars denote a histogram of data divided into 1 sec bins. Red curve is a Poisson curve with rate = median count rate of data. |
 |
 |
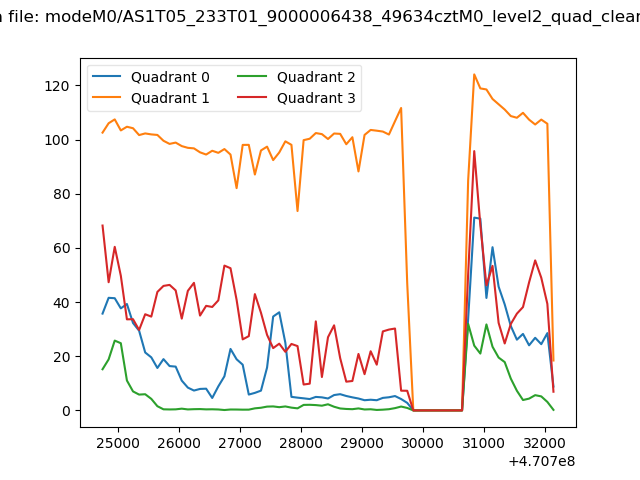
| Quadrant-wise count rates Data is divided into 100 sec bins |
 |
|
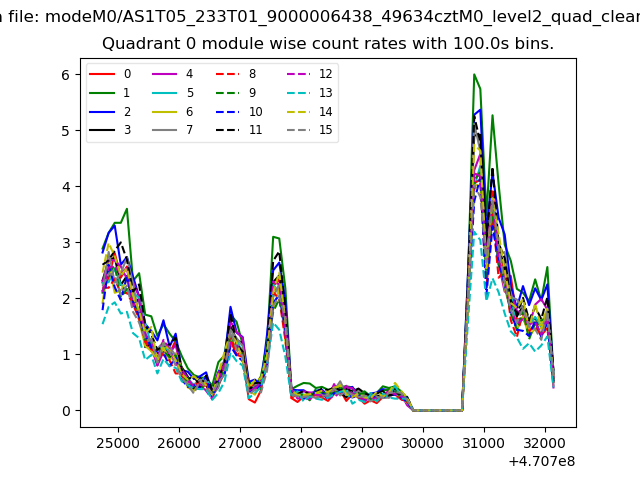
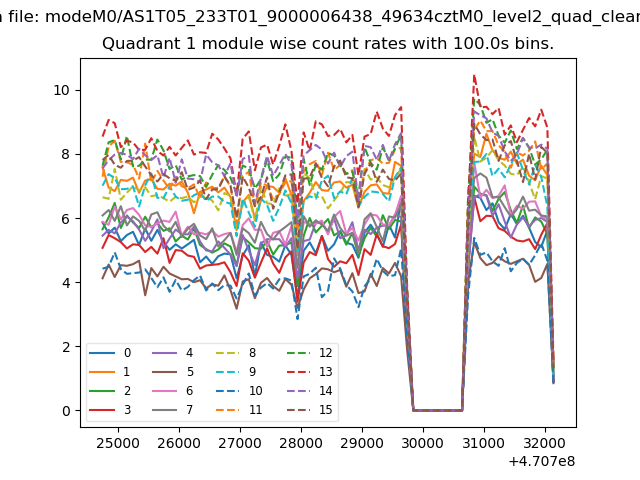
| Module-wise count rates for Quadrant A Data is divided into 100 sec bins |
 |
 |
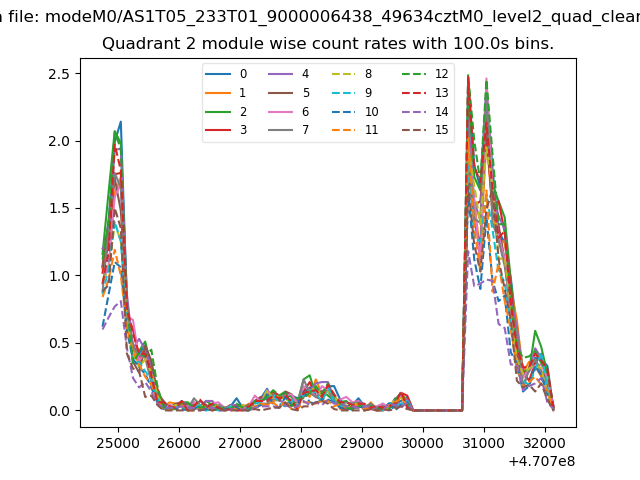
| Module-wise count rates for Quadrant B Data is divided into 100 sec bins |
 |
 |
| Module-wise count rates for Quadrant C Data is divided into 100 sec bins |
 |
 |
| Module-wise count rates for Quadrant D Data is divided into 100 sec bins |
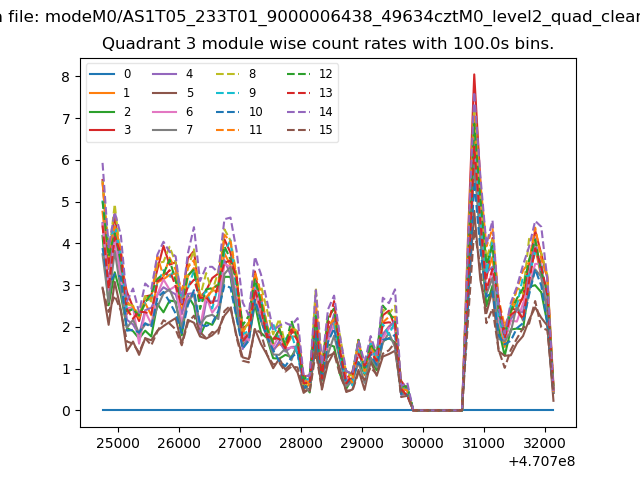 |
 |
| Parameter | Plot |
|---|---|
| CZT HV Monitor | 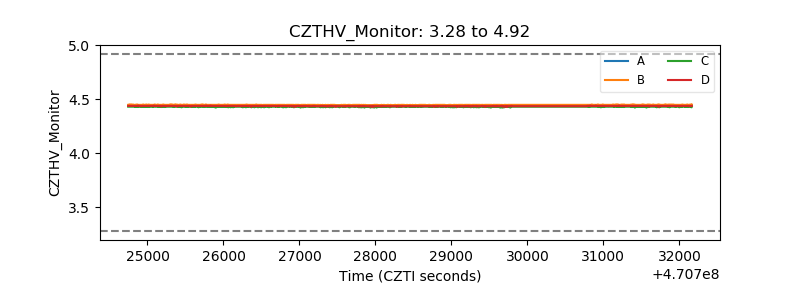 |
| D_VDD | 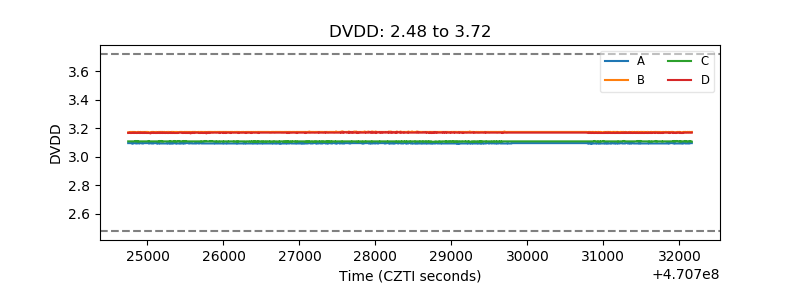 |
| Temperature 1 | 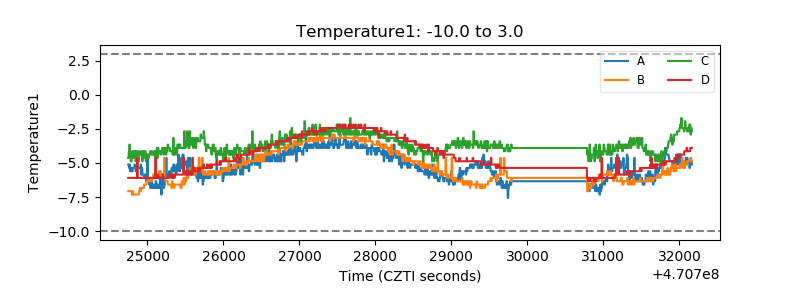 |
| Veto HV Monitor | 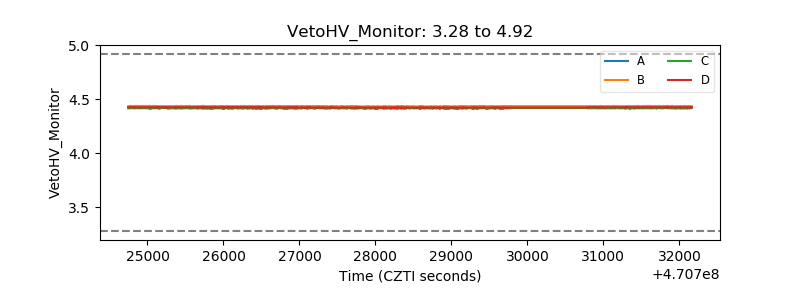 |
| Veto LLD | 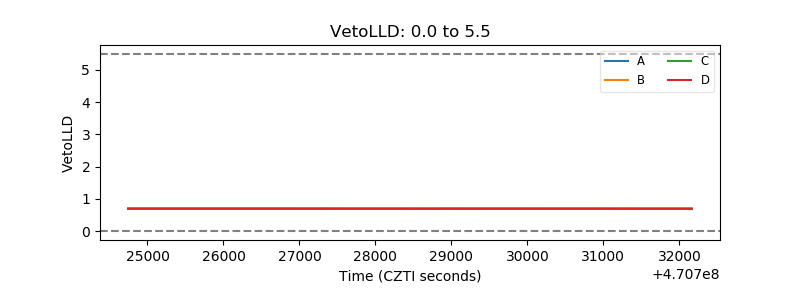 |
| Alpha Counter | 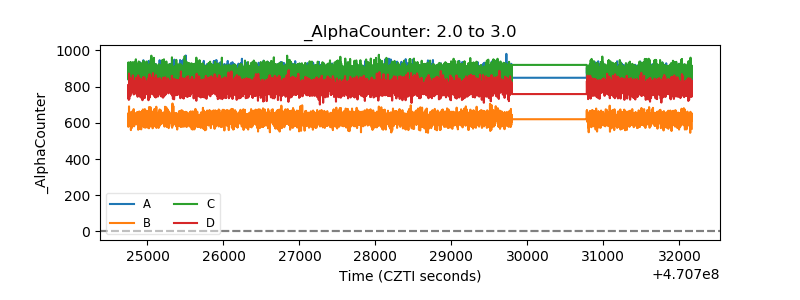 |
| _CPM_Rate | 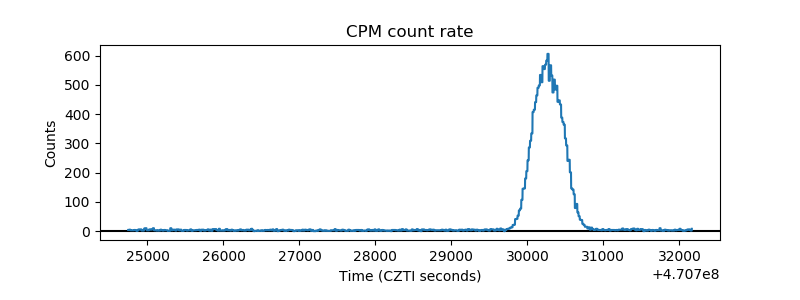 |
| CZT Counter | 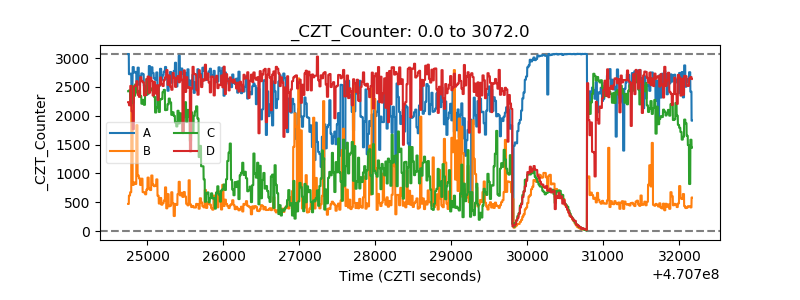 |
| +2.5 Volts monitor |  |
| +5 Volts monitor | 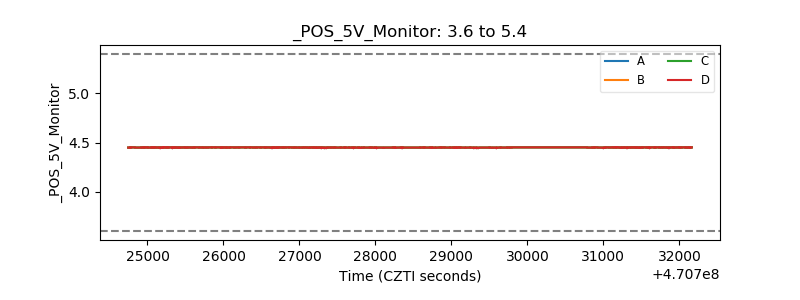 |
| _ROLL_ROT | 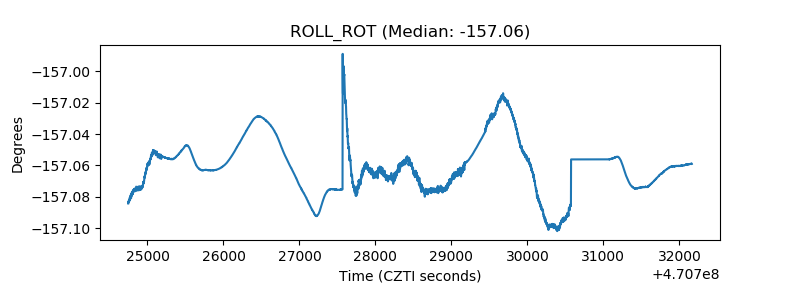 |
| _Roll_DEC | 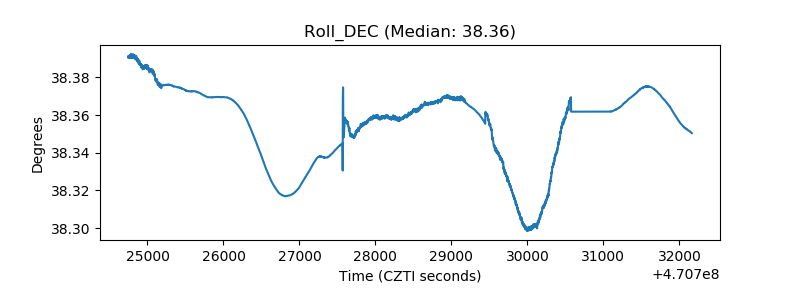 |
| _Roll_RA | 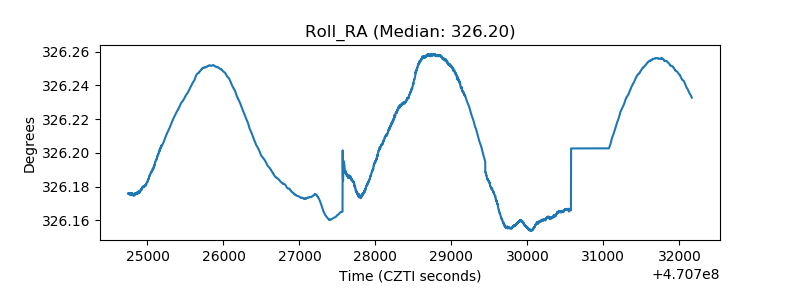 |
| Veto Counter | 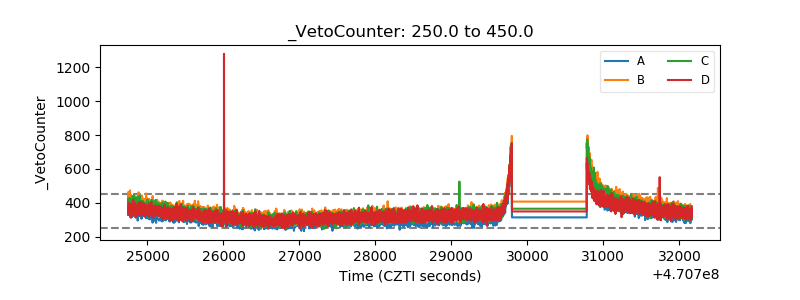 |