| Param | Original file | Final file |
|---|---|---|
| Filename | modeM0/AS1T05_233T01_9000006438_49635cztM0_level2.fits | modeM0/AS1T05_233T01_9000006438_49635cztM0_level2_quad_clean.evt |
| Size (bytes) | 1,241,856,000 | 49,363,200 |
| Size | 1.2 GB | 47.1 MB |
| Events in quadrant A | 15,333,773 | 138,275 |
| Events in quadrant B | 4,980,756 | 655,374 |
| Events in quadrant C | 9,003,485 | 22,973 |
| Events in quadrant D | 16,164,160 | 229,636 |
| Mode M9 | |||
|---|---|---|---|
| Quadrant | BADHDUFLAG | Total packets | Discarded packets |
| A | 0 | 11 | 0 |
| B | 0 | 11 | 0 |
| C | 0 | 11 | 0 |
| D | 0 | 11 | 0 |
| Mode SS | |||
|---|---|---|---|
| Quadrant | BADHDUFLAG | Total packets | Discarded packets |
| A | 0 | 126 | 0 |
| B | 0 | 126 | 0 |
| C | 0 | 126 | 0 |
| D | 0 | 126 | 0 |
| Mode M0 | |||
|---|---|---|---|
| Quadrant | BADHDUFLAG | Total packets | Discarded packets |
| A | 0 | 49863 | 0 |
| B | 0 | 19240 | 0 |
| C | 0 | 31217 | 0 |
| D | 0 | 52311 | 0 |
| Quadrant | Total seconds | Saturated seconds | Saturation percentage |
|---|---|---|---|
| A | 6300 | 6300 | 100.000000% |
| B | 6300 | 515 | 8.174603% |
| C | 6300 | 6300 | 100.000000% |
| D | 6300 | 6184 | 98.158730% |
Noise dominated data is calculated using 1-second bins in cleaned event files. If a bin has >2000 counts, and if more than 50% of those come from <1% of pixels, then it is considered to be noise-dominated and hence unusable.
| Quadrant | # 1 sec bins | Bins with >0 counts | Bins with >2000 counts | High rate bins dominated by noise | Noise dominated (total time) | Noise dominated (detector-on time) | Marked lightcurve |
|---|---|---|---|---|---|---|---|
| A | 7364 | 6299 | 5830 | 5830 | 79.17% | 92.55% | 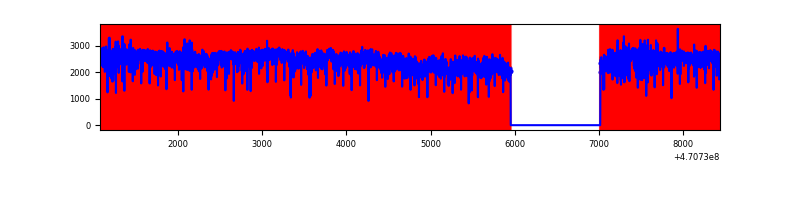 |
| B | 7365 | 6300 | 299 | 299 | 4.06% | 4.75% | 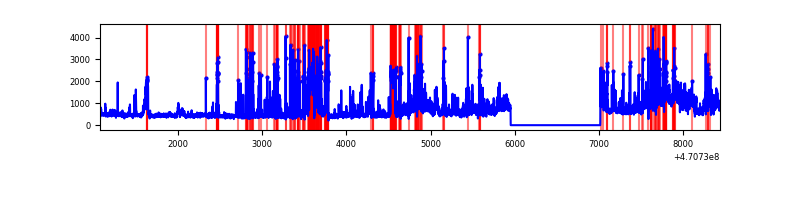 |
| C | 7364 | 6299 | 1170 | 1170 | 15.89% | 18.57% | 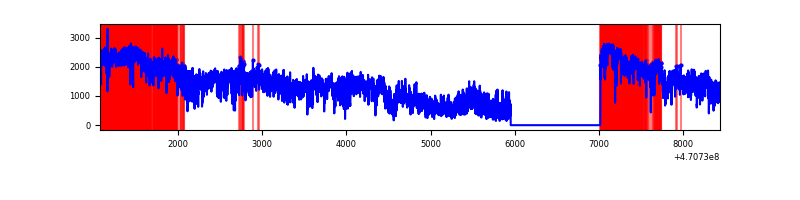 |
| D | 7365 | 6300 | 5953 | 5953 | 80.83% | 94.49% |  |
Top three noisy pixels from each quadrant. If the there are fewer than three noisy pixels in the level2.evt file, extra rows are filled as -1
| Pixel properties | Quadrant properties | ||||||
|---|---|---|---|---|---|---|---|
| Quadrant | DetID | PixID | Counts | Sigma | Mean | Median | Sigma |
| A | 0 | 99 | 8780167 | 130418.85 | 173 | 165 | 67.3 |
| A | 10 | 83 | 2538365 | 37702.62 | 173 | 165 | 67.3 |
| A | 0 | 98 | 963967 | 14316.39 | 173 | 165 | 67.3 |
| B | 4 | 206 | 877640 | 6161.7 | 666 | 646 | 142.3 |
| B | 4 | 170 | 615053 | 4316.78 | 666 | 646 | 142.3 |
| B | 5 | 49 | 208204 | 1458.29 | 666 | 646 | 142.3 |
| C | 15 | 180 | 3145165 | 102051.12 | 44 | 40 | 30.8 |
| C | 15 | 163 | 1230894 | 39938.01 | 44 | 40 | 30.8 |
| C | 15 | 181 | 988639 | 32077.46 | 44 | 40 | 30.8 |
| D | 15 | 40 | 5934279 | 44043.46 | 301 | 280 | 134.7 |
| D | 7 | 60 | 990412 | 7348.98 | 301 | 280 | 134.7 |
| D | 15 | 74 | 908006 | 6737.34 | 301 | 280 | 134.7 |
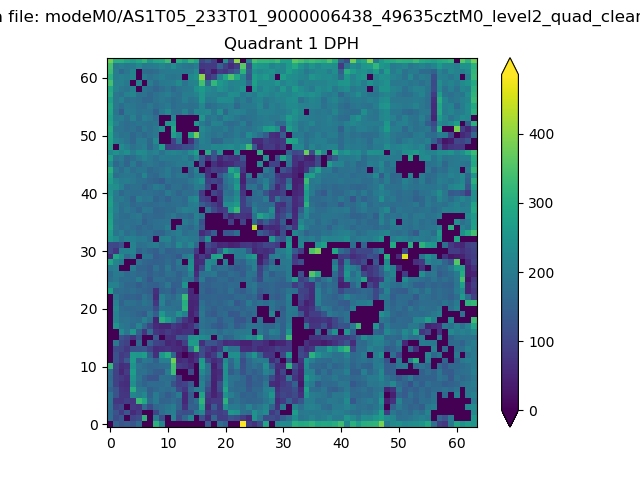
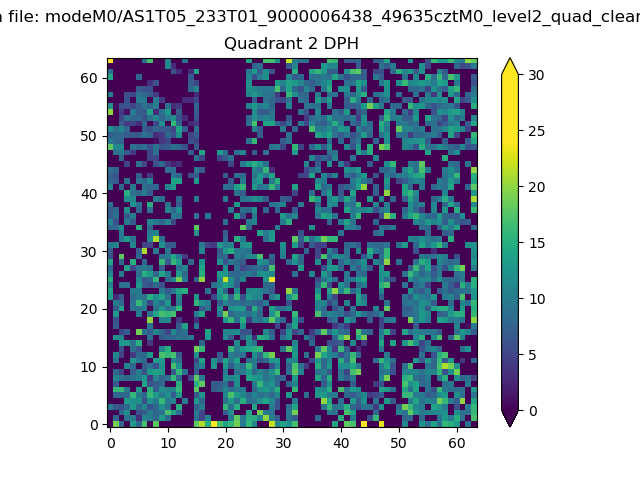
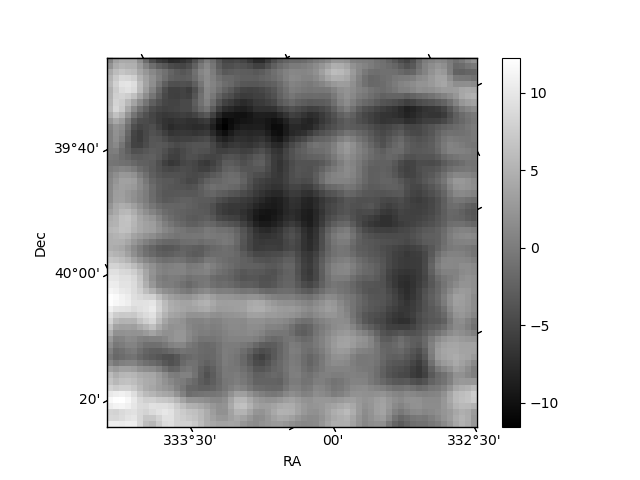
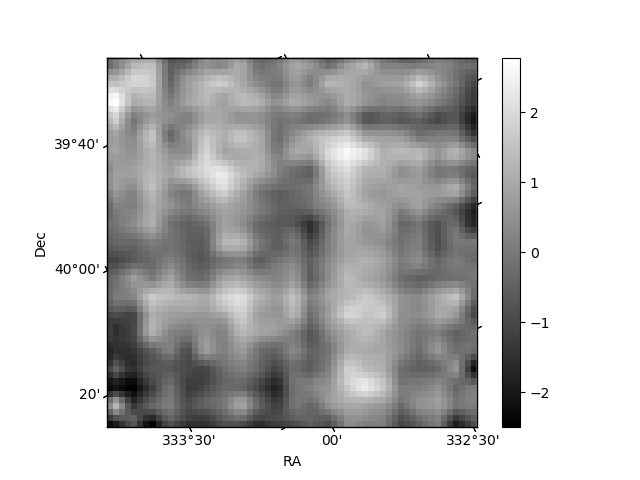
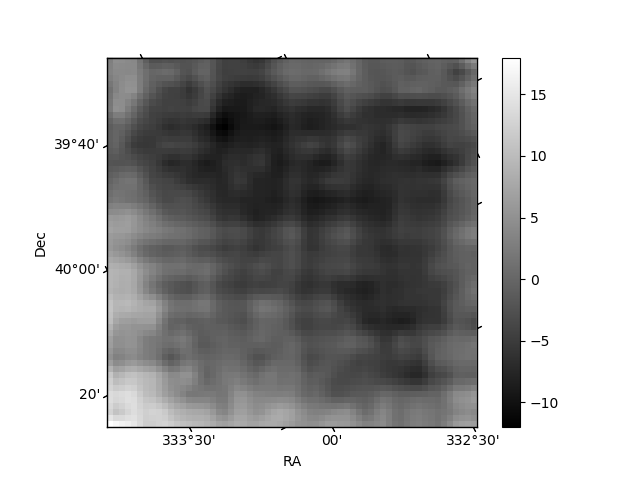
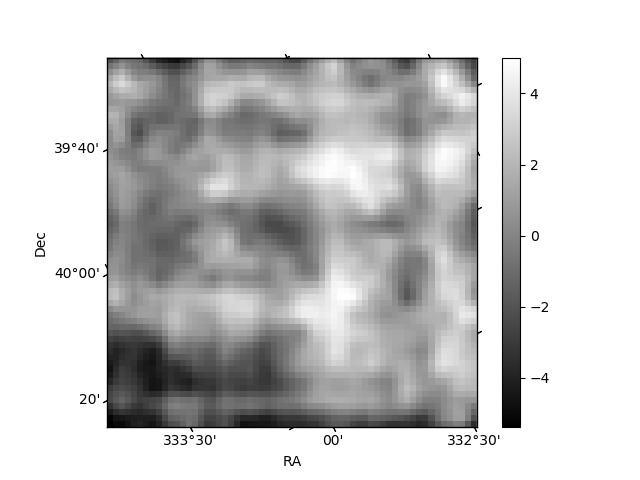
Histogram calculated using DETX and DETY for each event in the final _common_clean file
| Quadrant A | 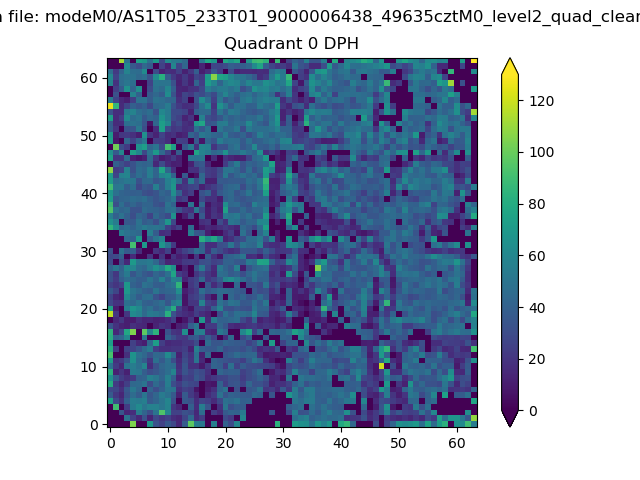 |
 |
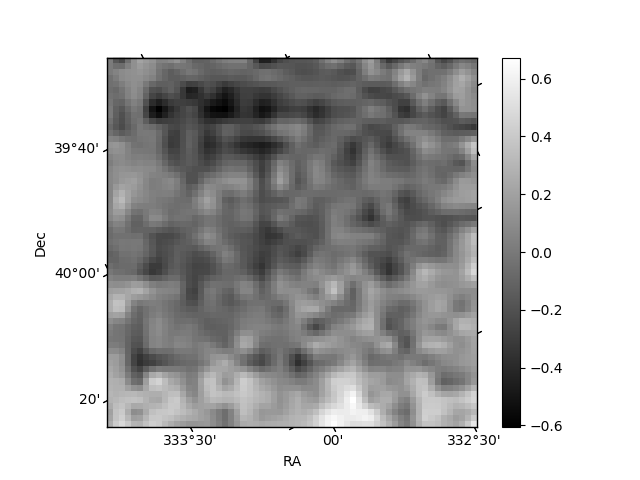
Quadrant B |
|---|---|---|---|
| Quadrant D | 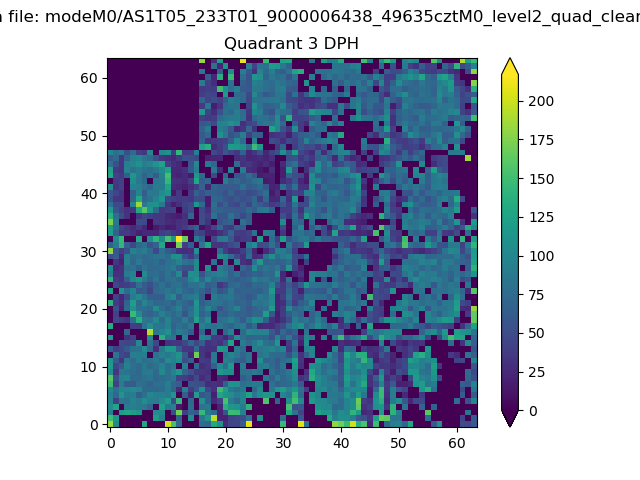 |
 |
Quadrant C |
| Plot type | Count rate plots | Images |
|---|---|---|
| Comparison with Poisson distribution Blue bars denote a histogram of data divided into 1 sec bins. Red curve is a Poisson curve with rate = median count rate of data. |
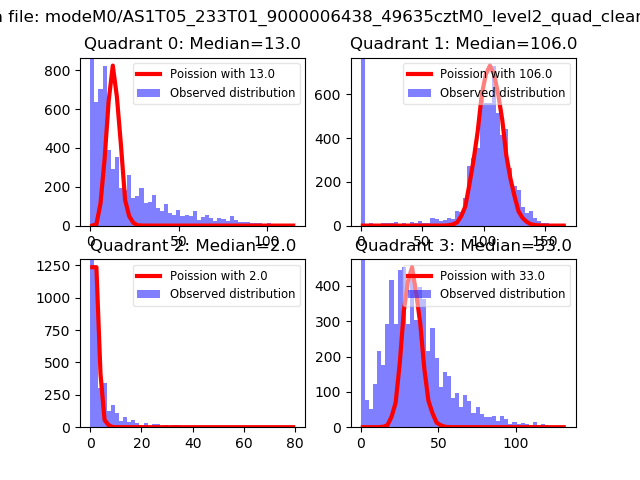 |
 |
| Quadrant-wise count rates Data is divided into 100 sec bins |
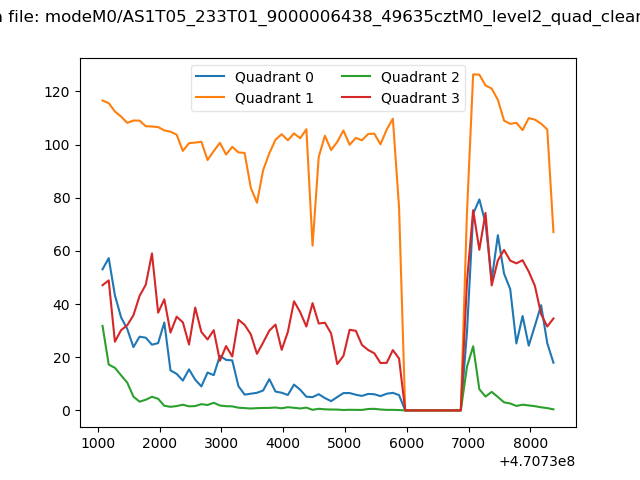 |
|
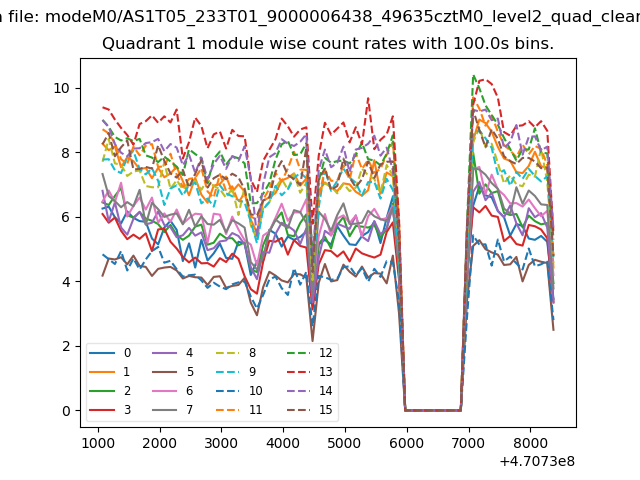
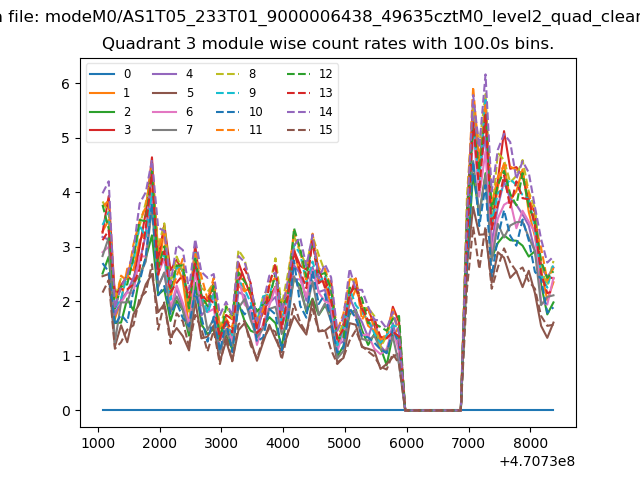
| Module-wise count rates for Quadrant A Data is divided into 100 sec bins |
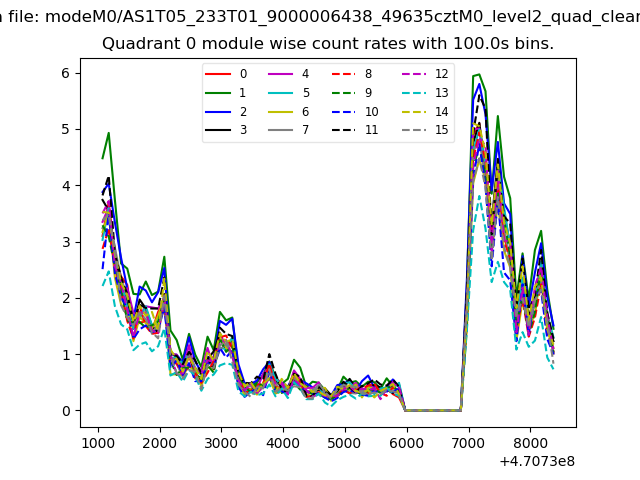 |
 |
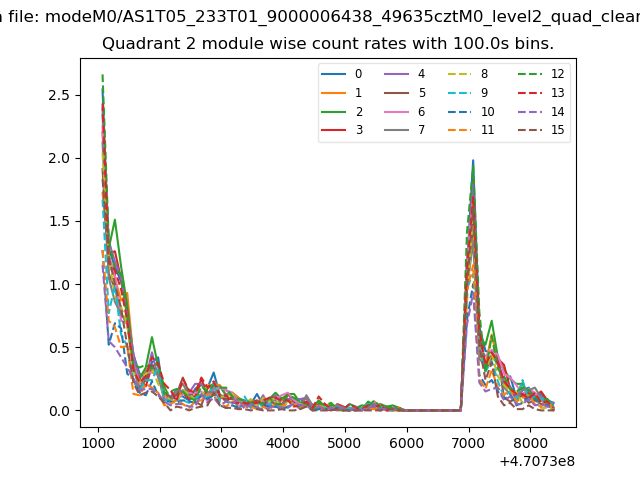
| Module-wise count rates for Quadrant B Data is divided into 100 sec bins |
 |
 |
| Module-wise count rates for Quadrant C Data is divided into 100 sec bins |
 |
 |
| Module-wise count rates for Quadrant D Data is divided into 100 sec bins |
 |
 |
| Parameter | Plot |
|---|---|
| CZT HV Monitor | 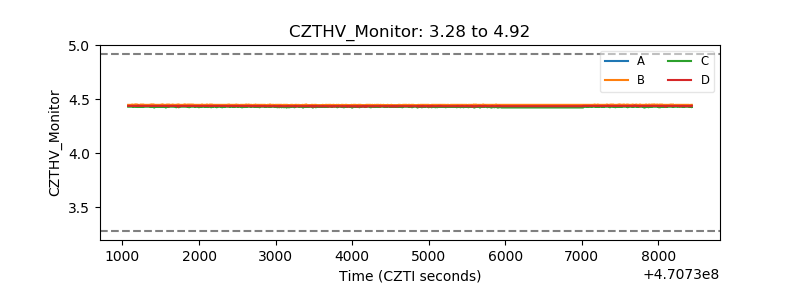 |
| D_VDD | 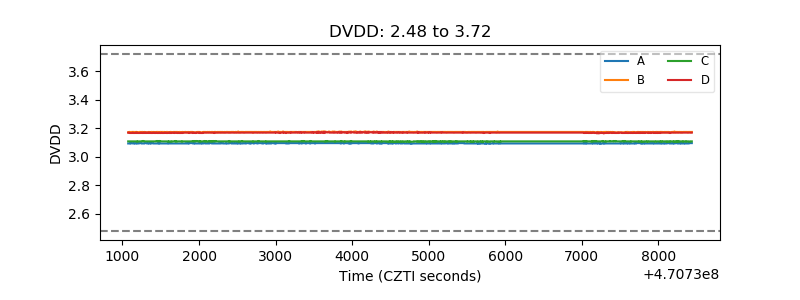 |
| Temperature 1 | 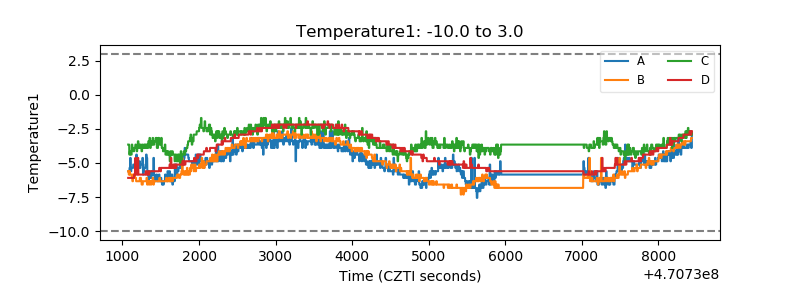 |
| Veto HV Monitor | 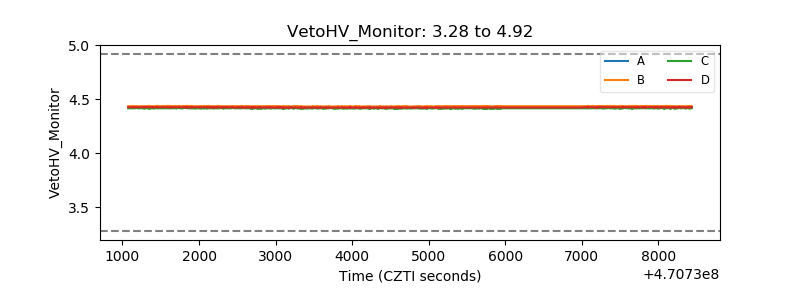 |
| Veto LLD | 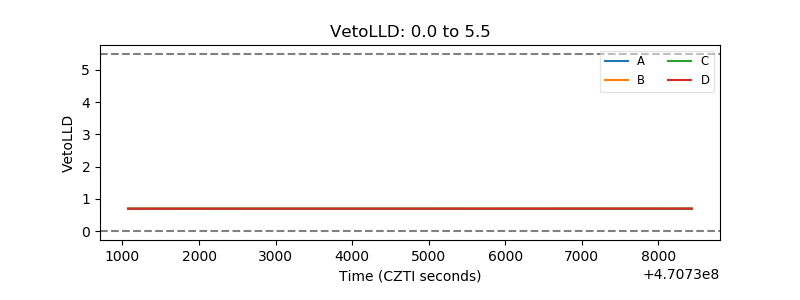 |
| Alpha Counter | 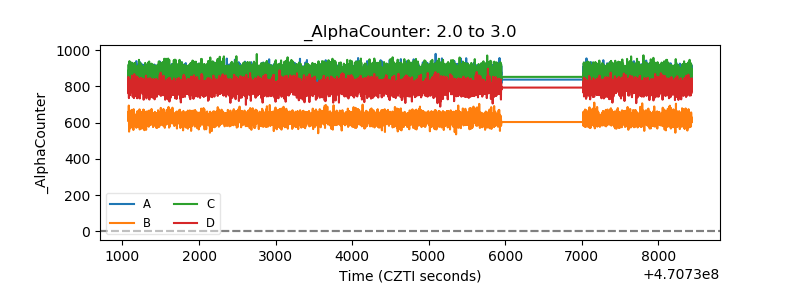 |
| _CPM_Rate | 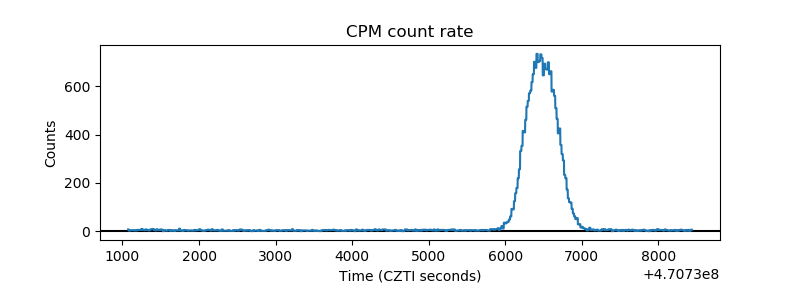 |
| CZT Counter | 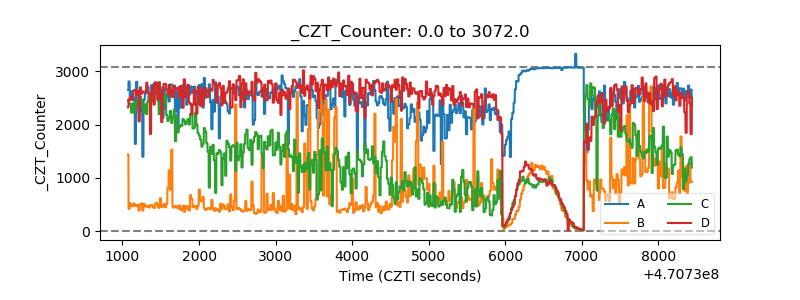 |
| +2.5 Volts monitor | 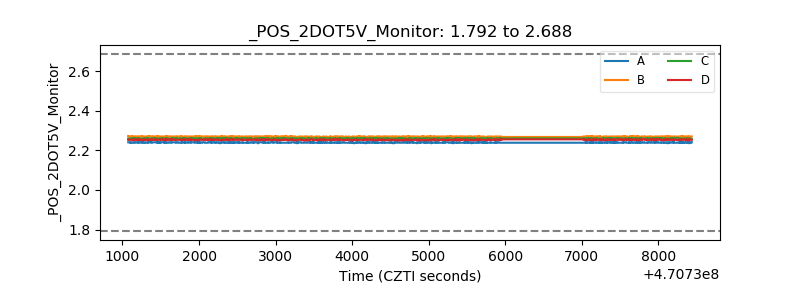 |
| +5 Volts monitor | 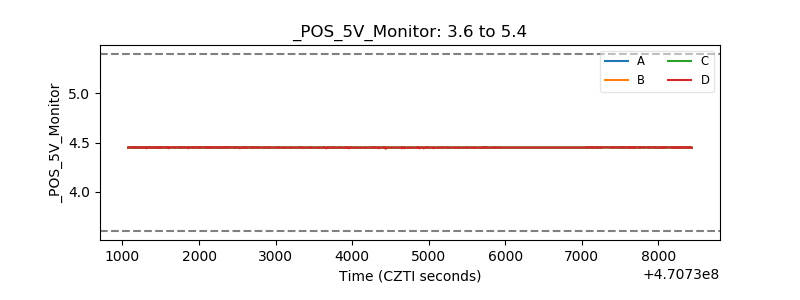 |
| _ROLL_ROT | 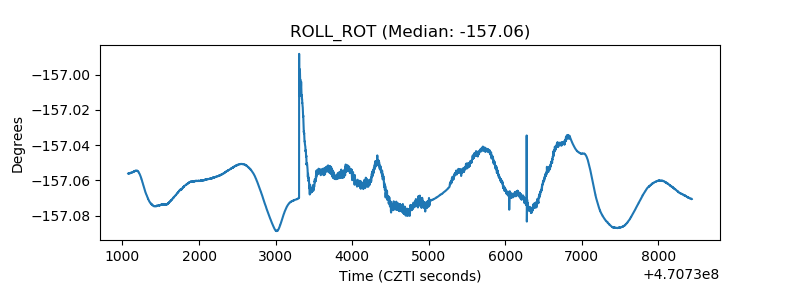 |
| _Roll_DEC | 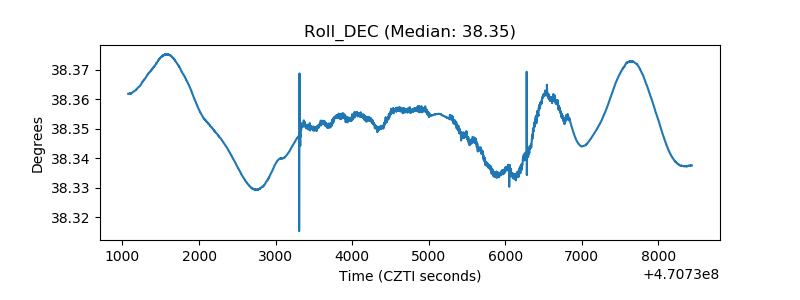 |
| _Roll_RA | 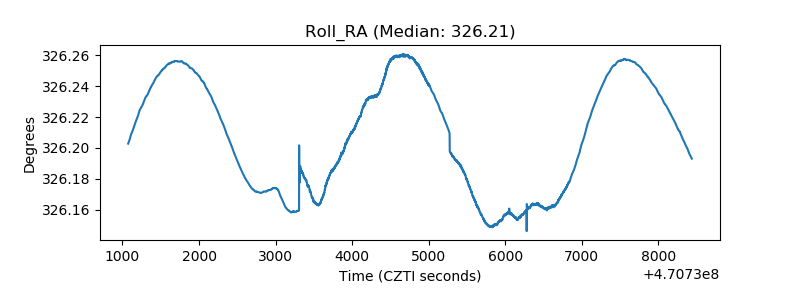 |
| Veto Counter | 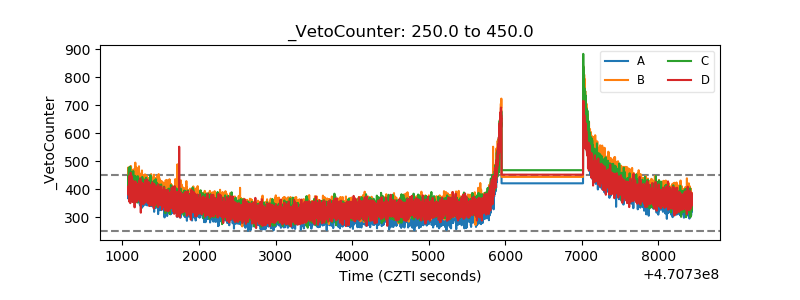 |