| Param | Original file | Final file |
|---|---|---|
| Filename | modeM0/AS1T05_233T01_9000006438_49637cztM0_level2.fits | modeM0/AS1T05_233T01_9000006438_49637cztM0_level2_quad_clean.evt |
| Size (bytes) | 1,212,209,280 | 35,400,960 |
| Size | 1.1 GB | 33.8 MB |
| Events in quadrant A | 13,509,550 | 691 |
| Events in quadrant B | 6,702,824 | 585,096 |
| Events in quadrant C | 8,640,703 | 1,249 |
| Events in quadrant D | 15,520,839 | 36,556 |
| Mode M9 | |||
|---|---|---|---|
| Quadrant | BADHDUFLAG | Total packets | Discarded packets |
| A | 0 | 11 | 0 |
| B | 0 | 11 | 0 |
| C | 0 | 11 | 0 |
| D | 0 | 11 | 0 |
| Mode SS | |||
|---|---|---|---|
| Quadrant | BADHDUFLAG | Total packets | Discarded packets |
| A | 0 | 130 | 0 |
| B | 0 | 130 | 0 |
| C | 0 | 130 | 0 |
| D | 0 | 130 | 0 |
| Mode M0 | |||
|---|---|---|---|
| Quadrant | BADHDUFLAG | Total packets | Discarded packets |
| A | 0 | 44542 | 1 |
| B | 0 | 24332 | 1 |
| C | 0 | 30153 | 1 |
| D | 0 | 50500 | 7 |
| Quadrant | Total seconds | Saturated seconds | Saturation percentage |
|---|---|---|---|
| A | 6422 | 6418 | 99.937714% |
| B | 6422 | 1252 | 19.495484% |
| C | 6422 | 6415 | 99.891000% |
| D | 6422 | 6109 | 95.126129% |
Noise dominated data is calculated using 1-second bins in cleaned event files. If a bin has >2000 counts, and if more than 50% of those come from <1% of pixels, then it is considered to be noise-dominated and hence unusable.
| Quadrant | # 1 sec bins | Bins with >0 counts | Bins with >2000 counts | High rate bins dominated by noise | Noise dominated (total time) | Noise dominated (detector-on time) | Marked lightcurve |
|---|---|---|---|---|---|---|---|
| A | 7517 | 6422 | 3944 | 3944 | 52.47% | 61.41% | 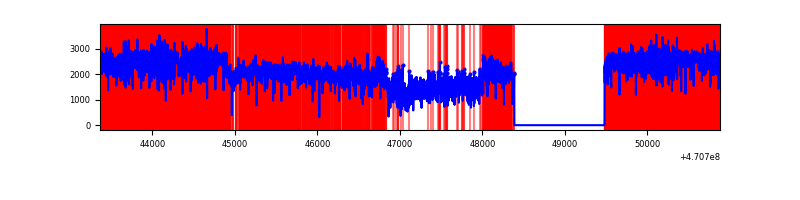 |
| B | 7517 | 6422 | 932 | 932 | 12.40% | 14.51% | 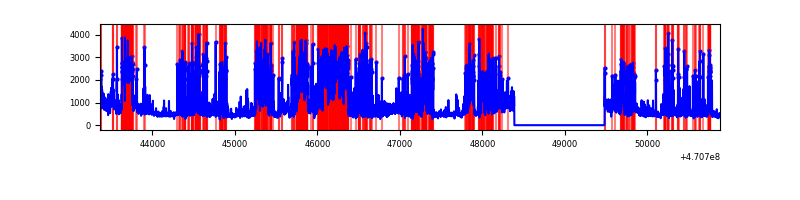 |
| C | 7516 | 6421 | 1680 | 1680 | 22.35% | 26.16% | 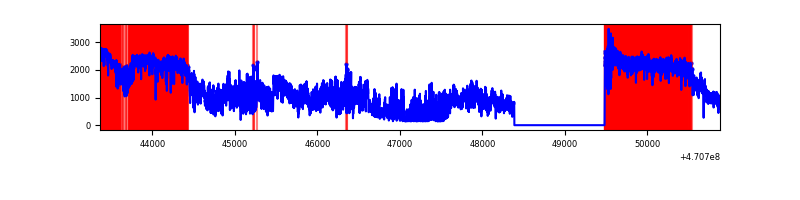 |
| D | 7516 | 6421 | 5554 | 5554 | 73.90% | 86.50% | 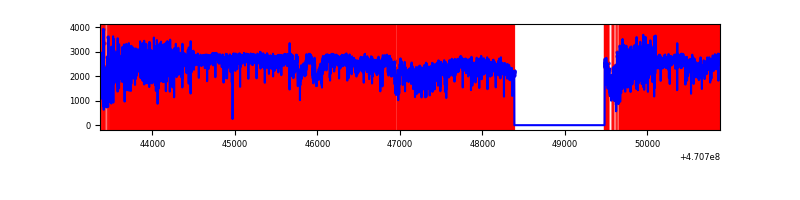 |
Top three noisy pixels from each quadrant. If the there are fewer than three noisy pixels in the level2.evt file, extra rows are filled as -1
| Pixel properties | Quadrant properties | ||||||
|---|---|---|---|---|---|---|---|
| Quadrant | DetID | PixID | Counts | Sigma | Mean | Median | Sigma |
| A | 0 | 99 | 4218765 | 61883.35 | 217 | 208 | 68.2 |
| A | 10 | 83 | 3173265 | 46546.58 | 217 | 208 | 68.2 |
| A | 4 | 60 | 1474317 | 21624.17 | 217 | 208 | 68.2 |
| B | 3 | 232 | 1231109 | 8875.81 | 656 | 638 | 138.6 |
| B | 4 | 170 | 1008284 | 7268.49 | 656 | 638 | 138.6 |
| B | 4 | 206 | 918677 | 6622.13 | 656 | 638 | 138.6 |
| C | 15 | 180 | 3533404 | 134158.66 | 53 | 51 | 26.3 |
| C | 15 | 181 | 903797 | 34314.53 | 53 | 51 | 26.3 |
| C | 15 | 163 | 753127 | 28593.71 | 53 | 51 | 26.3 |
| D | 15 | 40 | 4569871 | 42485.7 | 245 | 229 | 107.6 |
| D | 15 | 184 | 1999586 | 18588.78 | 245 | 229 | 107.6 |
| D | 7 | 61 | 1157651 | 10760.99 | 245 | 229 | 107.6 |
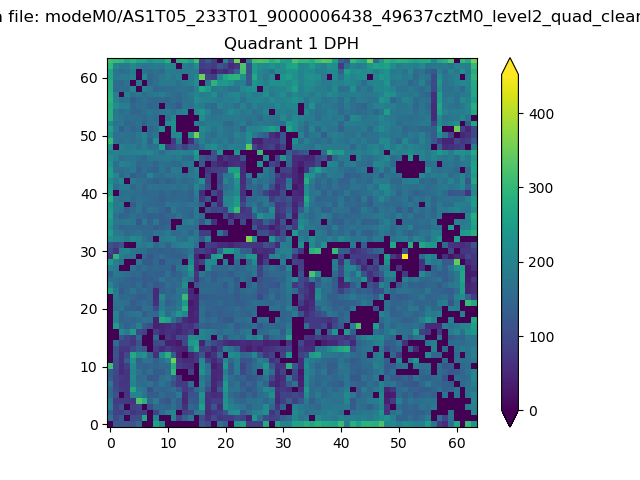
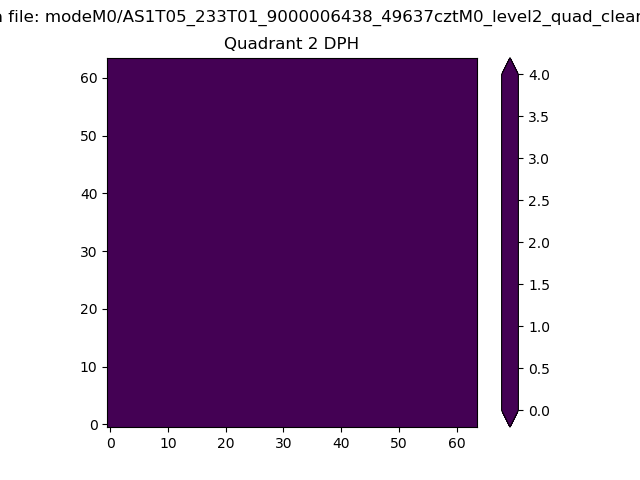
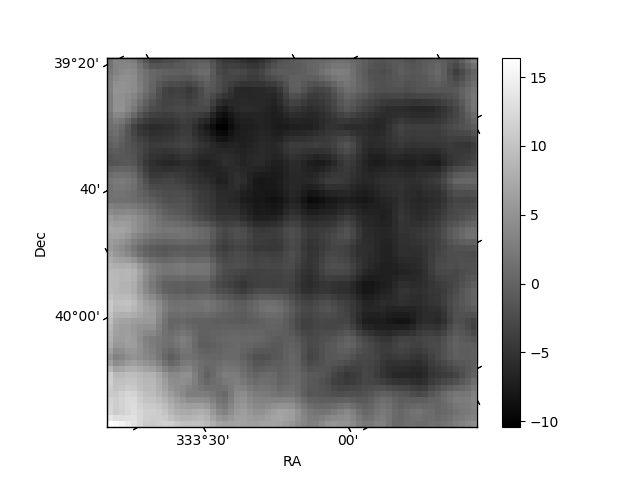
Histogram calculated using DETX and DETY for each event in the final _common_clean file
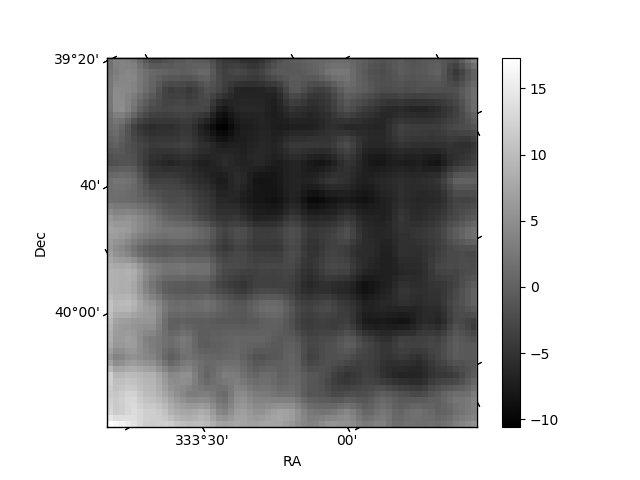
| Quadrant A |  |
 |
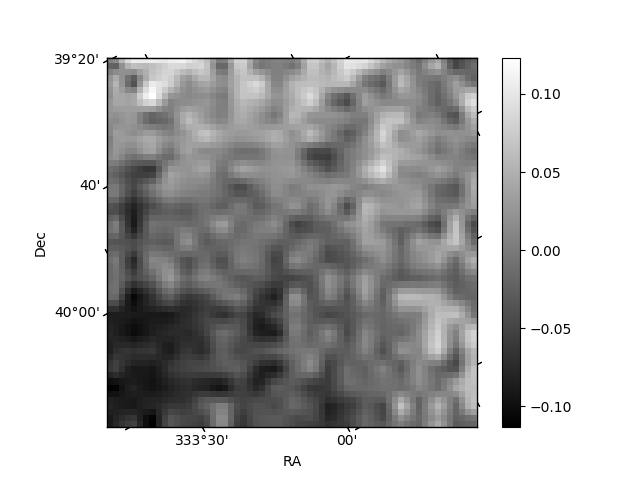
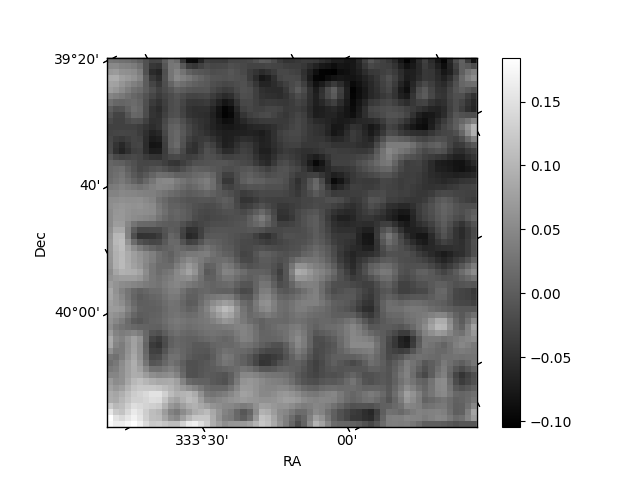
Quadrant B |
|---|---|---|---|
| Quadrant D | 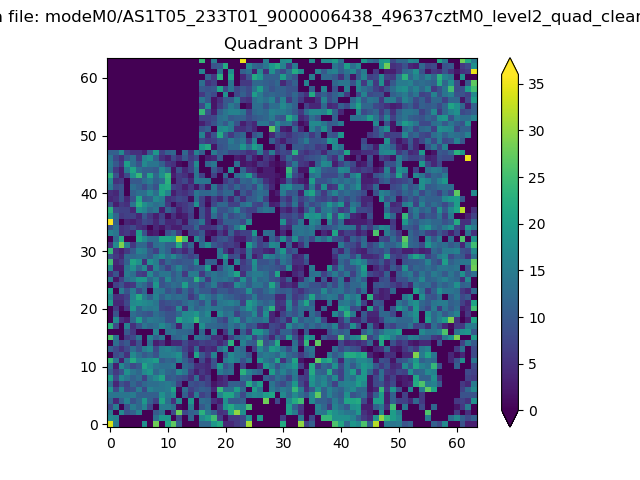 |
 |
Quadrant C |
| Plot type | Count rate plots | Images |
|---|---|---|
| Comparison with Poisson distribution Blue bars denote a histogram of data divided into 1 sec bins. Red curve is a Poisson curve with rate = median count rate of data. |
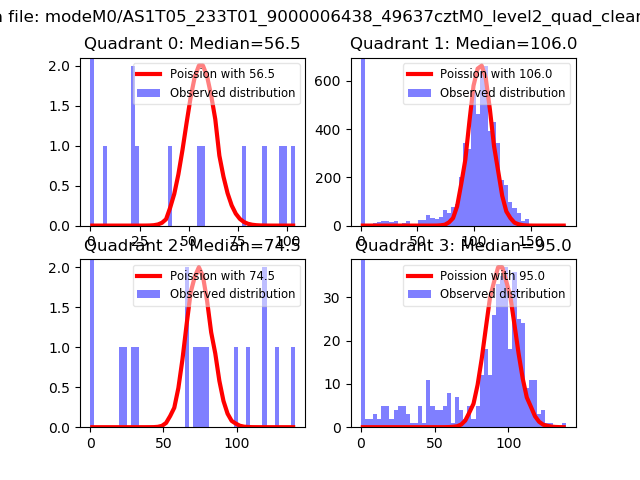 |
 |
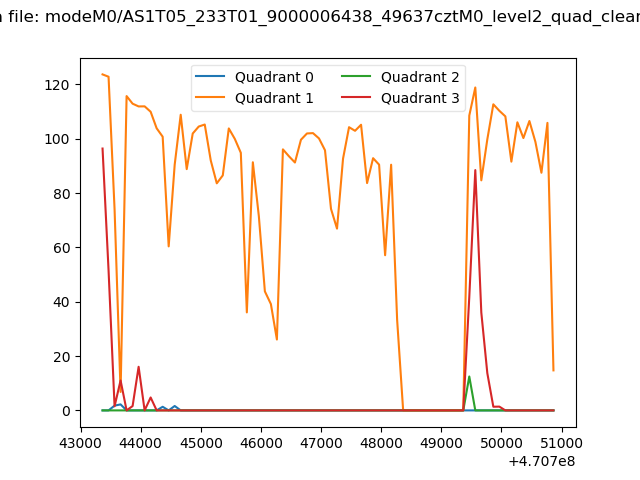
| Quadrant-wise count rates Data is divided into 100 sec bins |
 |
|
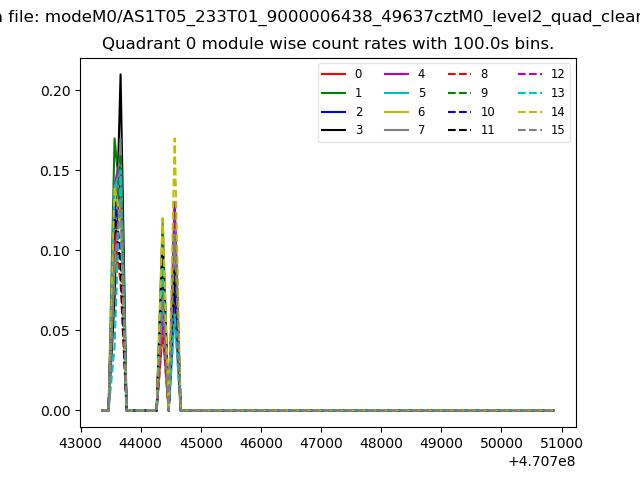
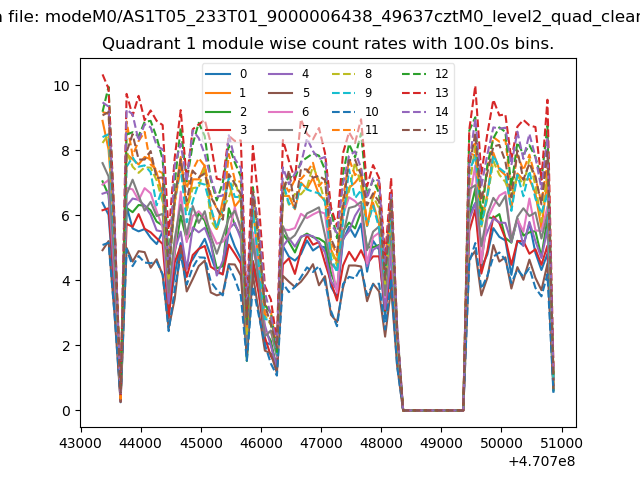
| Module-wise count rates for Quadrant A Data is divided into 100 sec bins |
 |
 |
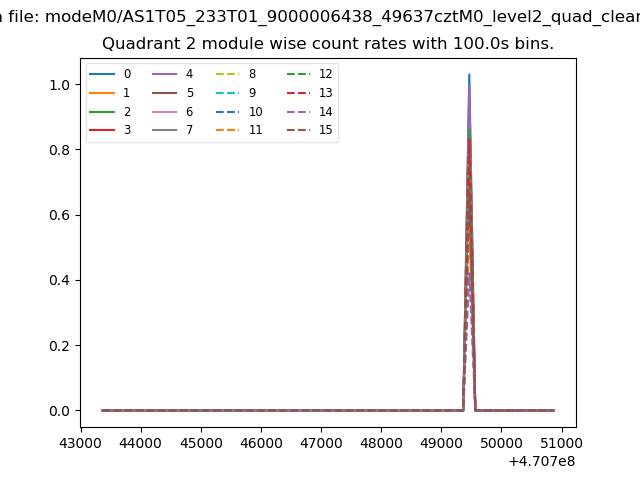
| Module-wise count rates for Quadrant B Data is divided into 100 sec bins |
 |
 |
| Module-wise count rates for Quadrant C Data is divided into 100 sec bins |
 |
 |
| Module-wise count rates for Quadrant D Data is divided into 100 sec bins |
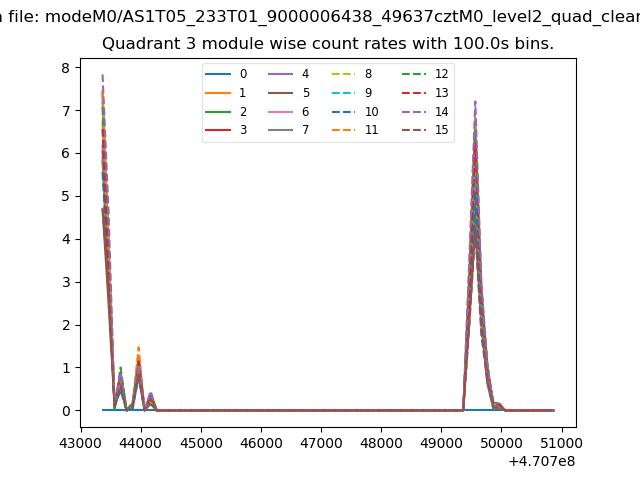 |
 |
| Parameter | Plot |
|---|---|
| CZT HV Monitor | 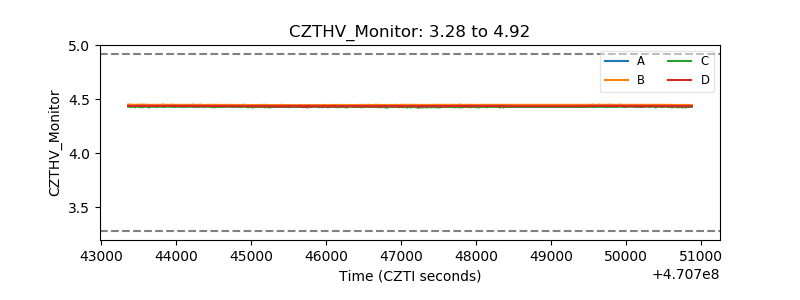 |
| D_VDD | 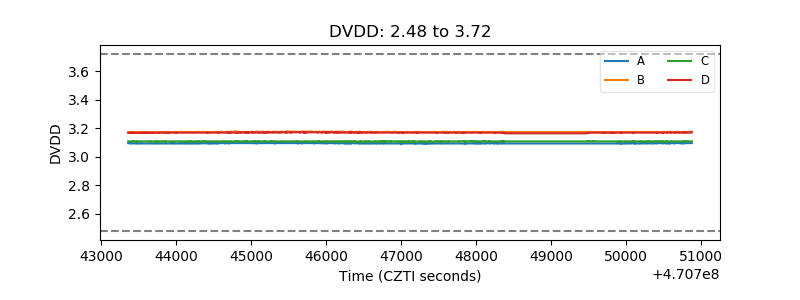 |
| Temperature 1 | 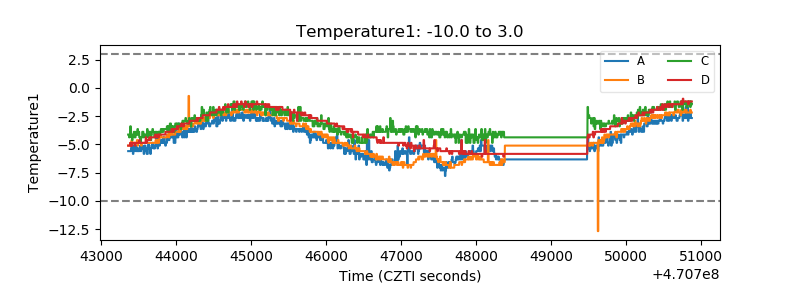 |
| Veto HV Monitor | 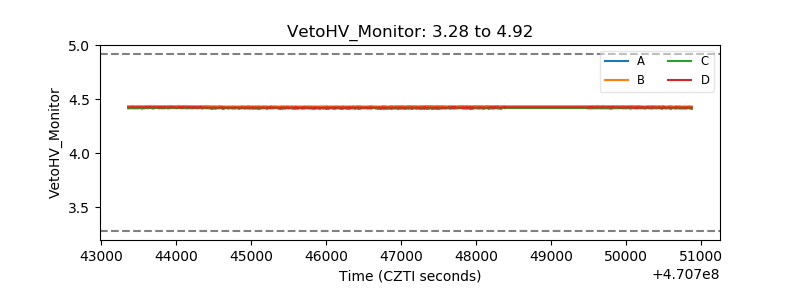 |
| Veto LLD | 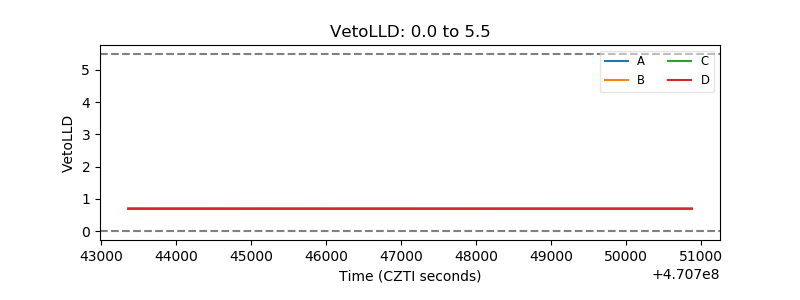 |
| Alpha Counter | 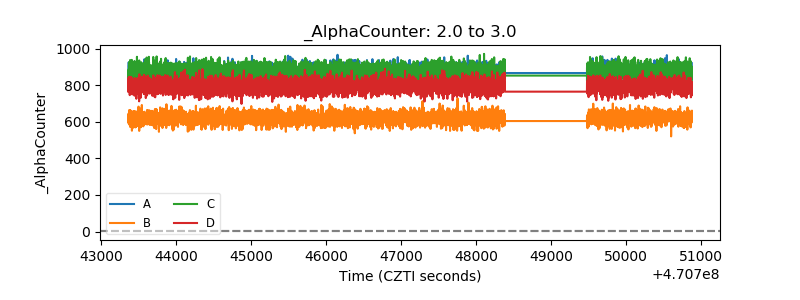 |
| _CPM_Rate | 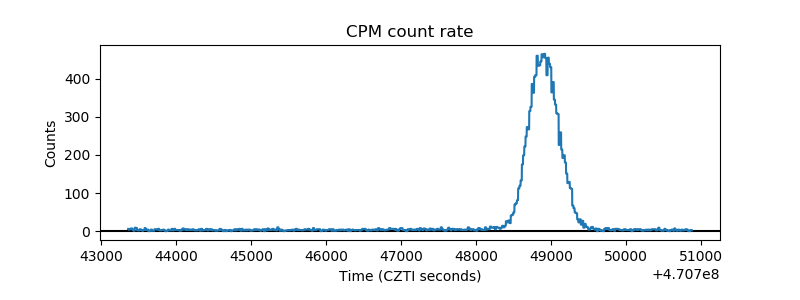 |
| CZT Counter | 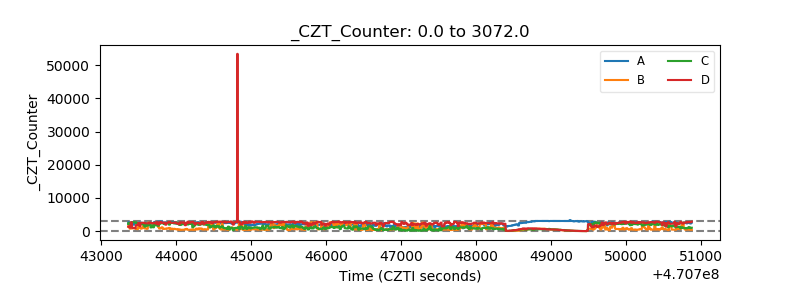 |
| +2.5 Volts monitor | 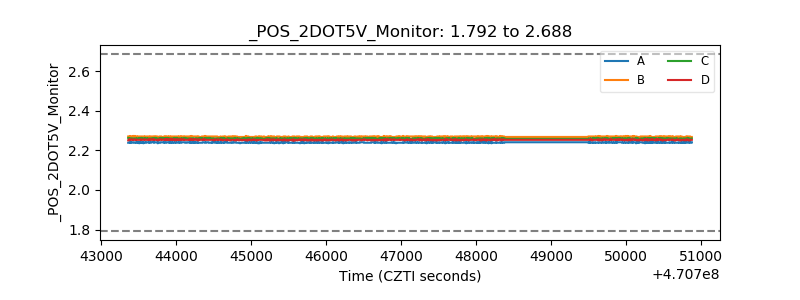 |
| +5 Volts monitor | 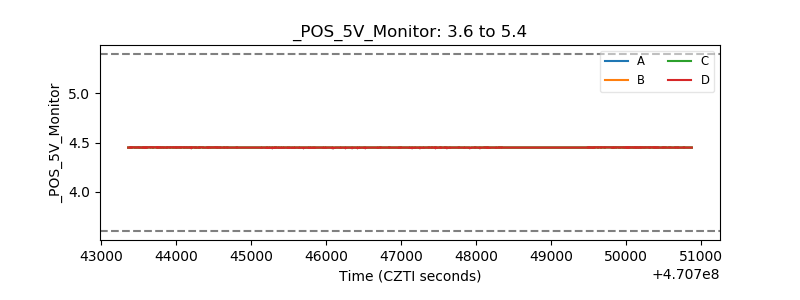 |
| _ROLL_ROT | 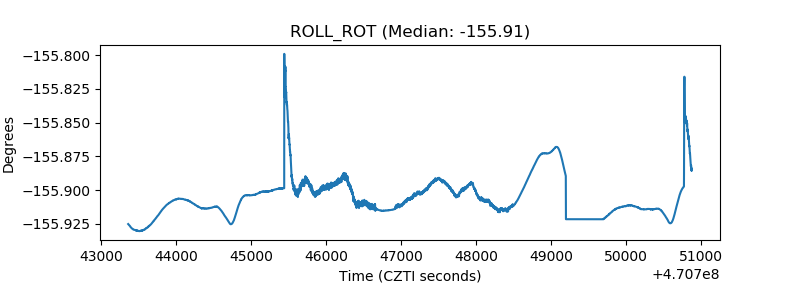 |
| _Roll_DEC | 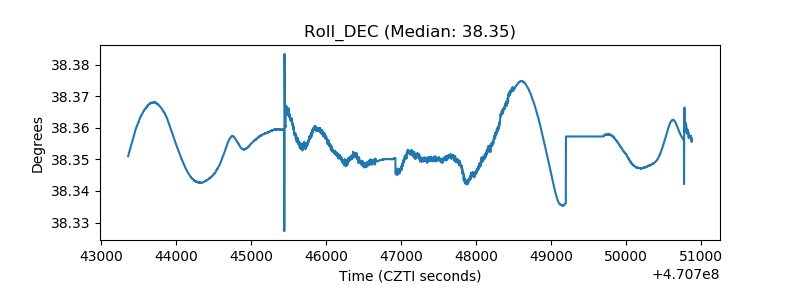 |
| _Roll_RA | 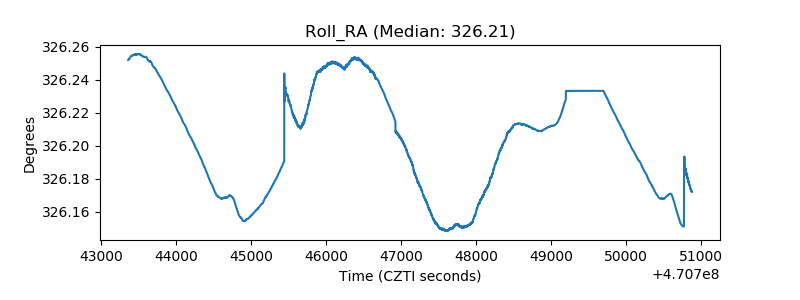 |
| Veto Counter | 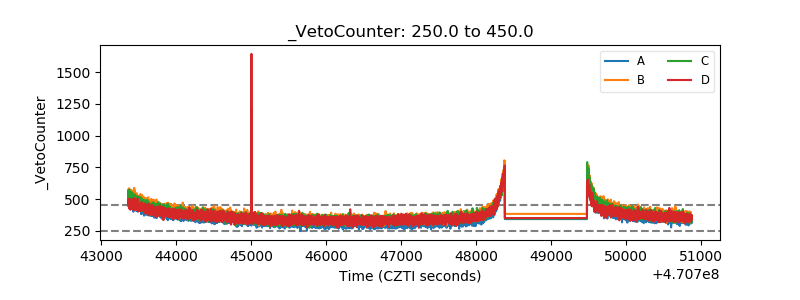 |