| Param | Original file | Final file |
|---|---|---|
| Filename | modeM0/AS1T05_233T01_9000006438_49638cztM0_level2.fits | modeM0/AS1T05_233T01_9000006438_49638cztM0_level2_quad_clean.evt |
| Size (bytes) | 1,220,189,760 | 47,980,800 |
| Size | 1.1 GB | 45.8 MB |
| Events in quadrant A | 14,249,533 | 149,393 |
| Events in quadrant B | 5,770,543 | 654,636 |
| Events in quadrant C | 8,668,458 | 29,909 |
| Events in quadrant D | 15,976,506 | 157,097 |
| Mode M9 | |||
|---|---|---|---|
| Quadrant | BADHDUFLAG | Total packets | Discarded packets |
| A | 0 | 10 | 0 |
| B | 0 | 10 | 0 |
| C | 0 | 10 | 0 |
| D | 0 | 10 | 0 |
| Mode SS | |||
|---|---|---|---|
| Quadrant | BADHDUFLAG | Total packets | Discarded packets |
| A | 0 | 132 | 0 |
| B | 0 | 132 | 0 |
| C | 0 | 132 | 0 |
| D | 0 | 132 | 0 |
| Mode M0 | |||
|---|---|---|---|
| Quadrant | BADHDUFLAG | Total packets | Discarded packets |
| A | 0 | 46808 | 0 |
| B | 0 | 21489 | 0 |
| C | 0 | 30337 | 0 |
| D | 0 | 51919 | 0 |
| Quadrant | Total seconds | Saturated seconds | Saturation percentage |
|---|---|---|---|
| A | 6481 | 6480 | 99.984570% |
| B | 6481 | 861 | 13.284987% |
| C | 6481 | 6481 | 100.000000% |
| D | 6481 | 6277 | 96.852338% |
Noise dominated data is calculated using 1-second bins in cleaned event files. If a bin has >2000 counts, and if more than 50% of those come from <1% of pixels, then it is considered to be noise-dominated and hence unusable.
| Quadrant | # 1 sec bins | Bins with >0 counts | Bins with >2000 counts | High rate bins dominated by noise | Noise dominated (total time) | Noise dominated (detector-on time) | Marked lightcurve |
|---|---|---|---|---|---|---|---|
| A | 7465 | 6480 | 4151 | 4151 | 55.61% | 64.06% | 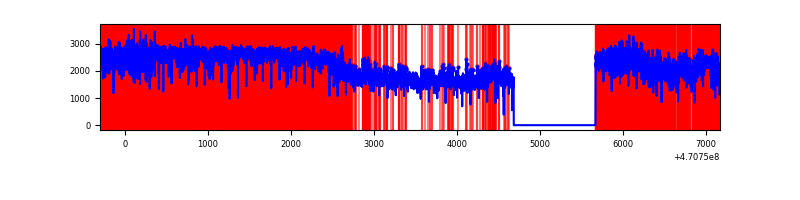 |
| B | 7466 | 6481 | 666 | 666 | 8.92% | 10.28% | 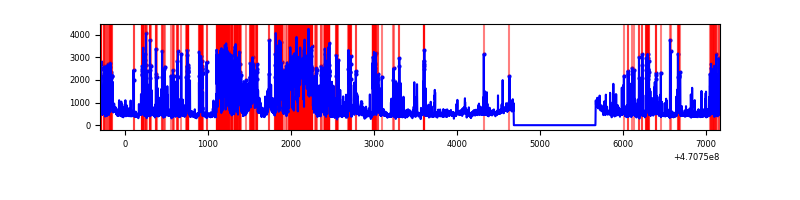 |
| C | 7465 | 6480 | 1233 | 1233 | 16.52% | 19.03% | 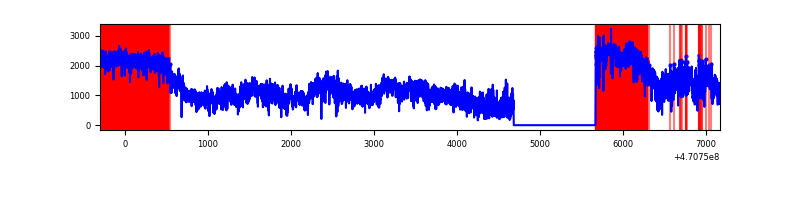 |
| D | 7465 | 6480 | 5924 | 5924 | 79.36% | 91.42% | 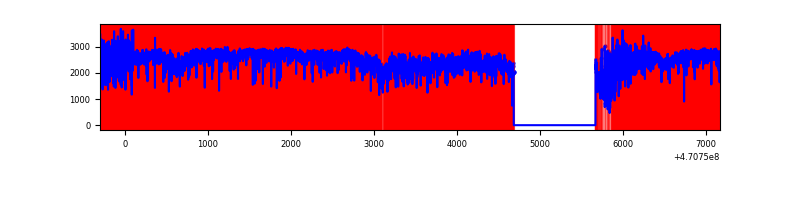 |
Top three noisy pixels from each quadrant. If the there are fewer than three noisy pixels in the level2.evt file, extra rows are filled as -1
| Pixel properties | Quadrant properties | ||||||
|---|---|---|---|---|---|---|---|
| Quadrant | DetID | PixID | Counts | Sigma | Mean | Median | Sigma |
| A | 0 | 99 | 5837862 | 89328.68 | 183 | 174 | 65.4 |
| A | 10 | 83 | 2776618 | 42485.32 | 183 | 174 | 65.4 |
| A | 3 | 130 | 1410297 | 21577.79 | 183 | 174 | 65.4 |
| B | 3 | 232 | 1359999 | 9504.16 | 669 | 649 | 143.0 |
| B | 4 | 206 | 877093 | 6127.83 | 669 | 649 | 143.0 |
| B | 4 | 170 | 246057 | 1715.82 | 669 | 649 | 143.0 |
| C | 15 | 180 | 2600818 | 99856.98 | 49 | 47 | 26.0 |
| C | 15 | 181 | 1568089 | 60205.2 | 49 | 47 | 26.0 |
| C | 15 | 163 | 885902 | 34012.53 | 49 | 47 | 26.0 |
| D | 15 | 40 | 4924744 | 55037.11 | 214 | 200 | 89.5 |
| D | 7 | 45 | 1804766 | 20167.98 | 214 | 200 | 89.5 |
| D | 7 | 61 | 1287640 | 14388.54 | 214 | 200 | 89.5 |
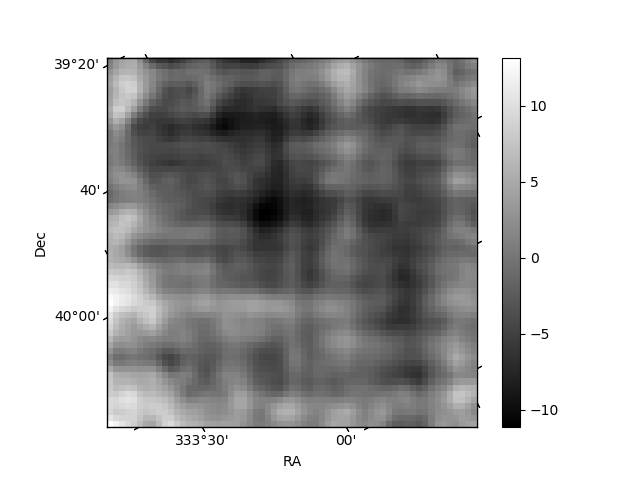
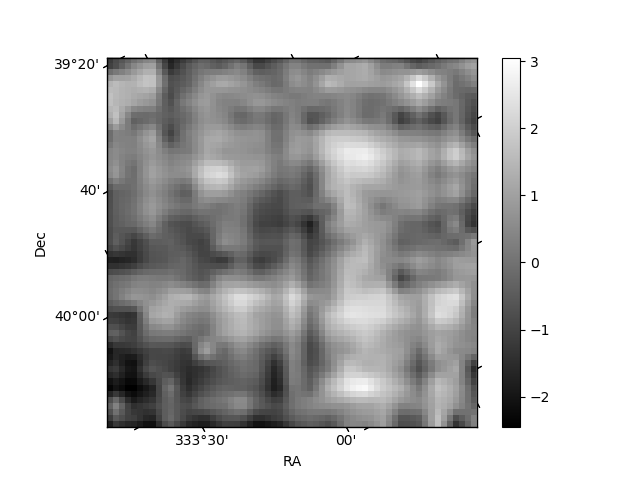
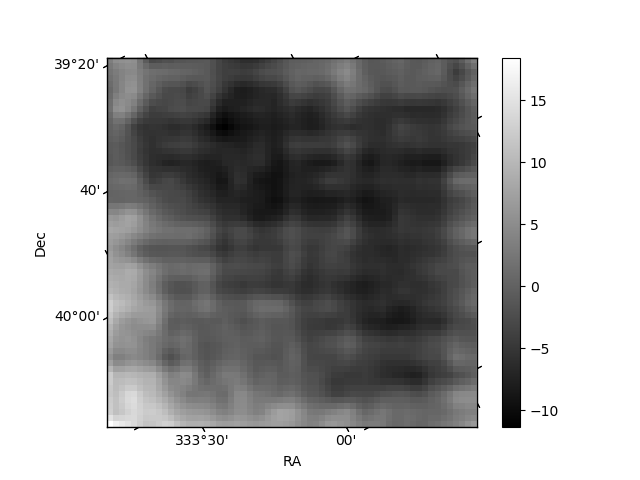
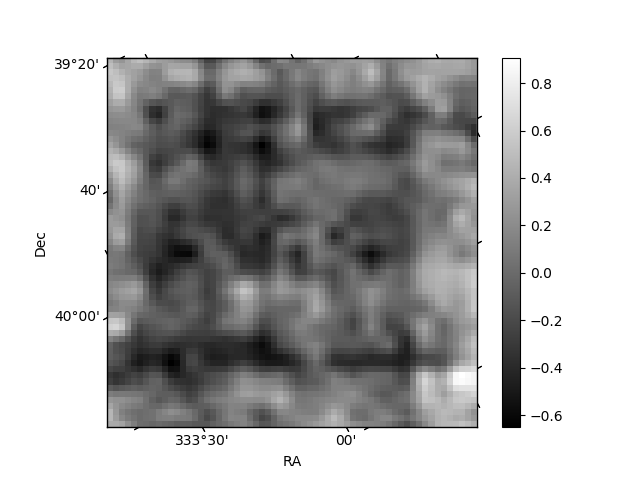
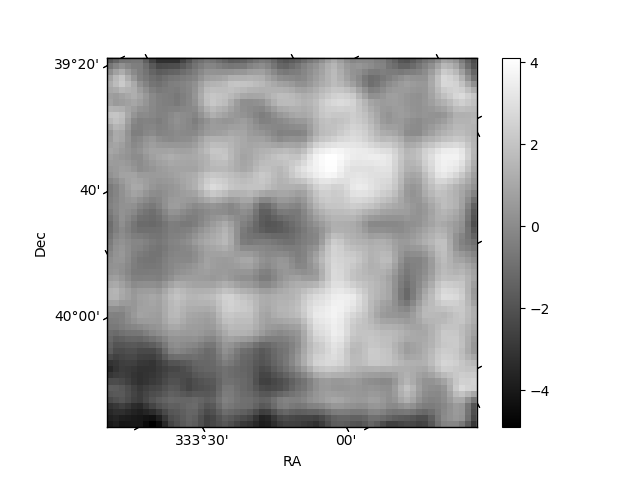
Histogram calculated using DETX and DETY for each event in the final _common_clean file
| Quadrant A | 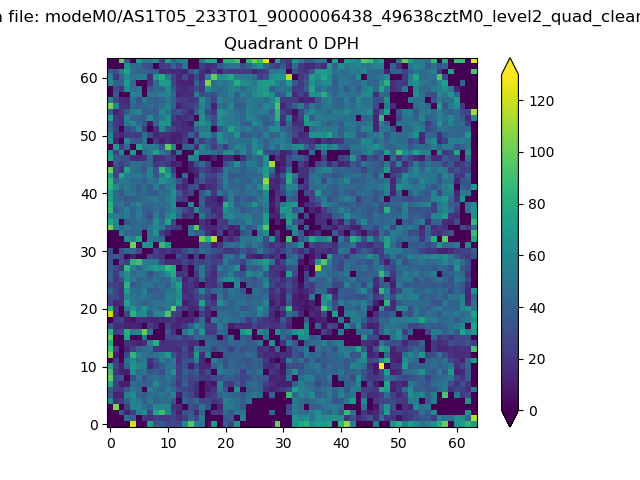 |
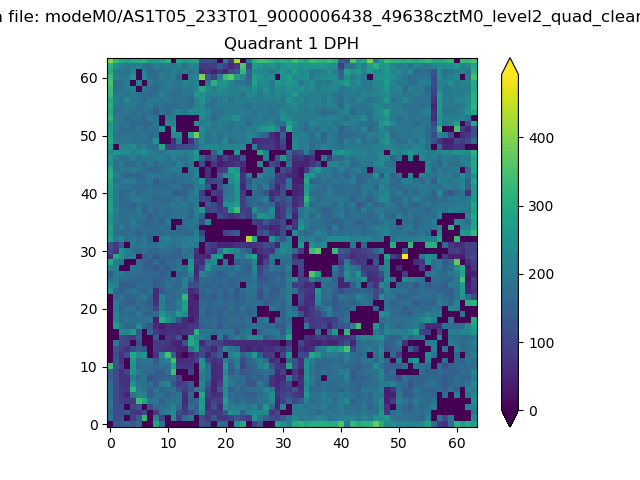 |
Quadrant B |
|---|---|---|---|
| Quadrant D | 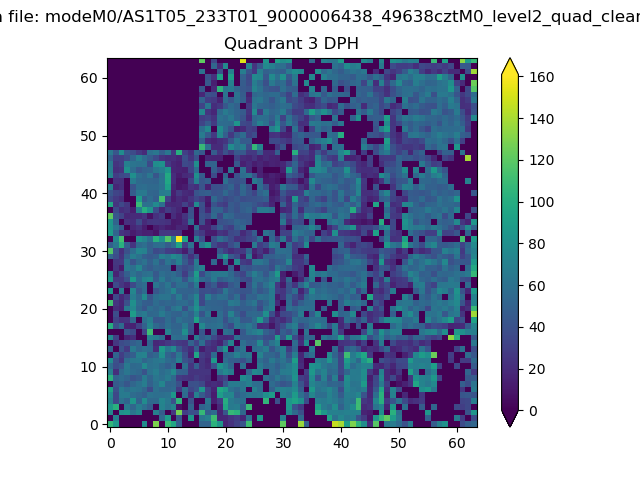 |
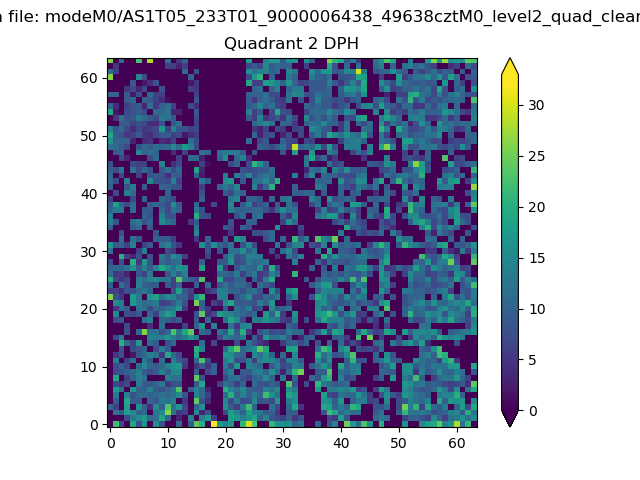 |
Quadrant C |
| Plot type | Count rate plots | Images |
|---|---|---|
| Comparison with Poisson distribution Blue bars denote a histogram of data divided into 1 sec bins. Red curve is a Poisson curve with rate = median count rate of data. |
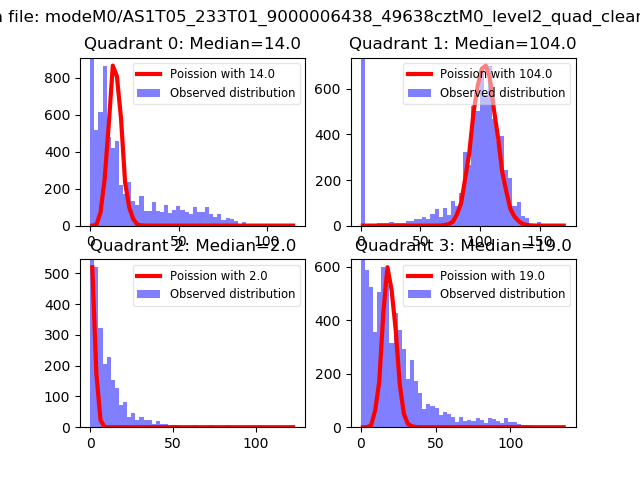 |
 |
| Quadrant-wise count rates Data is divided into 100 sec bins |
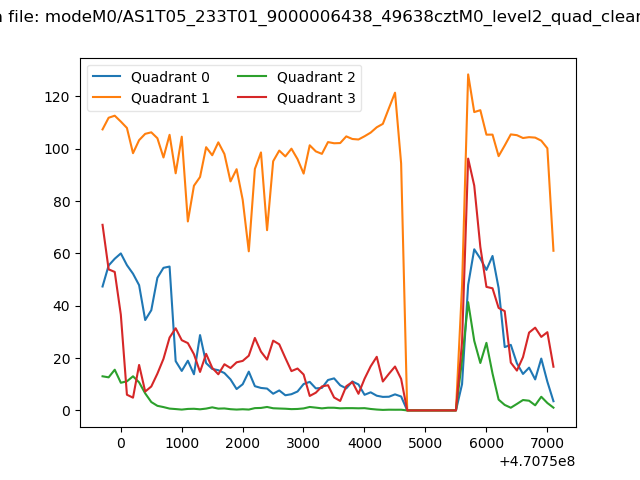 |
|
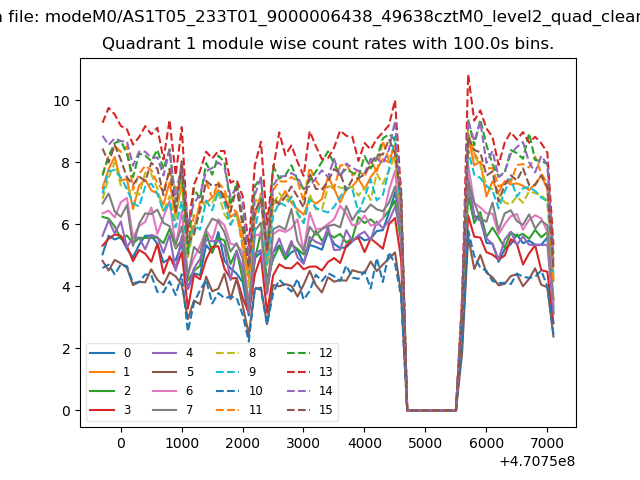
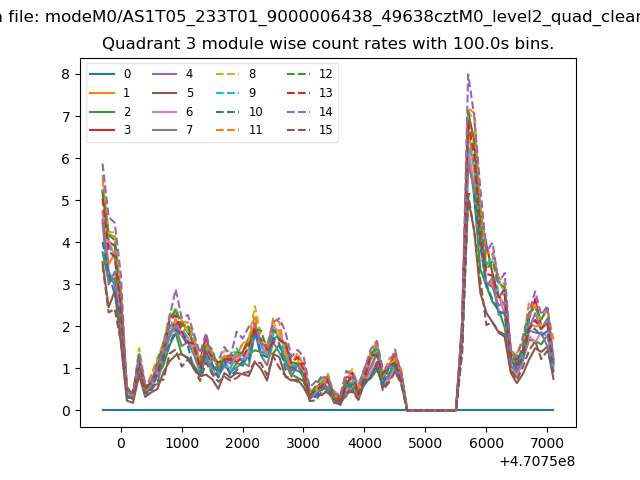
| Module-wise count rates for Quadrant A Data is divided into 100 sec bins |
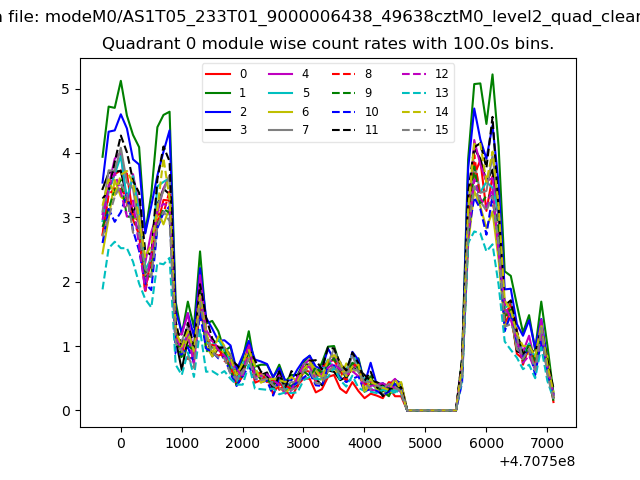 |
 |
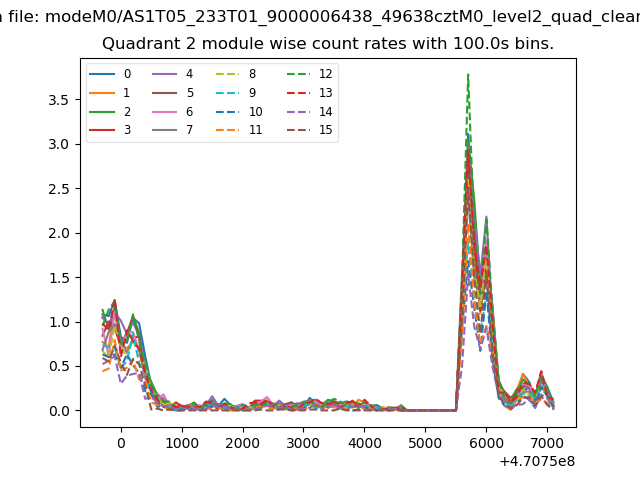
| Module-wise count rates for Quadrant B Data is divided into 100 sec bins |
 |
 |
| Module-wise count rates for Quadrant C Data is divided into 100 sec bins |
 |
 |
| Module-wise count rates for Quadrant D Data is divided into 100 sec bins |
 |
 |
| Parameter | Plot |
|---|---|
| CZT HV Monitor | 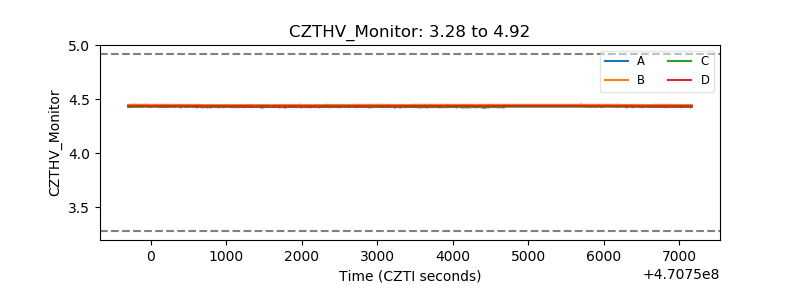 |
| D_VDD | 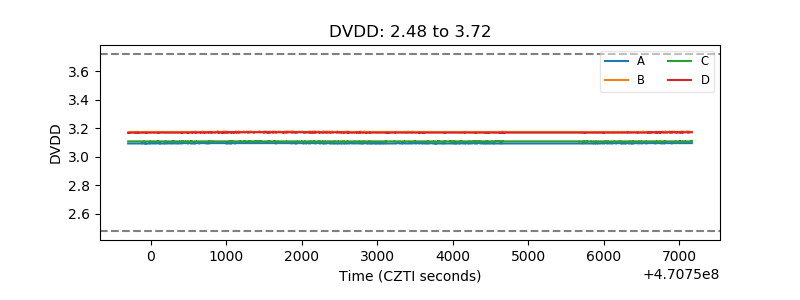 |
| Temperature 1 | 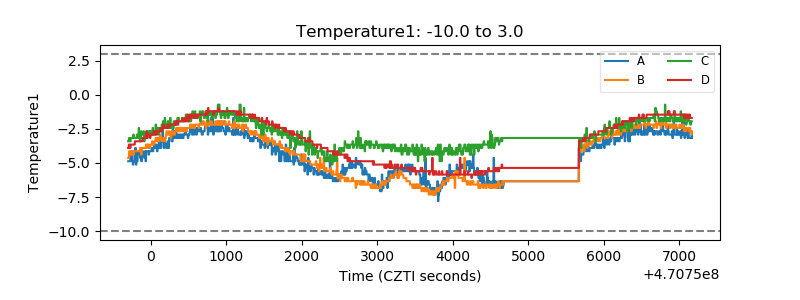 |
| Veto HV Monitor | 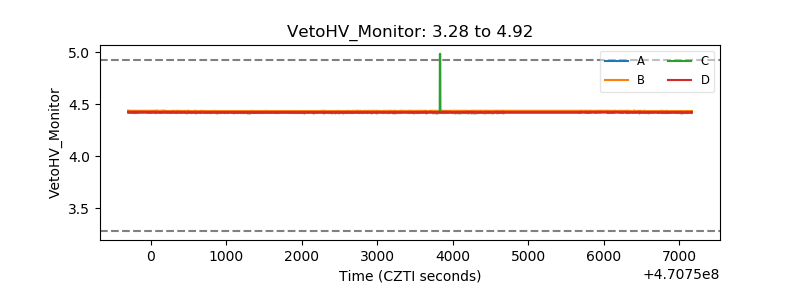 |
| Veto LLD | 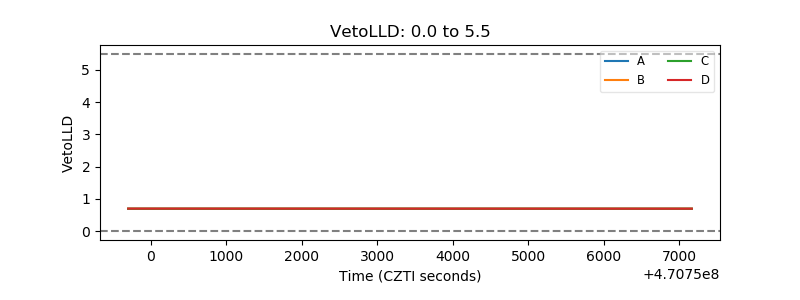 |
| Alpha Counter | 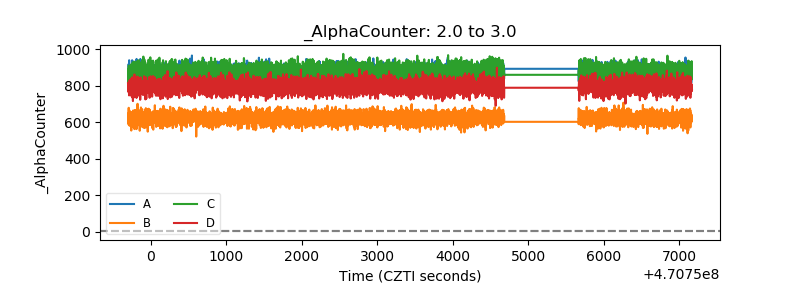 |
| _CPM_Rate | 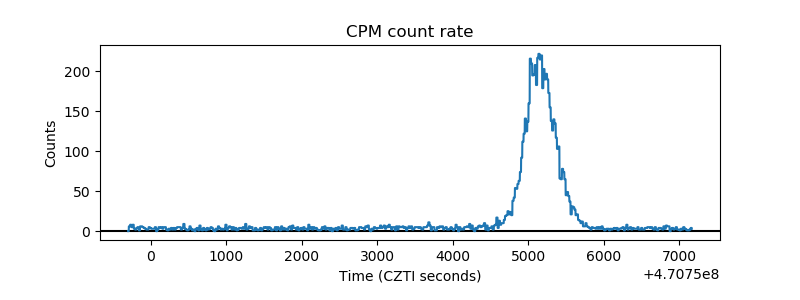 |
| CZT Counter | 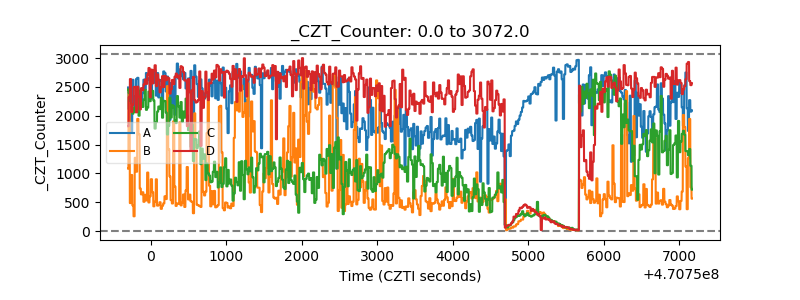 |
| +2.5 Volts monitor | 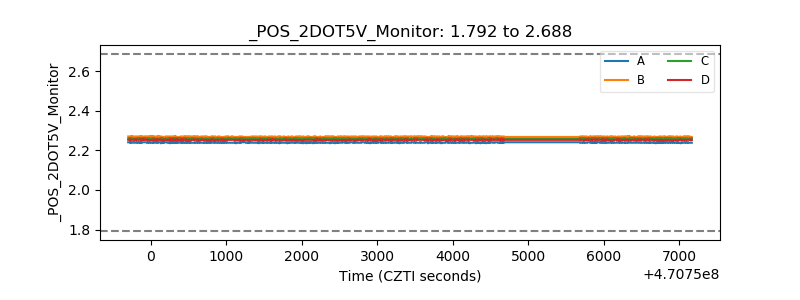 |
| +5 Volts monitor | 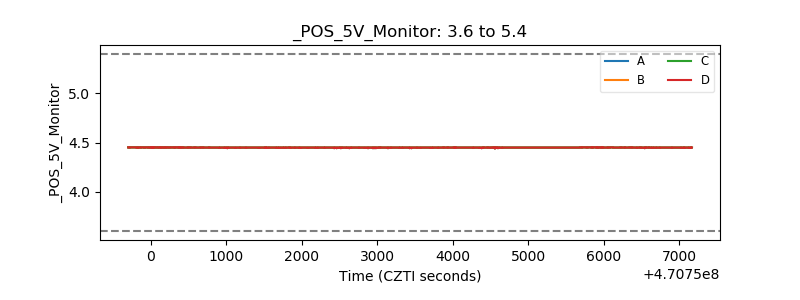 |
| _ROLL_ROT | 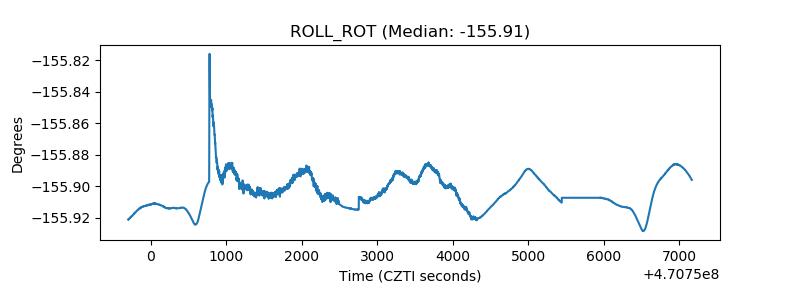 |
| _Roll_DEC | 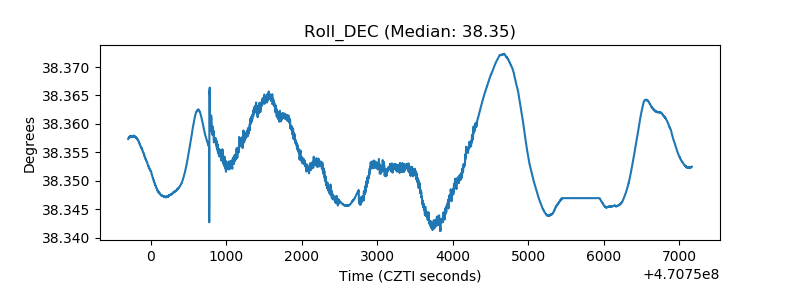 |
| _Roll_RA | 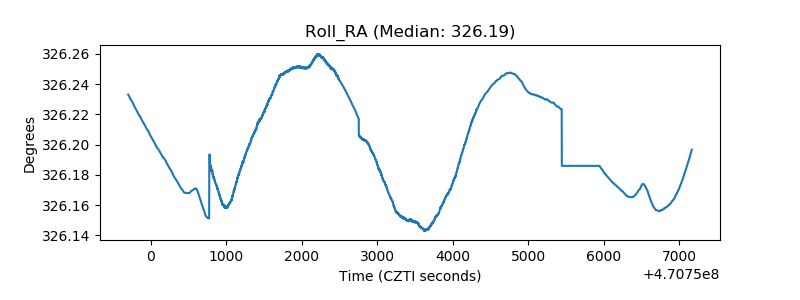 |
| Veto Counter | 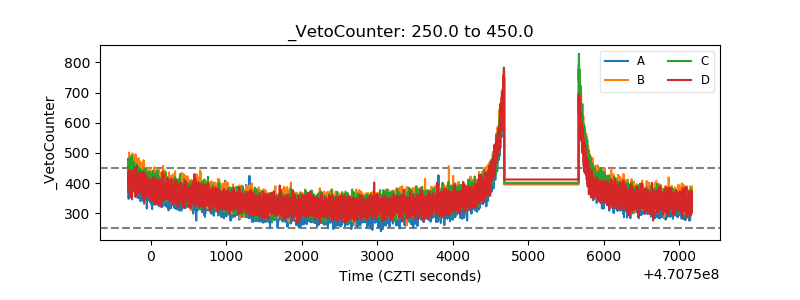 |