| Param | Original file | Final file |
|---|---|---|
| Filename | modeM0/AS1T05_233T01_9000006438_49639cztM0_level2.fits | modeM0/AS1T05_233T01_9000006438_49639cztM0_level2_quad_clean.evt |
| Size (bytes) | 1,276,528,320 | 37,932,480 |
| Size | 1.2 GB | 36.2 MB |
| Events in quadrant A | 15,802,176 | 160 |
| Events in quadrant B | 5,872,438 | 644,575 |
| Events in quadrant C | 8,130,231 | 778 |
| Events in quadrant D | 16,910,503 | 20,228 |
| Mode M9 | |||
|---|---|---|---|
| Quadrant | BADHDUFLAG | Total packets | Discarded packets |
| A | 0 | 8 | 0 |
| B | 0 | 8 | 0 |
| C | 0 | 8 | 0 |
| D | 0 | 8 | 0 |
| Mode SS | |||
|---|---|---|---|
| Quadrant | BADHDUFLAG | Total packets | Discarded packets |
| A | 0 | 140 | 0 |
| B | 0 | 140 | 0 |
| C | 0 | 140 | 0 |
| D | 0 | 140 | 0 |
| Mode M0 | |||
|---|---|---|---|
| Quadrant | BADHDUFLAG | Total packets | Discarded packets |
| A | 0 | 51683 | 1 |
| B | 0 | 22224 | 1 |
| C | 0 | 28917 | 1 |
| D | 0 | 54973 | 4 |
| Quadrant | Total seconds | Saturated seconds | Saturation percentage |
|---|---|---|---|
| A | 6928 | 6927 | 99.985566% |
| B | 6928 | 817 | 11.792725% |
| C | 6929 | 6925 | 99.942272% |
| D | 6928 | 6750 | 97.430716% |
Noise dominated data is calculated using 1-second bins in cleaned event files. If a bin has >2000 counts, and if more than 50% of those come from <1% of pixels, then it is considered to be noise-dominated and hence unusable.
| Quadrant | # 1 sec bins | Bins with >0 counts | Bins with >2000 counts | High rate bins dominated by noise | Noise dominated (total time) | Noise dominated (detector-on time) | Marked lightcurve |
|---|---|---|---|---|---|---|---|
| A | 7682 | 6927 | 5145 | 5145 | 66.97% | 74.27% | 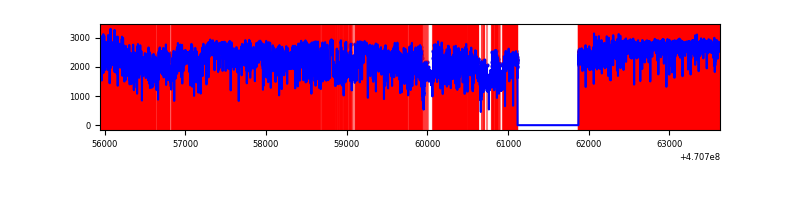 |
| B | 7683 | 6928 | 602 | 602 | 7.84% | 8.69% | 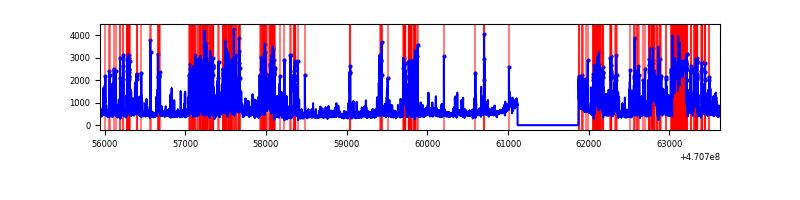 |
| C | 7683 | 6928 | 1057 | 1057 | 13.76% | 15.26% | 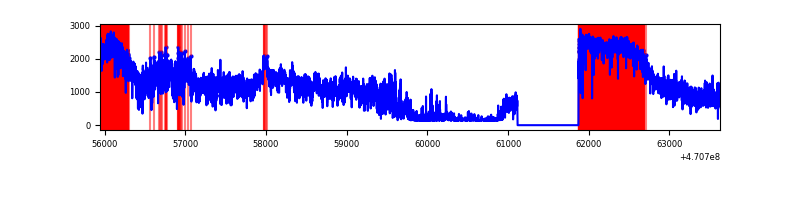 |
| D | 7682 | 6927 | 6352 | 6352 | 82.69% | 91.70% | 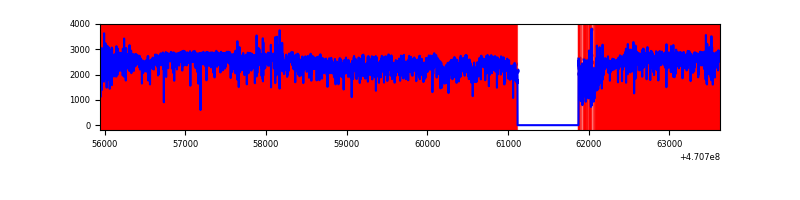 |
Top three noisy pixels from each quadrant. If the there are fewer than three noisy pixels in the level2.evt file, extra rows are filled as -1
| Pixel properties | Quadrant properties | ||||||
|---|---|---|---|---|---|---|---|
| Quadrant | DetID | PixID | Counts | Sigma | Mean | Median | Sigma |
| A | 0 | 99 | 5461244 | 83197.92 | 188 | 179 | 65.6 |
| A | 10 | 83 | 2985696 | 45483.58 | 188 | 179 | 65.6 |
| A | 3 | 130 | 2518500 | 38365.97 | 188 | 179 | 65.6 |
| B | 4 | 206 | 1285940 | 8566.76 | 702 | 682 | 150.0 |
| B | 3 | 232 | 776758 | 5172.86 | 702 | 682 | 150.0 |
| B | 5 | 173 | 260464 | 1731.55 | 702 | 682 | 150.0 |
| C | 15 | 180 | 2232790 | 81026.7 | 45 | 42 | 27.6 |
| C | 15 | 181 | 1613226 | 58542.65 | 45 | 42 | 27.6 |
| C | 15 | 163 | 912511 | 33113.61 | 45 | 42 | 27.6 |
| D | 15 | 40 | 4866826 | 43473.37 | 257 | 240 | 111.9 |
| D | 7 | 45 | 3169364 | 28309.89 | 257 | 240 | 111.9 |
| D | 7 | 61 | 1432487 | 12794.31 | 257 | 240 | 111.9 |
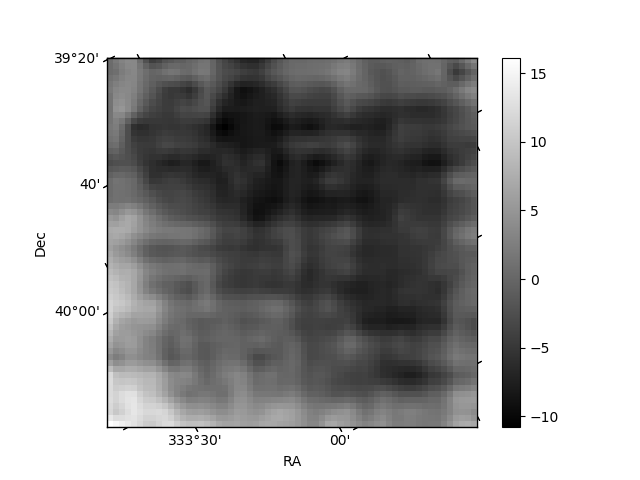
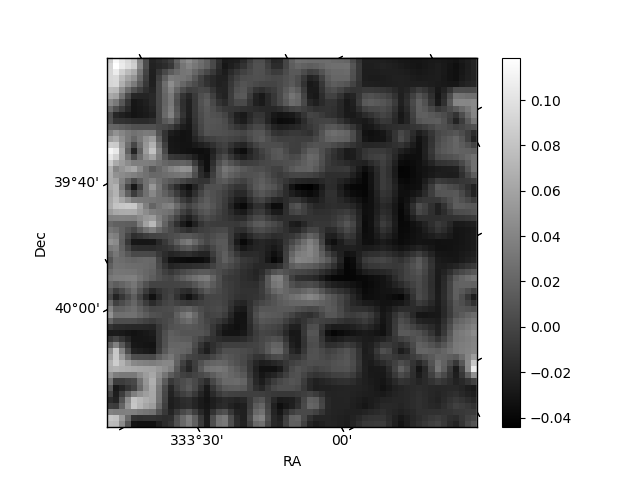
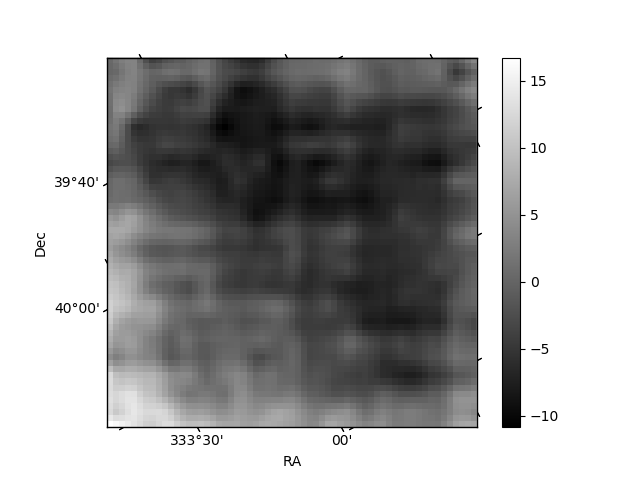
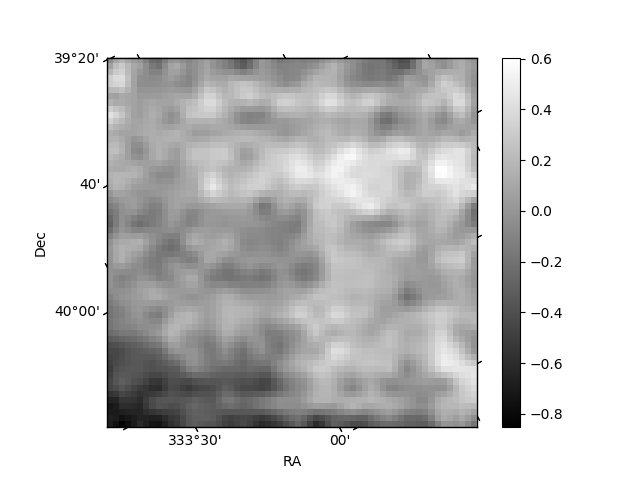
Histogram calculated using DETX and DETY for each event in the final _common_clean file
| Quadrant A | 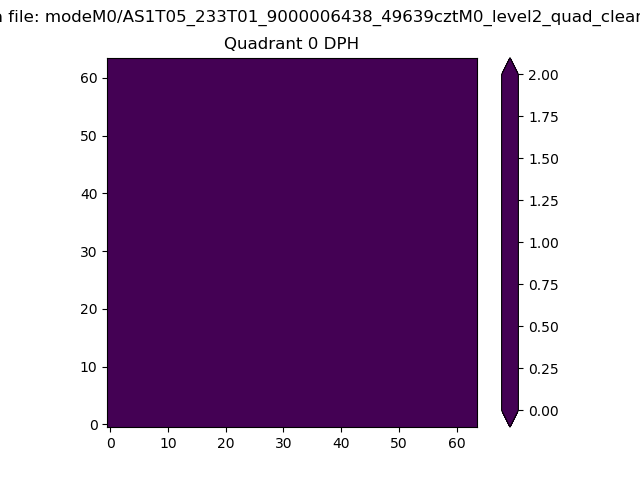 |
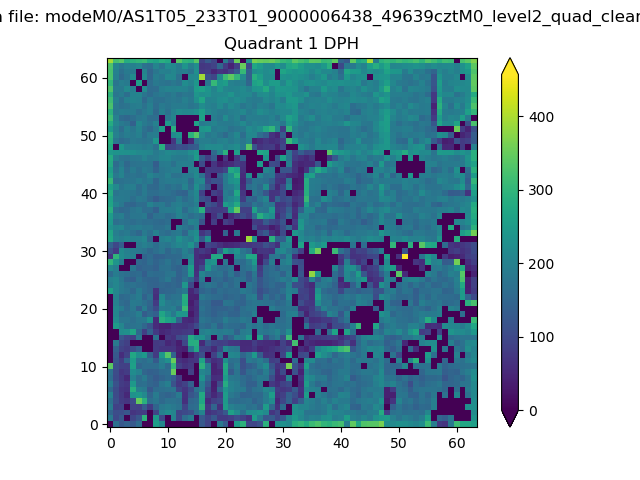 |
Quadrant B |
|---|---|---|---|
| Quadrant D | 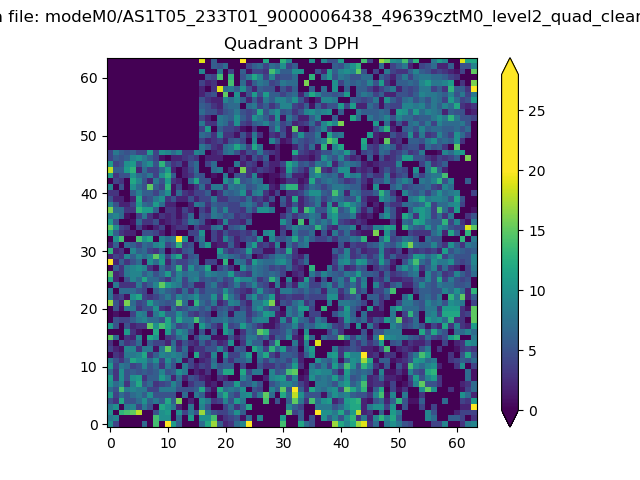 |
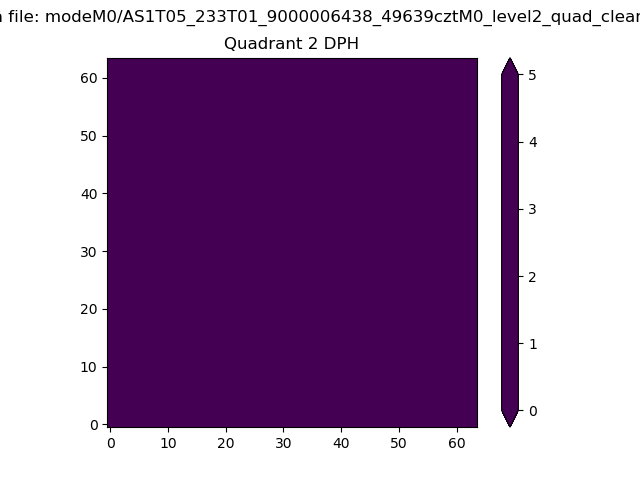 |
Quadrant C |
| Plot type | Count rate plots | Images |
|---|---|---|
| Comparison with Poisson distribution Blue bars denote a histogram of data divided into 1 sec bins. Red curve is a Poisson curve with rate = median count rate of data. |
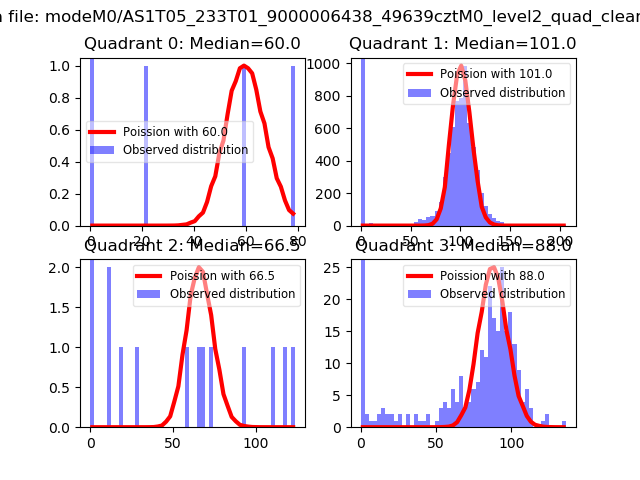 |
 |
| Quadrant-wise count rates Data is divided into 100 sec bins |
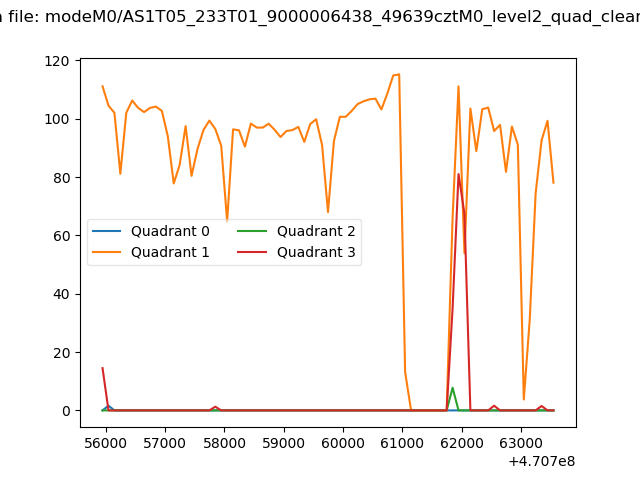 |
|
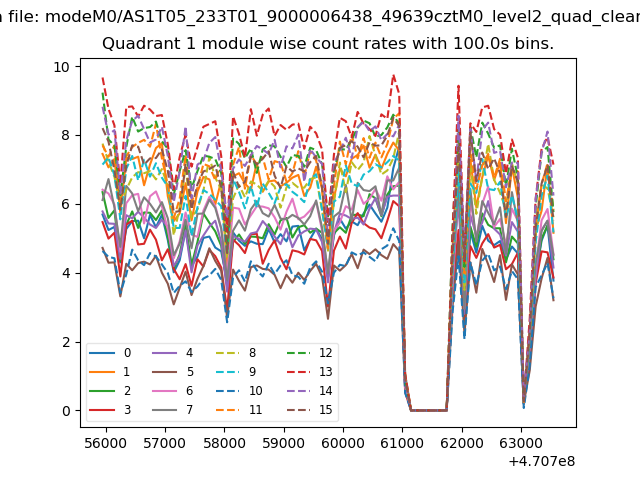
| Module-wise count rates for Quadrant A Data is divided into 100 sec bins |
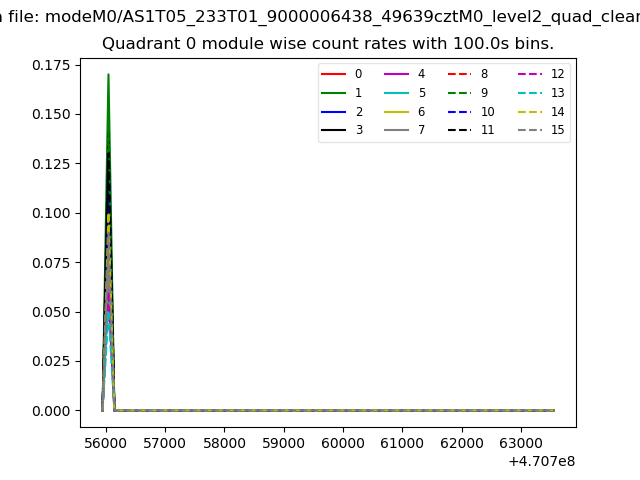 |
 |
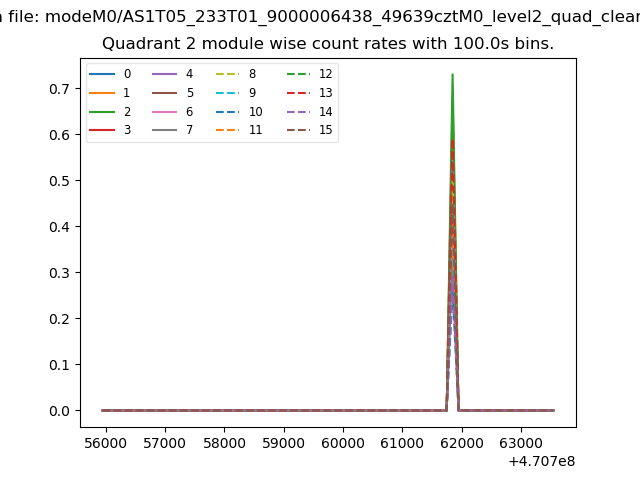
| Module-wise count rates for Quadrant B Data is divided into 100 sec bins |
 |
 |
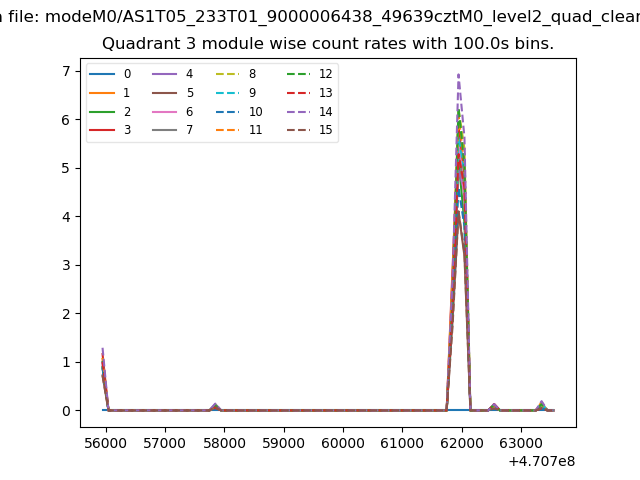
| Module-wise count rates for Quadrant C Data is divided into 100 sec bins |
 |
 |
| Module-wise count rates for Quadrant D Data is divided into 100 sec bins |
 |
 |
| Parameter | Plot |
|---|---|
| CZT HV Monitor | 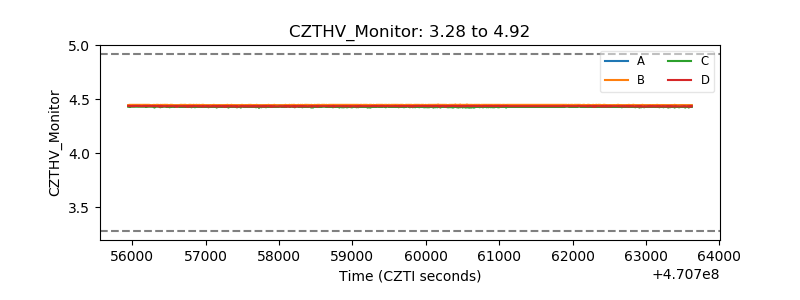 |
| D_VDD | 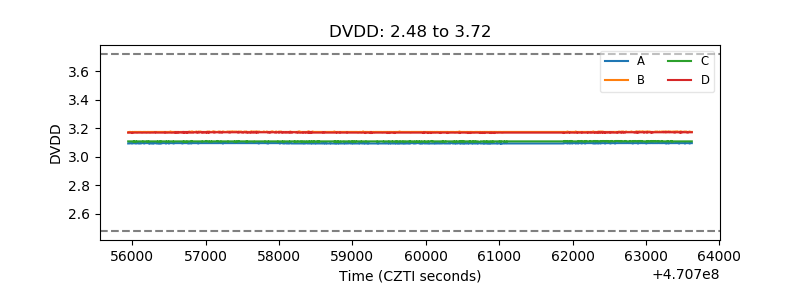 |
| Temperature 1 | 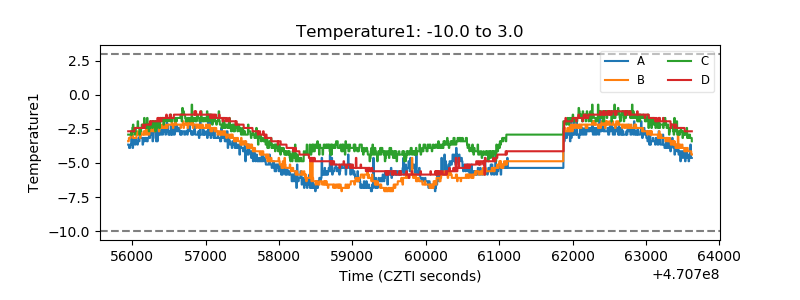 |
| Veto HV Monitor | 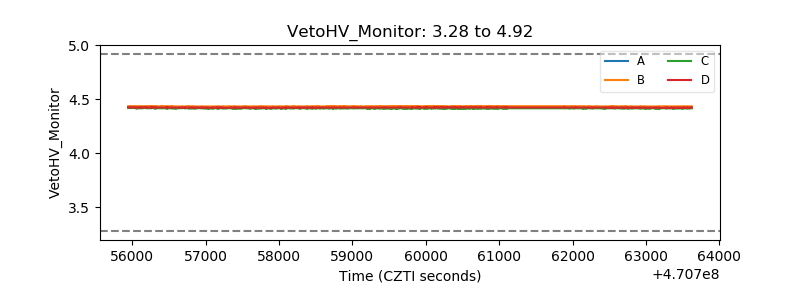 |
| Veto LLD | 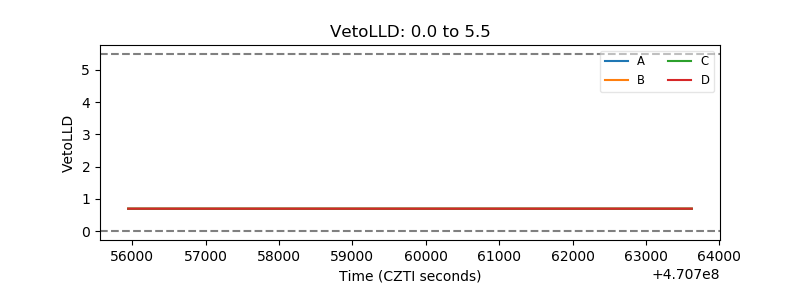 |
| Alpha Counter | 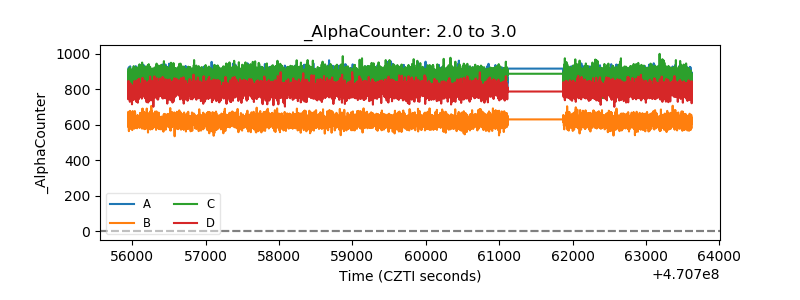 |
| _CPM_Rate | 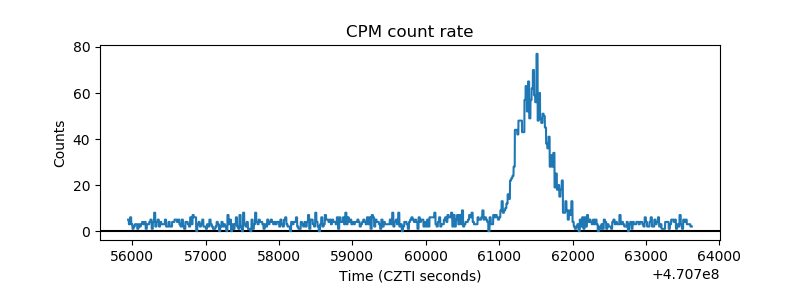 |
| CZT Counter | 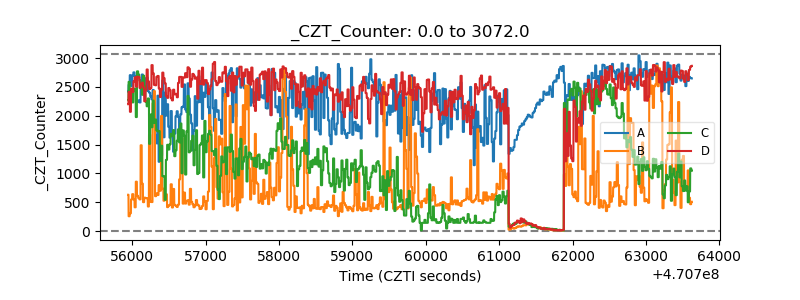 |
| +2.5 Volts monitor | 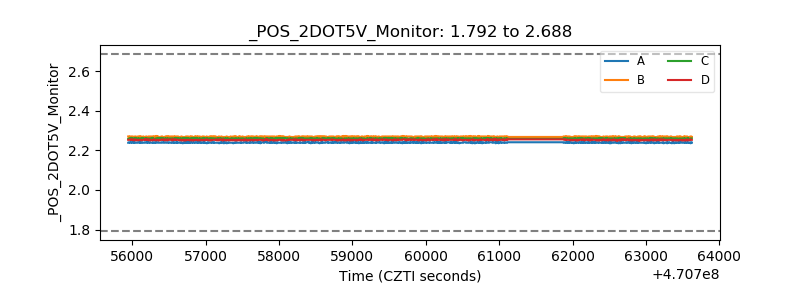 |
| +5 Volts monitor |  |
| _ROLL_ROT | 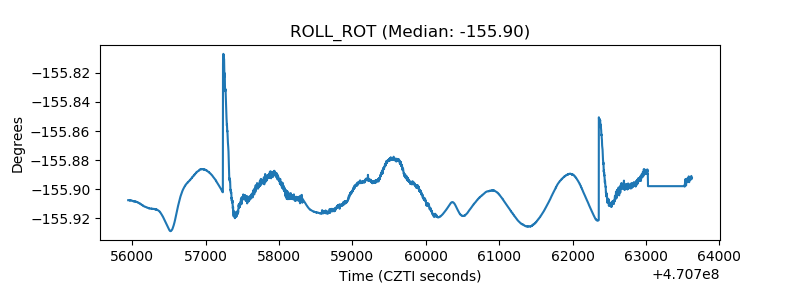 |
| _Roll_DEC | 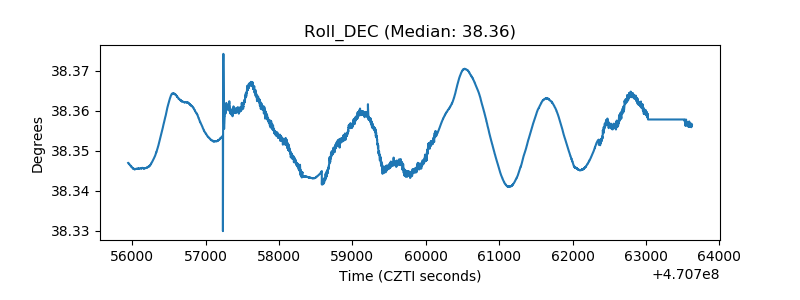 |
| _Roll_RA | 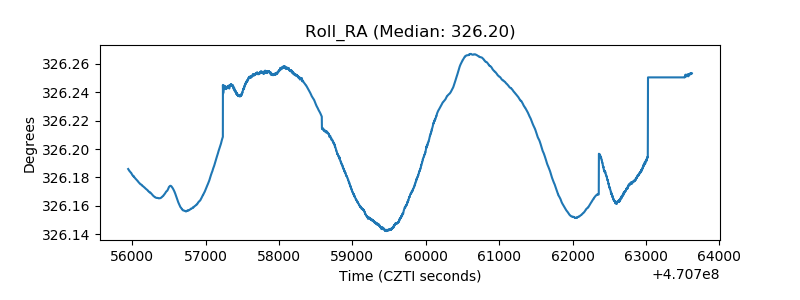 |
| Veto Counter | 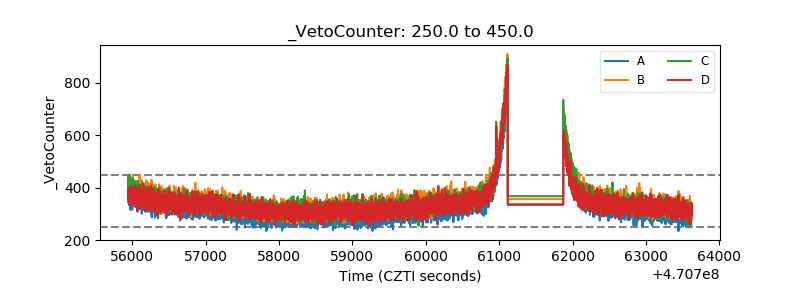 |