| Param | Original file | Final file |
|---|---|---|
| Filename | modeM0/AS1T05_233T01_9000006438_49640cztM0_level2.fits | modeM0/AS1T05_233T01_9000006438_49640cztM0_level2_quad_clean.evt |
| Size (bytes) | 5,213,217,600 | 146,361,600 |
| Size | 4.9 GB | 139.6 MB |
| Events in quadrant A | 62,513,451 | 1,569 |
| Events in quadrant B | 28,626,523 | 2,439,213 |
| Events in quadrant C | 32,160,172 | 3,363 |
| Events in quadrant D | 67,550,402 | 89,936 |
| Mode M9 | |||
|---|---|---|---|
| Quadrant | BADHDUFLAG | Total packets | Discarded packets |
| A | 0 | 43 | 0 |
| B | 0 | 43 | 0 |
| C | 0 | 43 | 0 |
| D | 0 | 43 | 0 |
| Mode SS | |||
|---|---|---|---|
| Quadrant | BADHDUFLAG | Total packets | Discarded packets |
| A | 0 | 562 | 0 |
| B | 0 | 562 | 0 |
| C | 0 | 562 | 0 |
| D | 0 | 562 | 0 |
| Mode M0 | |||
|---|---|---|---|
| Quadrant | BADHDUFLAG | Total packets | Discarded packets |
| A | 0 | 204560 | 5 |
| B | 0 | 103967 | 7 |
| C | 0 | 114823 | 5 |
| D | 0 | 219533 | 5 |
| Quadrant | Total seconds | Saturated seconds | Saturation percentage |
|---|---|---|---|
| A | 27566 | 27556 | 99.963723% |
| B | 27565 | 5173 | 18.766552% |
| C | 27565 | 27548 | 99.938328% |
| D | 27566 | 26794 | 97.199449% |
Noise dominated data is calculated using 1-second bins in cleaned event files. If a bin has >2000 counts, and if more than 50% of those come from <1% of pixels, then it is considered to be noise-dominated and hence unusable.
| Quadrant | # 1 sec bins | Bins with >0 counts | Bins with >2000 counts | High rate bins dominated by noise | Noise dominated (total time) | Noise dominated (detector-on time) | Marked lightcurve |
|---|---|---|---|---|---|---|---|
| A | 31870 | 27565 | 19902 | 19902 | 62.45% | 72.20% | 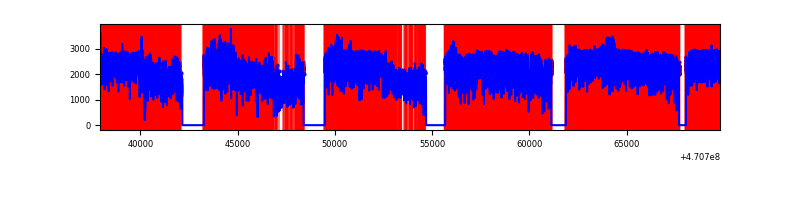 |
| B | 31870 | 27566 | 3883 | 3883 | 12.18% | 14.09% | 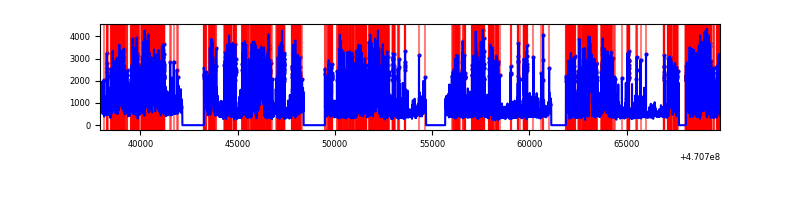 |
| C | 31869 | 27564 | 3357 | 3357 | 10.53% | 12.18% | 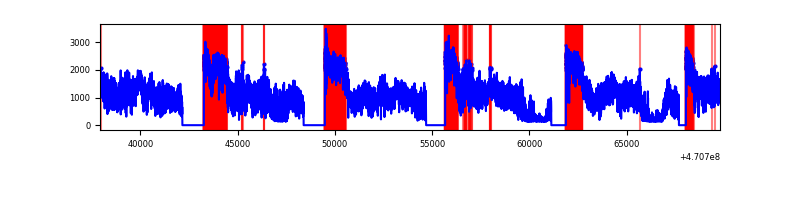 |
| D | 31870 | 27565 | 25086 | 25086 | 78.71% | 91.01% | 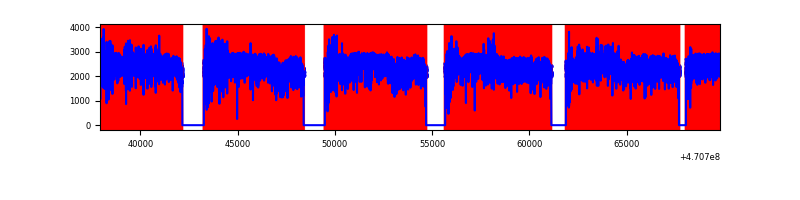 |
Top three noisy pixels from each quadrant. If the there are fewer than three noisy pixels in the level2.evt file, extra rows are filled as -1
| Pixel properties | Quadrant properties | ||||||
|---|---|---|---|---|---|---|---|
| Quadrant | DetID | PixID | Counts | Sigma | Mean | Median | Sigma |
| A | 0 | 99 | 24954508 | 88802.7 | 732 | 691 | 281.0 |
| A | 10 | 83 | 11073883 | 39405.97 | 732 | 691 | 281.0 |
| A | 3 | 130 | 5583115 | 19866.07 | 732 | 691 | 281.0 |
| B | 3 | 232 | 4059353 | 6982.14 | 2766 | 2685 | 581.0 |
| B | 4 | 170 | 4020876 | 6915.91 | 2766 | 2685 | 581.0 |
| B | 4 | 206 | 3822446 | 6574.39 | 2766 | 2685 | 581.0 |
| C | 15 | 180 | 9885551 | 72348.97 | 177 | 160 | 136.6 |
| C | 15 | 181 | 5301502 | 38799.34 | 177 | 160 | 136.6 |
| C | 15 | 163 | 3472426 | 25412.74 | 177 | 160 | 136.6 |
| D | 15 | 40 | 20638149 | 31067.88 | 1017 | 910 | 664.3 |
| D | 7 | 45 | 10601731 | 15958.77 | 1017 | 910 | 664.3 |
| D | 7 | 61 | 4784861 | 7201.89 | 1017 | 910 | 664.3 |
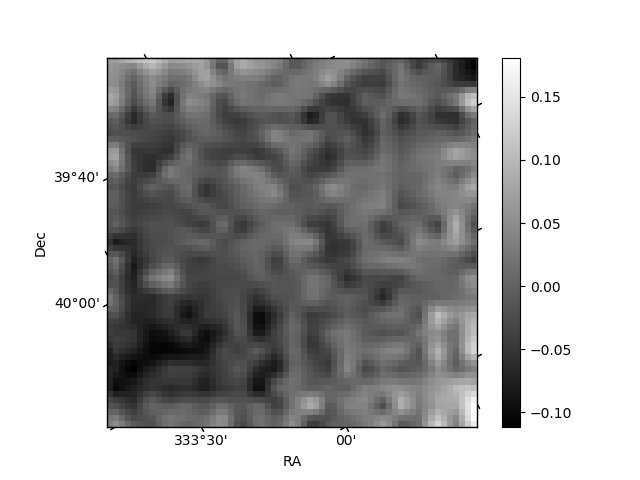
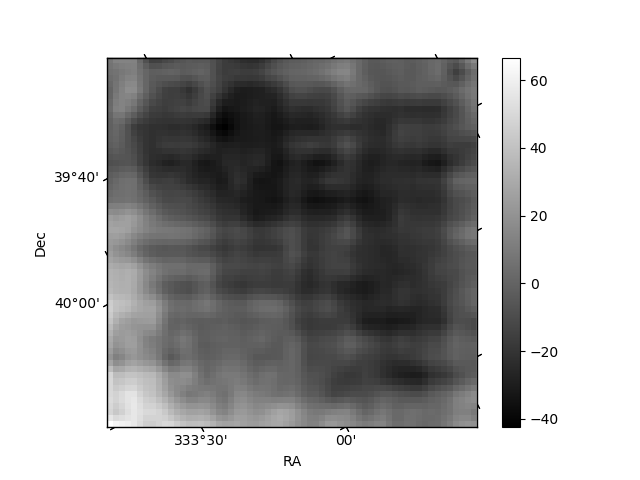
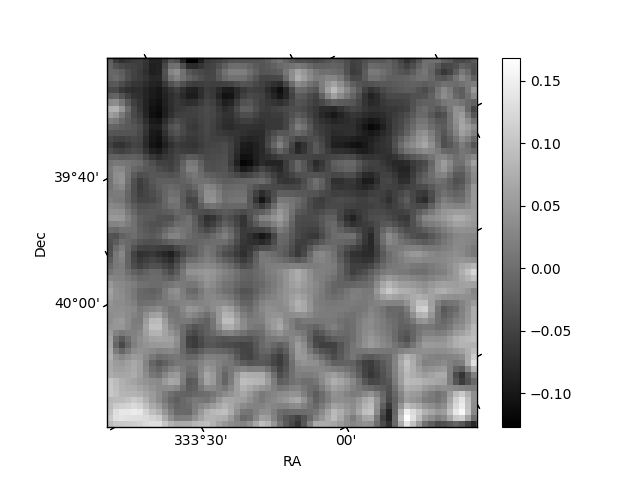
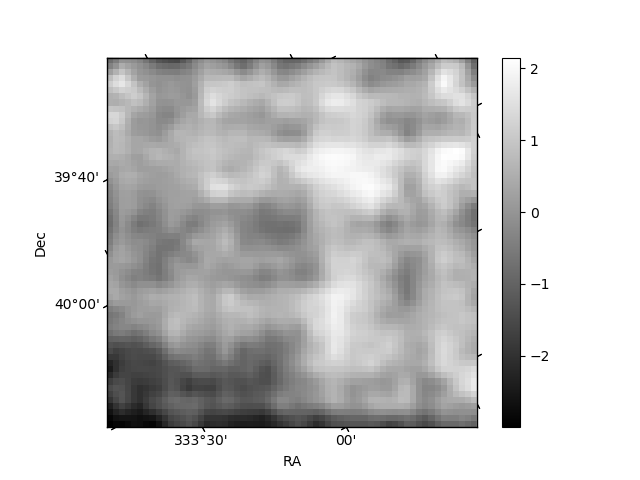
Histogram calculated using DETX and DETY for each event in the final _common_clean file
| Quadrant A | 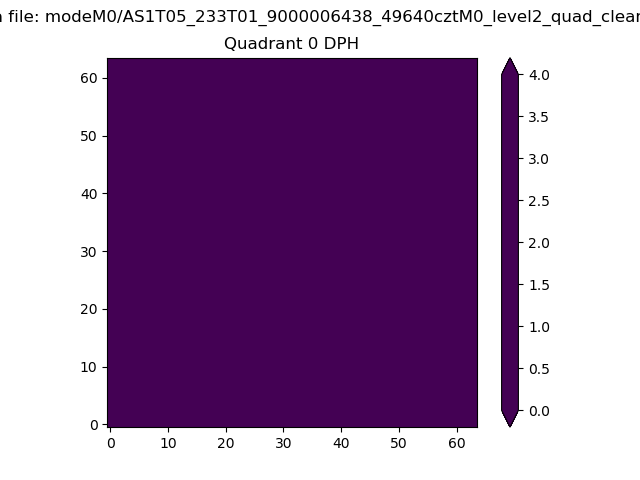 |
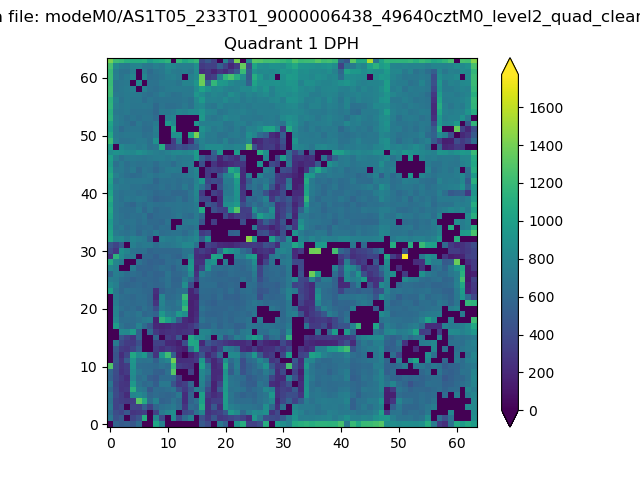 |
Quadrant B |
|---|---|---|---|
| Quadrant D | 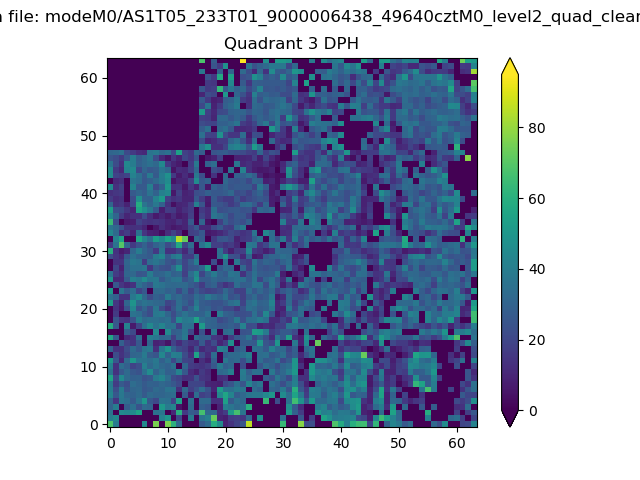 |
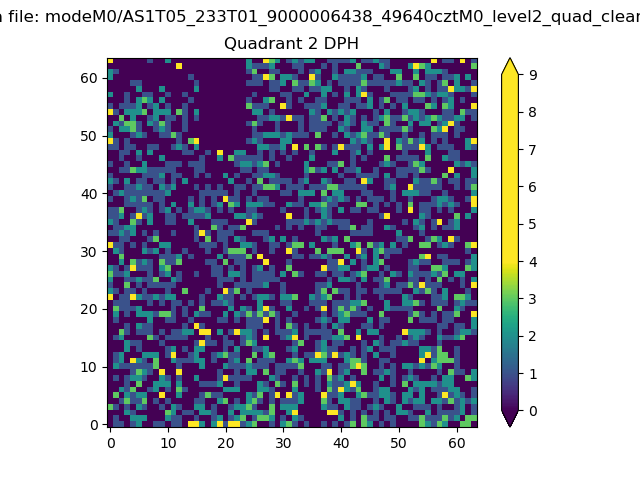 |
Quadrant C |
| Plot type | Count rate plots | Images |
|---|---|---|
| Comparison with Poisson distribution Blue bars denote a histogram of data divided into 1 sec bins. Red curve is a Poisson curve with rate = median count rate of data. |
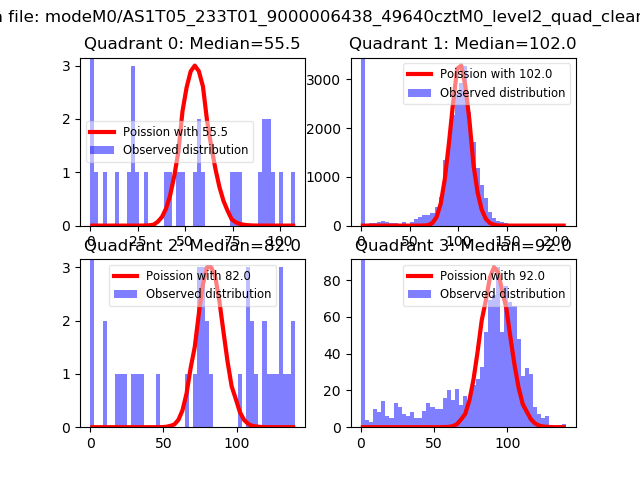 |
 |
| Quadrant-wise count rates Data is divided into 100 sec bins |
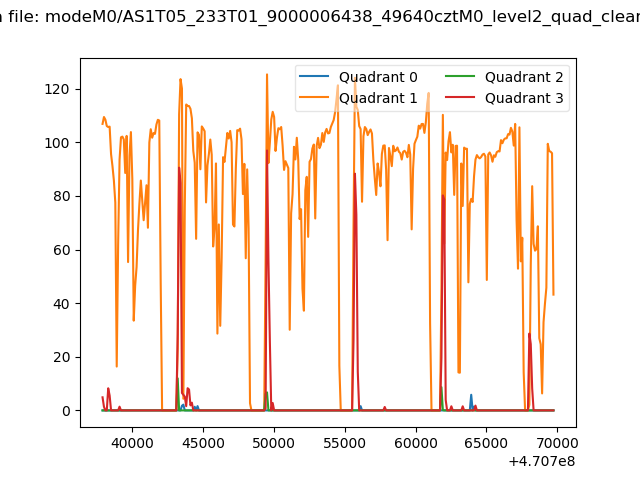 |
|
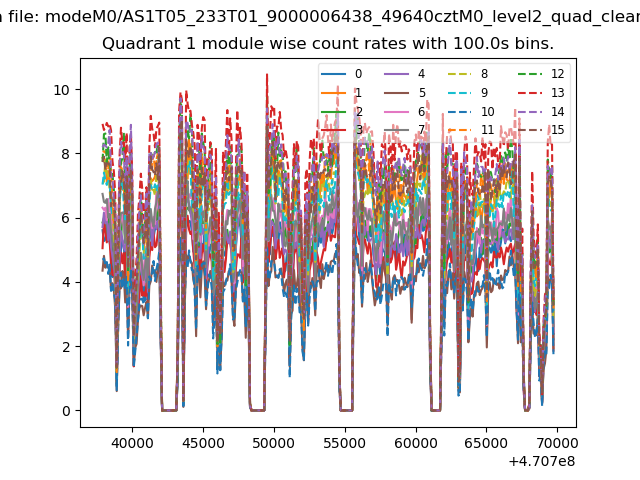
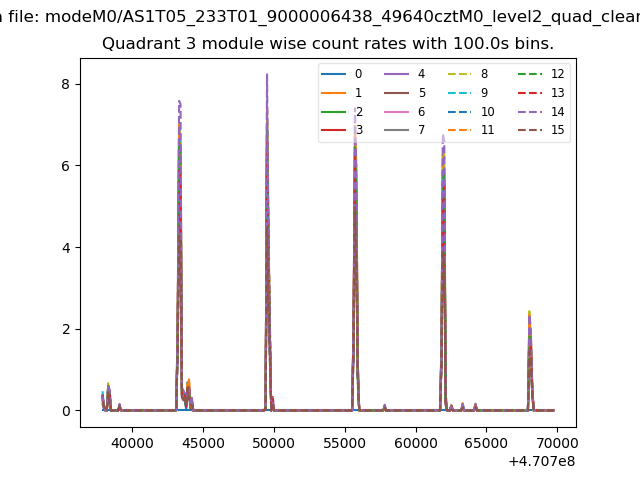
| Module-wise count rates for Quadrant A Data is divided into 100 sec bins |
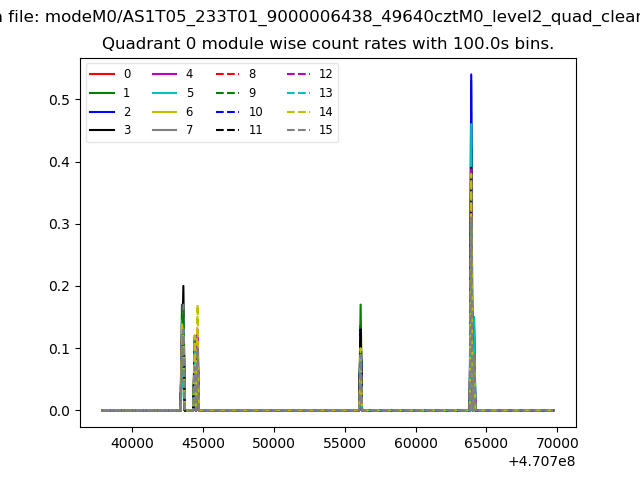 |
 |
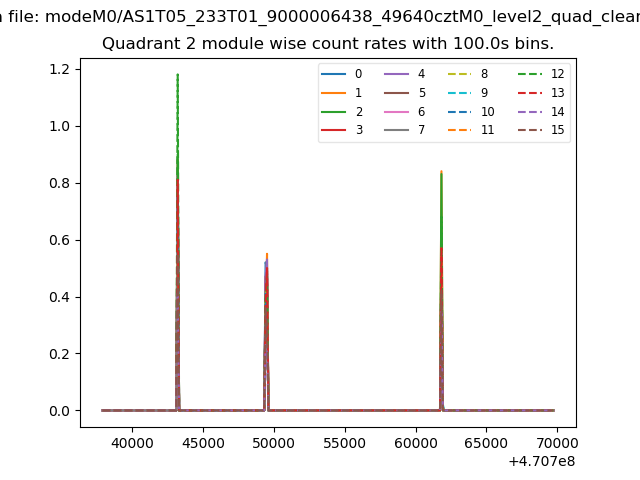
| Module-wise count rates for Quadrant B Data is divided into 100 sec bins |
 |
 |
| Module-wise count rates for Quadrant C Data is divided into 100 sec bins |
 |
 |
| Module-wise count rates for Quadrant D Data is divided into 100 sec bins |
 |
 |
| Parameter | Plot |
|---|---|
| CZT HV Monitor | 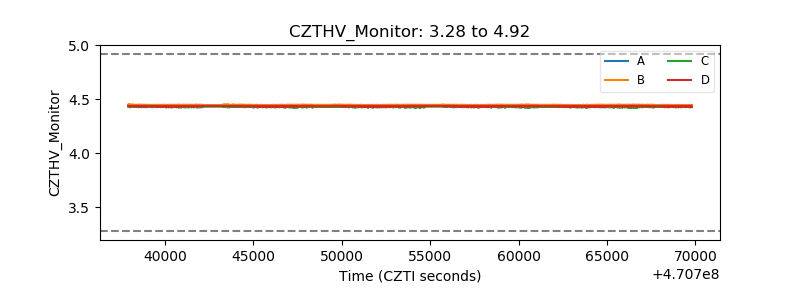 |
| D_VDD | 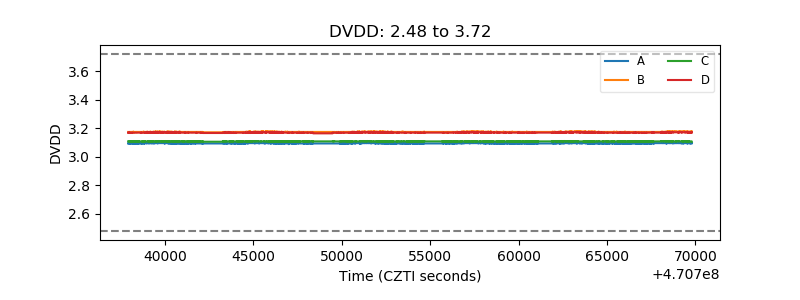 |
| Temperature 1 | 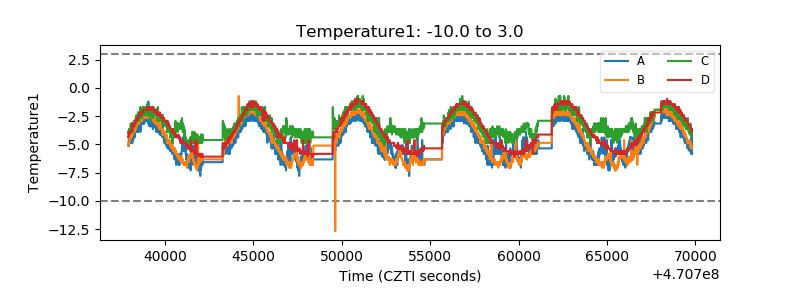 |
| Veto HV Monitor | 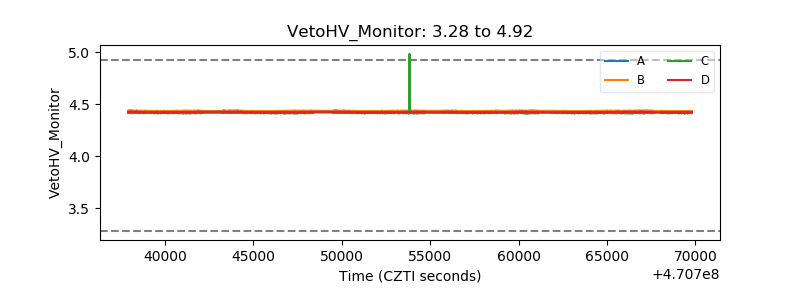 |
| Veto LLD | 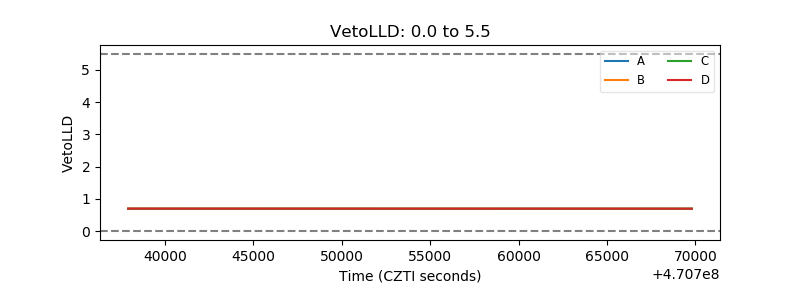 |
| Alpha Counter | 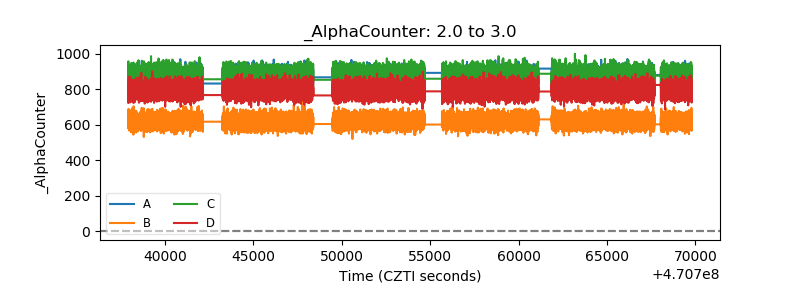 |
| _CPM_Rate | 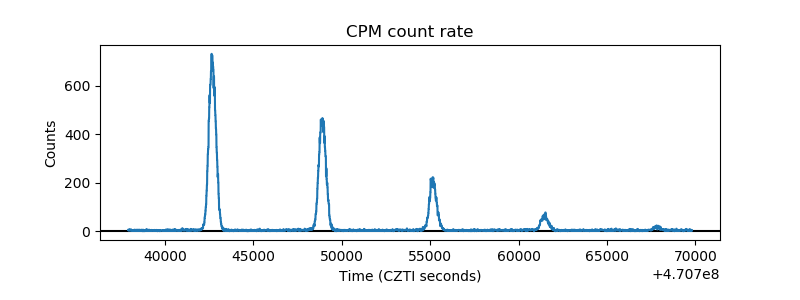 |
| CZT Counter | 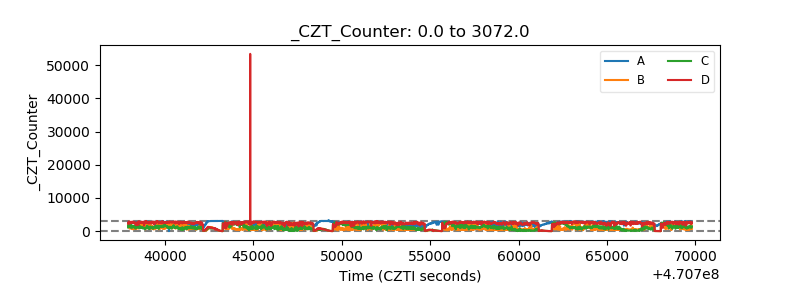 |
| +2.5 Volts monitor | 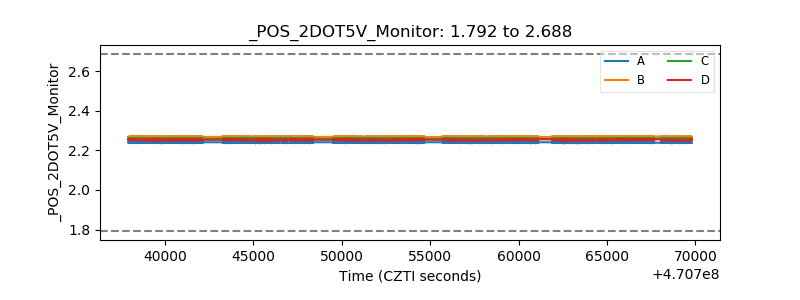 |
| +5 Volts monitor | 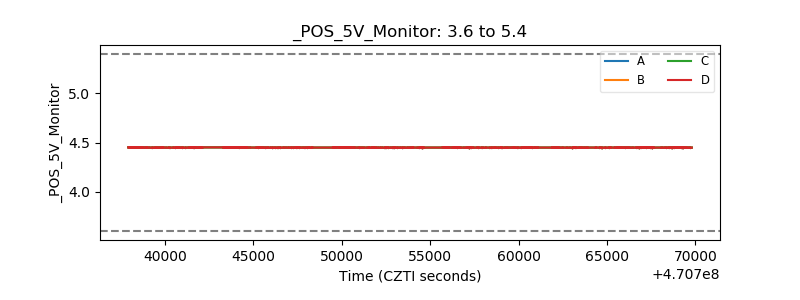 |
| _ROLL_ROT | 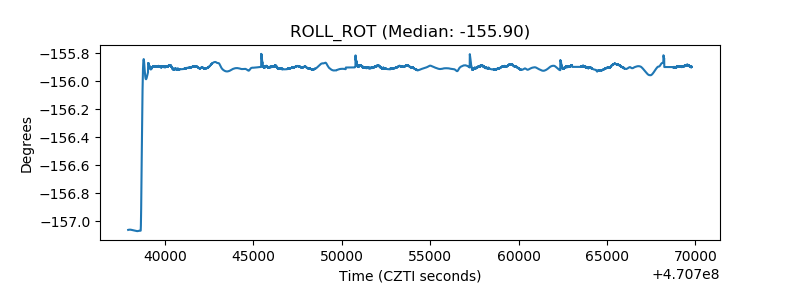 |
| _Roll_DEC | 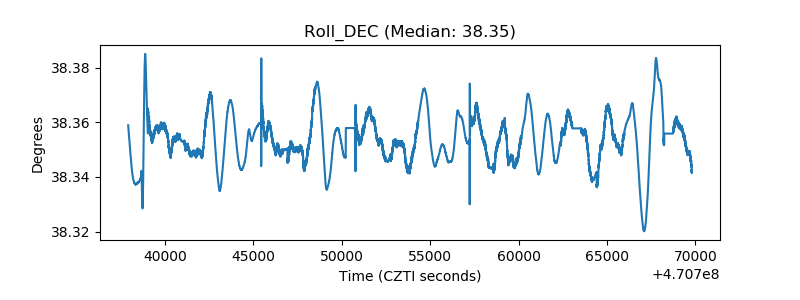 |
| _Roll_RA | 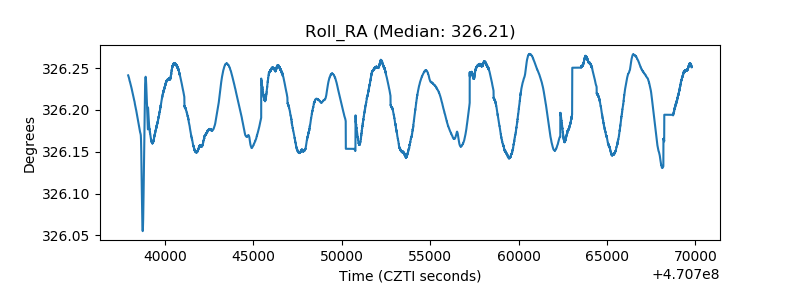 |
| Veto Counter | 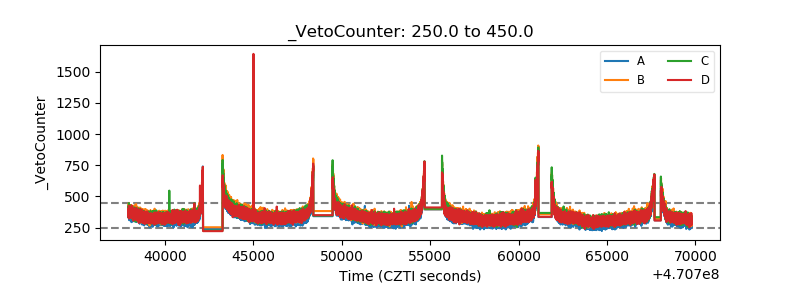 |