| Param | Original file | Final file |
|---|---|---|
| Filename | modeM0/AS1T05_233T01_9000006438_49641cztM0_level2.fits | modeM0/AS1T05_233T01_9000006438_49641cztM0_level2_quad_clean.evt |
| Size (bytes) | 1,383,312,960 | 43,476,480 |
| Size | 1.3 GB | 41.5 MB |
| Events in quadrant A | 17,754,013 | 73,652 |
| Events in quadrant B | 8,530,144 | 631,500 |
| Events in quadrant C | 7,317,222 | 4,236 |
| Events in quadrant D | 17,042,317 | 90,676 |
| Mode SS | |||
|---|---|---|---|
| Quadrant | BADHDUFLAG | Total packets | Discarded packets |
| A | 0 | 146 | 0 |
| B | 0 | 146 | 0 |
| C | 0 | 146 | 0 |
| D | 0 | 146 | 0 |
| Mode M0 | |||
|---|---|---|---|
| Quadrant | BADHDUFLAG | Total packets | Discarded packets |
| A | 0 | 57607 | 0 |
| B | 0 | 30375 | 0 |
| C | 0 | 26945 | 0 |
| D | 0 | 55561 | 0 |
| Quadrant | Total seconds | Saturated seconds | Saturation percentage |
|---|---|---|---|
| A | 7249 | 7249 | 100.000000% |
| B | 7249 | 1953 | 26.941647% |
| C | 7250 | 7250 | 100.000000% |
| D | 7249 | 7249 | 100.000000% |
Noise dominated data is calculated using 1-second bins in cleaned event files. If a bin has >2000 counts, and if more than 50% of those come from <1% of pixels, then it is considered to be noise-dominated and hence unusable.
| Quadrant | # 1 sec bins | Bins with >0 counts | Bins with >2000 counts | High rate bins dominated by noise | Noise dominated (total time) | Noise dominated (detector-on time) | Marked lightcurve |
|---|---|---|---|---|---|---|---|
| A | 7248 | 7248 | 6758 | 6758 | 93.24% | 93.24% | 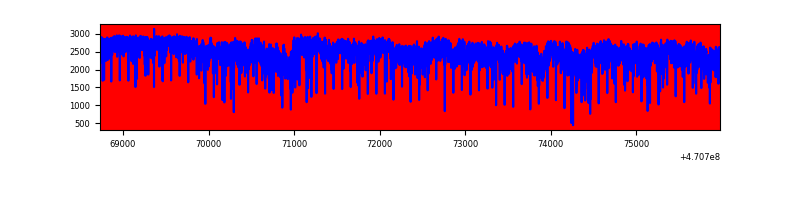 |
| B | 7249 | 7249 | 1610 | 1610 | 22.21% | 22.21% | 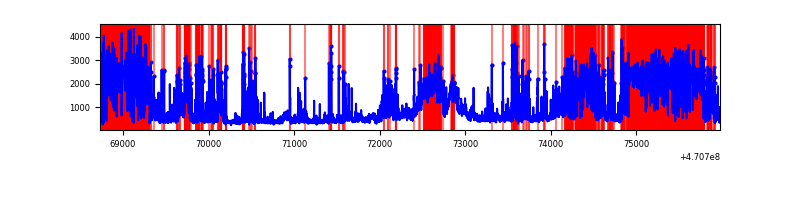 |
| C | 7249 | 7249 | 4 | 4 | 0.06% | 0.06% |  |
| D | 7248 | 7248 | 6373 | 6373 | 87.93% | 87.93% |  |
Top three noisy pixels from each quadrant. If the there are fewer than three noisy pixels in the level2.evt file, extra rows are filled as -1
| Pixel properties | Quadrant properties | ||||||
|---|---|---|---|---|---|---|---|
| Quadrant | DetID | PixID | Counts | Sigma | Mean | Median | Sigma |
| A | 0 | 99 | 8615722 | 160216.4 | 104 | 96 | 53.8 |
| A | 0 | 98 | 2037544 | 37888.44 | 104 | 96 | 53.8 |
| A | 10 | 83 | 1688397 | 31395.69 | 104 | 96 | 53.8 |
| B | 3 | 232 | 2015751 | 14237.57 | 666 | 646 | 141.5 |
| B | 5 | 173 | 1069241 | 7550.07 | 666 | 646 | 141.5 |
| B | 4 | 206 | 710640 | 5016.41 | 666 | 646 | 141.5 |
| C | 15 | 181 | 1300125 | 79196.22 | 19 | 17 | 16.4 |
| C | 15 | 180 | 1172537 | 71424.18 | 19 | 17 | 16.4 |
| C | 15 | 190 | 989369 | 60266.48 | 19 | 17 | 16.4 |
| D | 7 | 45 | 4762202 | 54059.41 | 136 | 122 | 88.1 |
| D | 15 | 40 | 3767725 | 42770.05 | 136 | 122 | 88.1 |
| D | 15 | 184 | 1996170 | 22659.25 | 136 | 122 | 88.1 |
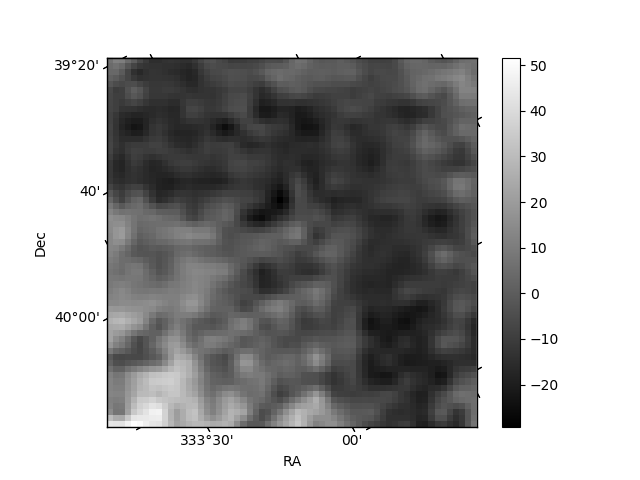
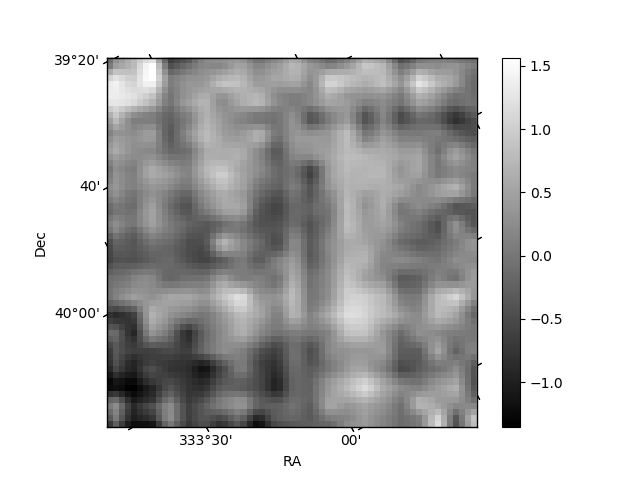
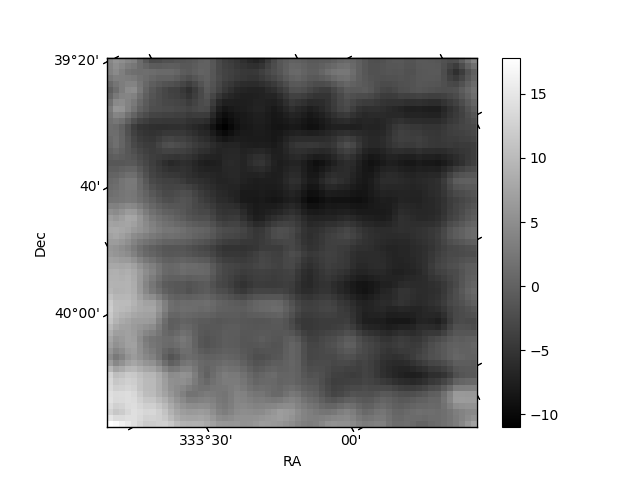
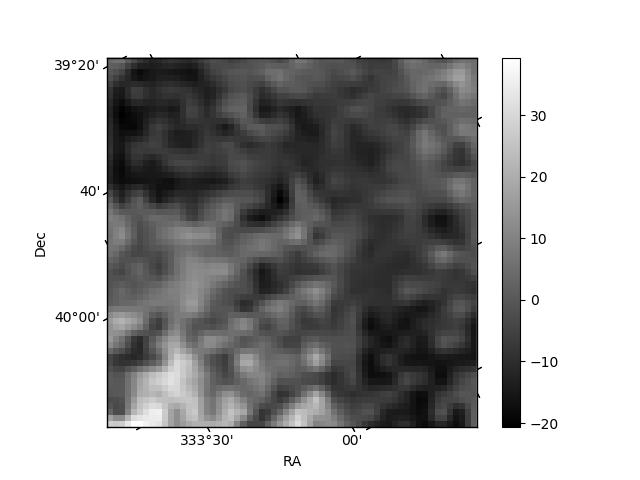
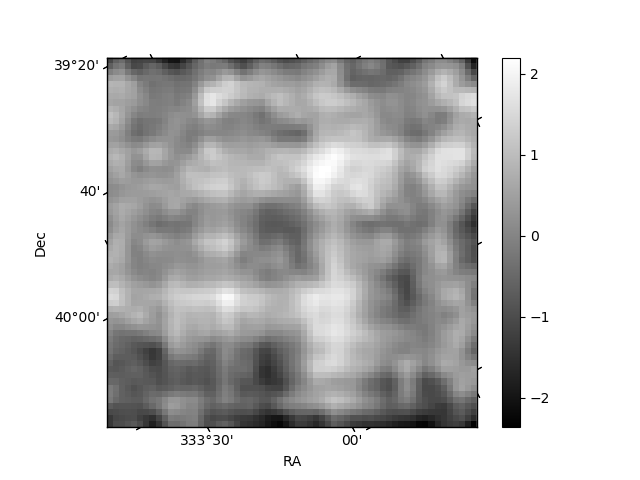
Histogram calculated using DETX and DETY for each event in the final _common_clean file
| Quadrant A | 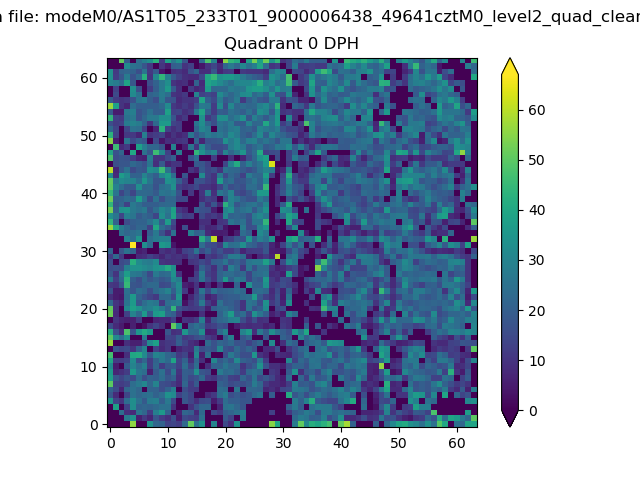 |
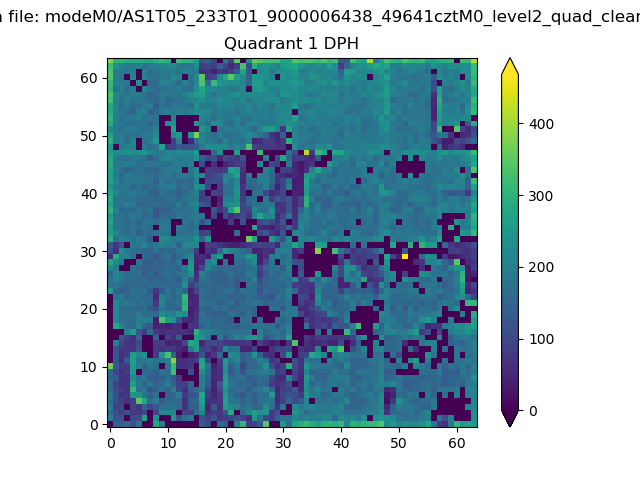 |
Quadrant B |
|---|---|---|---|
| Quadrant D | 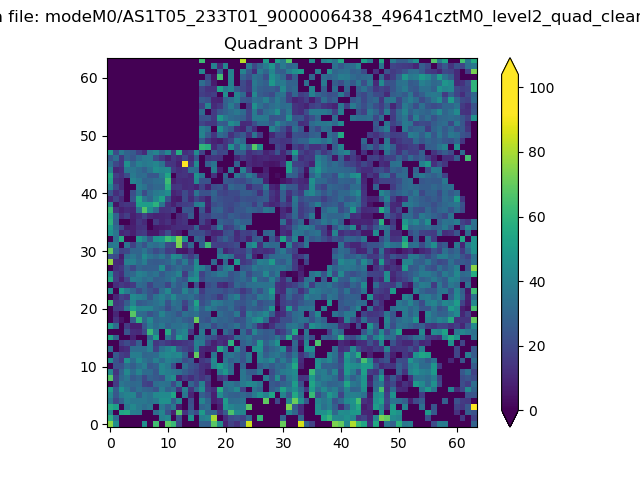 |
 |
Quadrant C |
| Plot type | Count rate plots | Images |
|---|---|---|
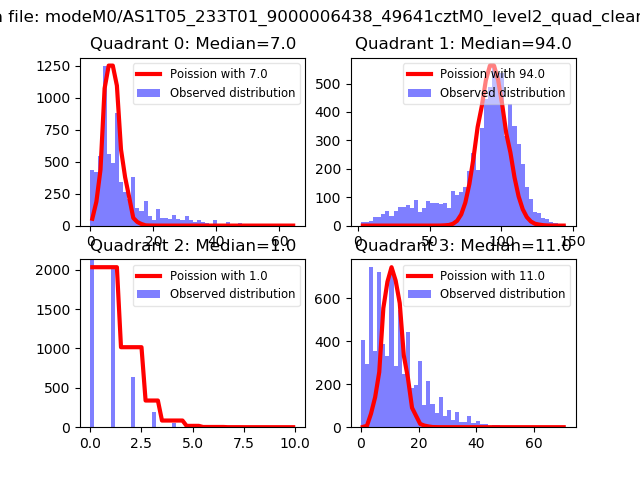
| Comparison with Poisson distribution Blue bars denote a histogram of data divided into 1 sec bins. Red curve is a Poisson curve with rate = median count rate of data. |
 |
 |
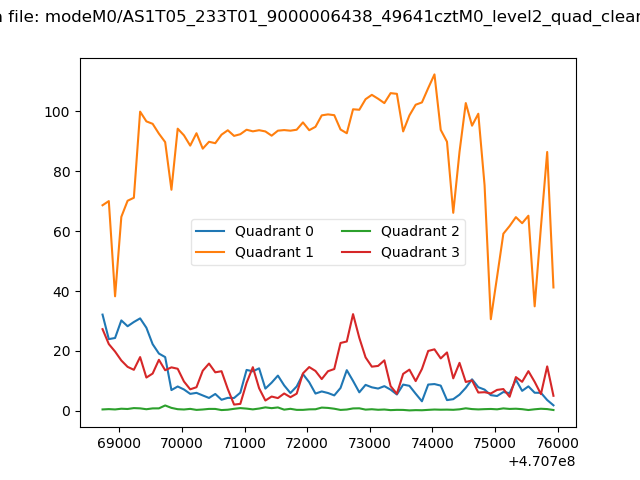
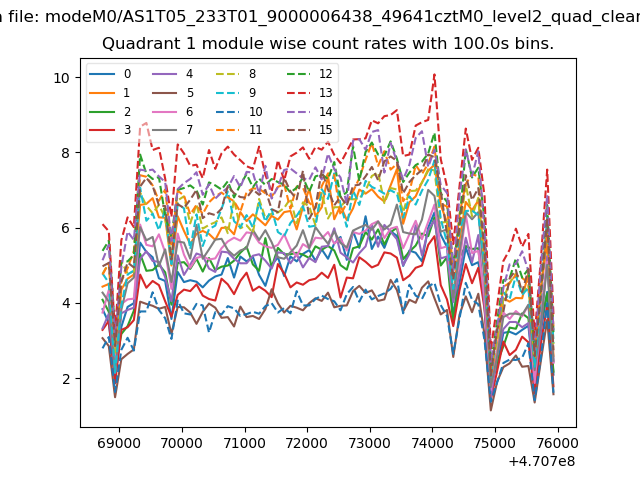
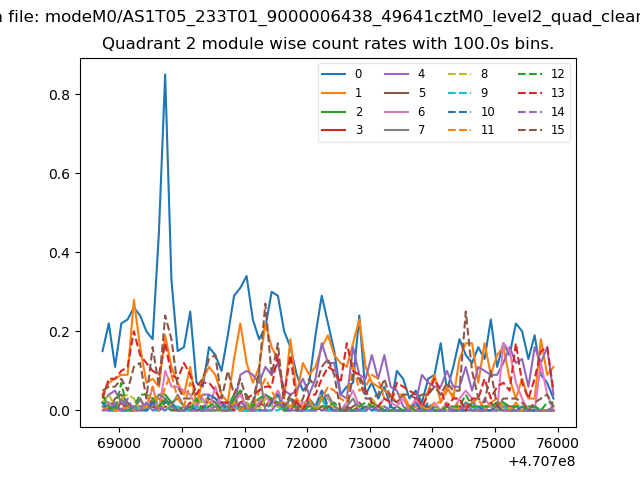
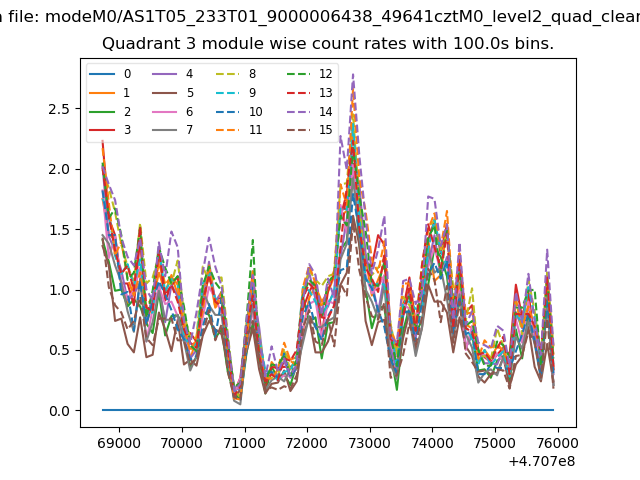
| Quadrant-wise count rates Data is divided into 100 sec bins |
 |
|
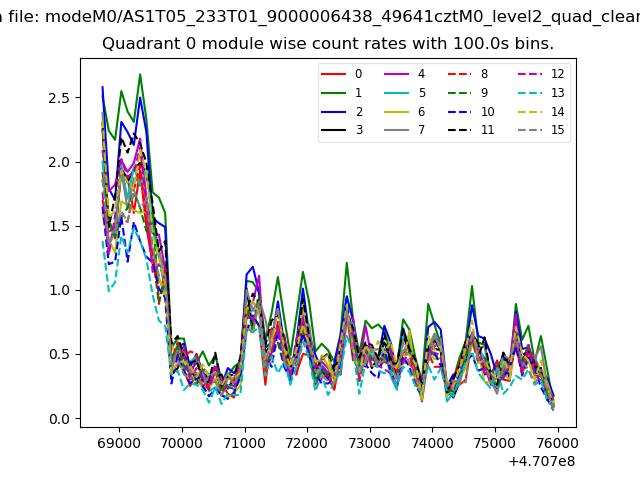
| Module-wise count rates for Quadrant A Data is divided into 100 sec bins |
 |
 |
| Module-wise count rates for Quadrant B Data is divided into 100 sec bins |
 |
 |
| Module-wise count rates for Quadrant C Data is divided into 100 sec bins |
 |
 |
| Module-wise count rates for Quadrant D Data is divided into 100 sec bins |
 |
 |
| Parameter | Plot |
|---|---|
| CZT HV Monitor |  |
| D_VDD | 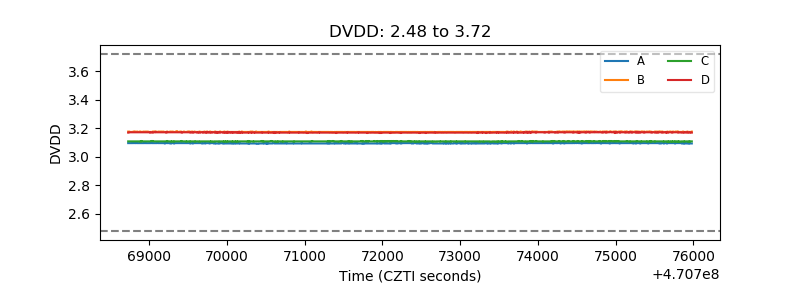 |
| Temperature 1 | 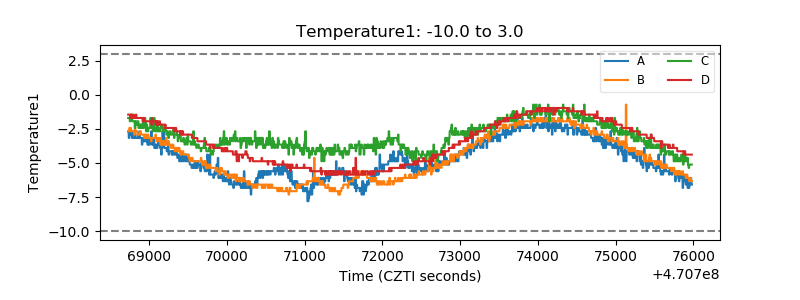 |
| Veto HV Monitor | 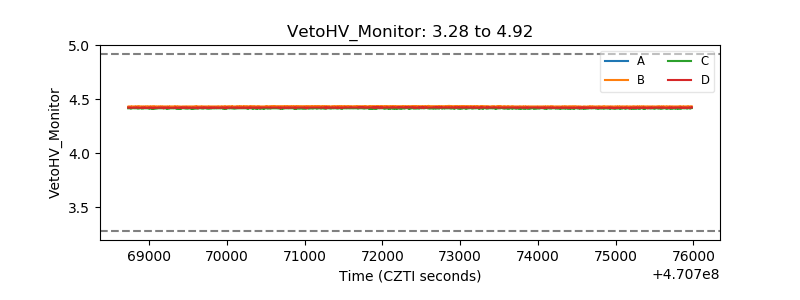 |
| Veto LLD | 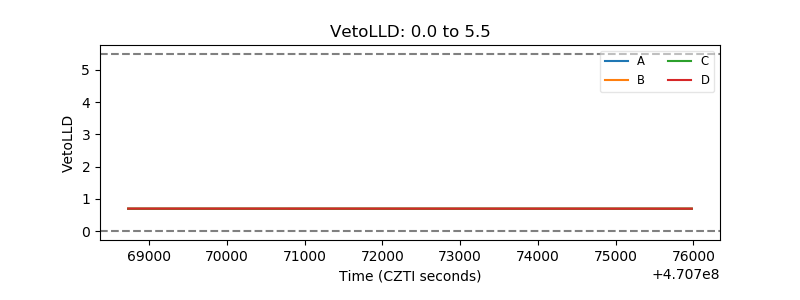 |
| Alpha Counter | 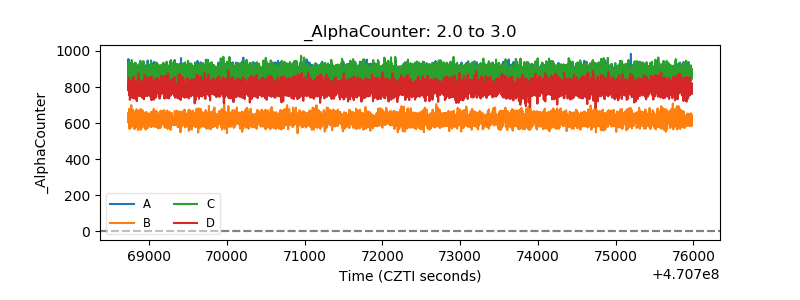 |
| _CPM_Rate | 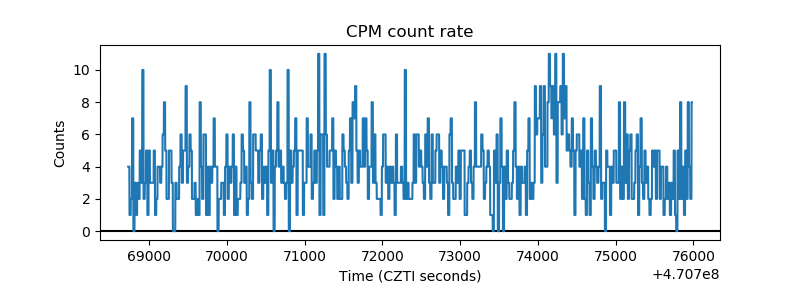 |
| CZT Counter | 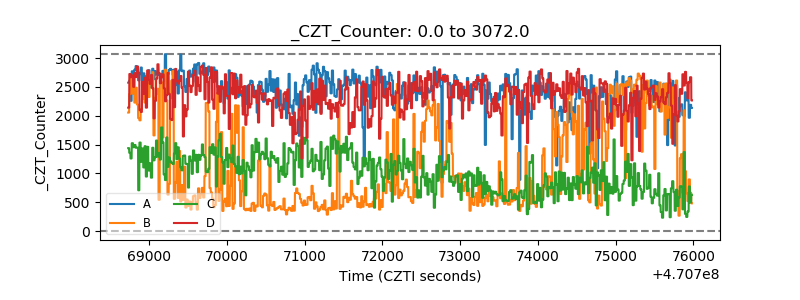 |
| +2.5 Volts monitor | 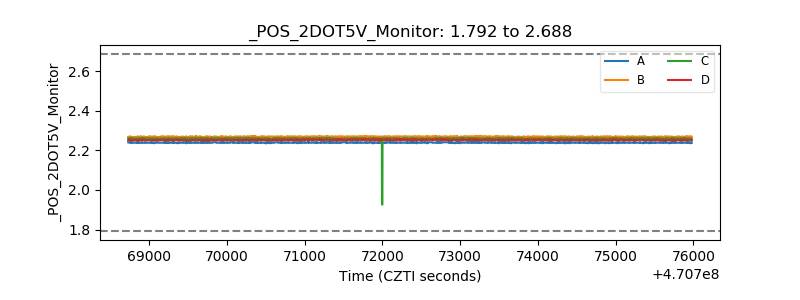 |
| +5 Volts monitor | 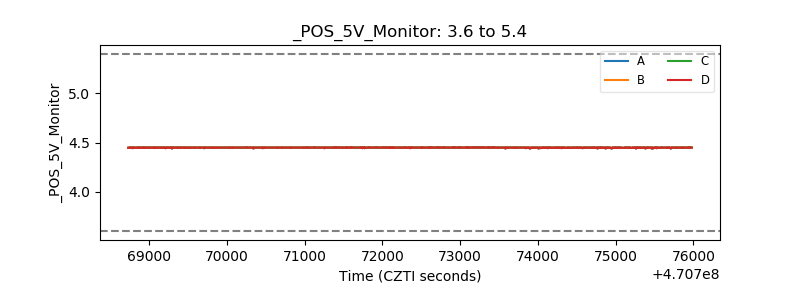 |
| _ROLL_ROT | 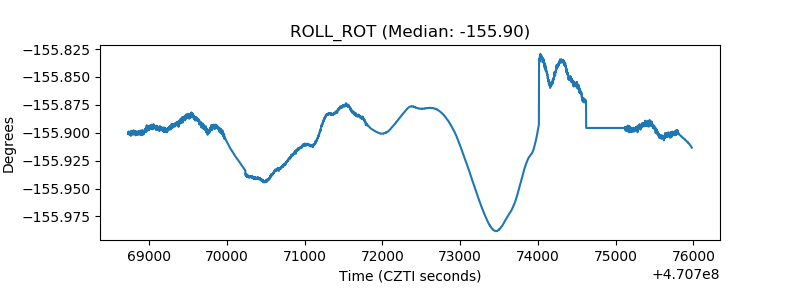 |
| _Roll_DEC | 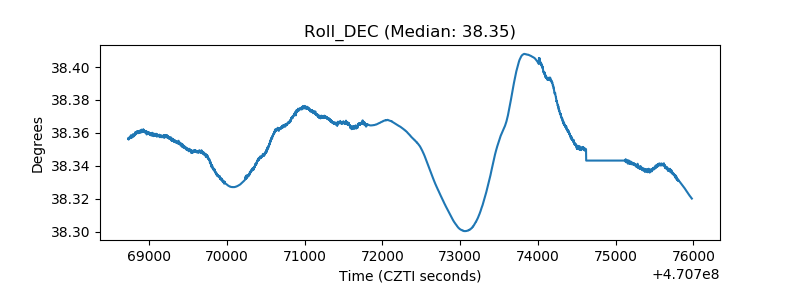 |
| _Roll_RA | 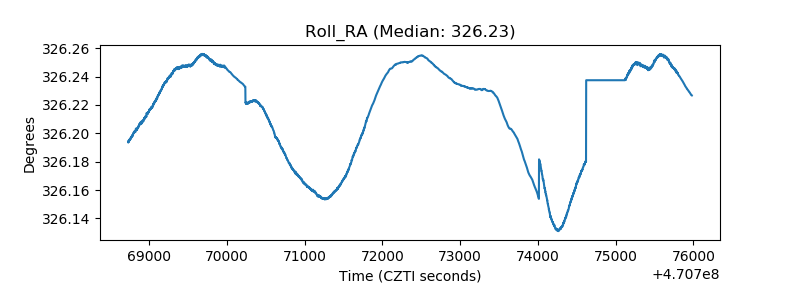 |
| Veto Counter | 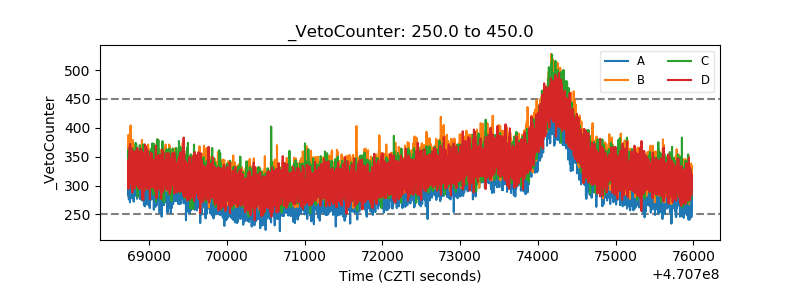 |