| Param | Original file | Final file |
|---|---|---|
| Filename | modeM0/AS1T05_233T01_9000006438_49642cztM0_level2.fits | modeM0/AS1T05_233T01_9000006438_49642cztM0_level2_quad_clean.evt |
| Size (bytes) | 1,193,883,840 | 40,026,240 |
| Size | 1.1 GB | 38.2 MB |
| Events in quadrant A | 15,708,224 | 32,785 |
| Events in quadrant B | 7,654,454 | 602,400 |
| Events in quadrant C | 4,310,978 | 4,691 |
| Events in quadrant D | 15,963,087 | 63,873 |
| Mode SS | |||
|---|---|---|---|
| Quadrant | BADHDUFLAG | Total packets | Discarded packets |
| A | 0 | 142 | 0 |
| B | 0 | 142 | 0 |
| C | 0 | 142 | 0 |
| D | 0 | 142 | 0 |
| Mode M0 | |||
|---|---|---|---|
| Quadrant | BADHDUFLAG | Total packets | Discarded packets |
| A | 0 | 51535 | 0 |
| B | 0 | 27689 | 0 |
| C | 0 | 17962 | 0 |
| D | 0 | 52292 | 0 |
| Quadrant | Total seconds | Saturated seconds | Saturation percentage |
|---|---|---|---|
| A | 7138 | 7138 | 100.000000% |
| B | 7138 | 1983 | 27.780891% |
| C | 7139 | 7139 | 100.000000% |
| D | 7138 | 7138 | 100.000000% |
Noise dominated data is calculated using 1-second bins in cleaned event files. If a bin has >2000 counts, and if more than 50% of those come from <1% of pixels, then it is considered to be noise-dominated and hence unusable.
| Quadrant | # 1 sec bins | Bins with >0 counts | Bins with >2000 counts | High rate bins dominated by noise | Noise dominated (total time) | Noise dominated (detector-on time) | Marked lightcurve |
|---|---|---|---|---|---|---|---|
| A | 7137 | 7137 | 5205 | 5205 | 72.93% | 72.93% | 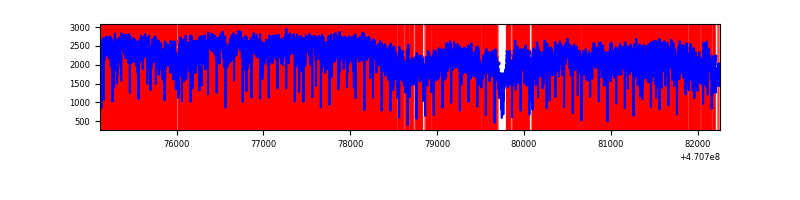 |
| B | 7138 | 7138 | 1631 | 1631 | 22.85% | 22.85% |  |
| C | 7138 | 7138 | 2 | 2 | 0.03% | 0.03% | 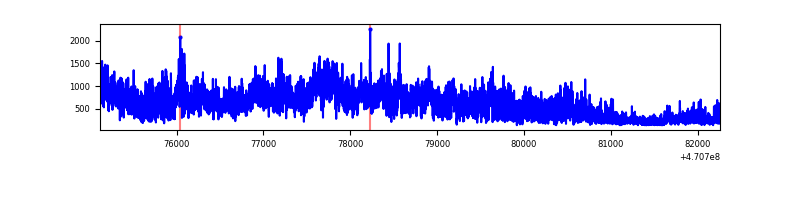 |
| D | 7137 | 7137 | 5619 | 5619 | 78.73% | 78.73% | 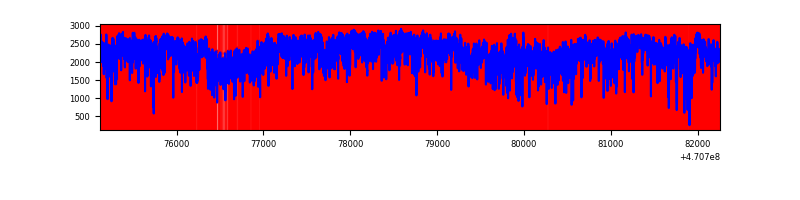 |
Top three noisy pixels from each quadrant. If the there are fewer than three noisy pixels in the level2.evt file, extra rows are filled as -1
| Pixel properties | Quadrant properties | ||||||
|---|---|---|---|---|---|---|---|
| Quadrant | DetID | PixID | Counts | Sigma | Mean | Median | Sigma |
| A | 0 | 99 | 8541274 | 163556.11 | 62 | 54 | 52.2 |
| A | 6 | 35 | 1193291 | 22849.34 | 62 | 54 | 52.2 |
| A | 10 | 83 | 1038798 | 19890.94 | 62 | 54 | 52.2 |
| B | 3 | 232 | 3170852 | 23232.52 | 636 | 615 | 136.5 |
| B | 3 | 216 | 539910 | 3952.13 | 636 | 615 | 136.5 |
| B | 4 | 206 | 411922 | 3014.19 | 636 | 615 | 136.5 |
| C | 15 | 181 | 775989 | 49909.09 | 9 | 8 | 15.5 |
| C | 15 | 180 | 665119 | 42778.22 | 9 | 8 | 15.5 |
| C | 15 | 197 | 408206 | 26254.24 | 9 | 8 | 15.5 |
| D | 7 | 45 | 3518107 | 44144.54 | 101 | 89 | 79.7 |
| D | 15 | 184 | 3103873 | 38946.68 | 101 | 89 | 79.7 |
| D | 15 | 40 | 2069606 | 25968.56 | 101 | 89 | 79.7 |
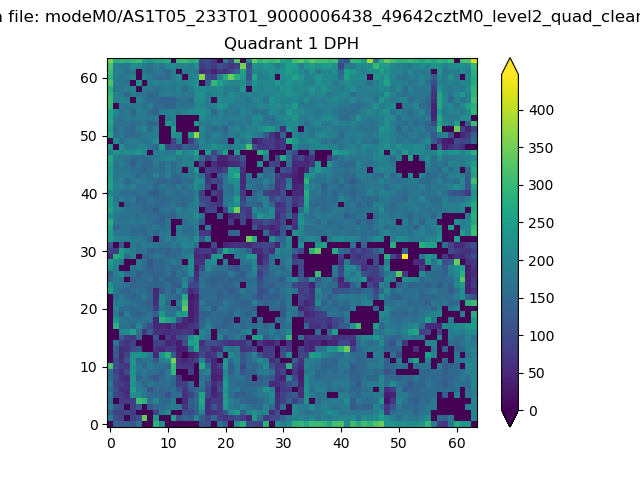
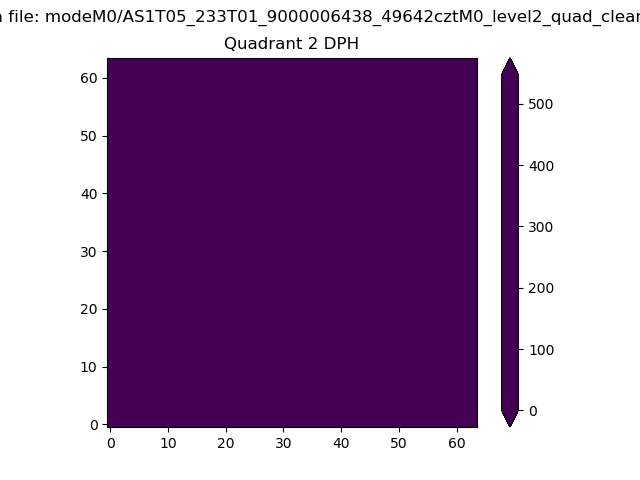
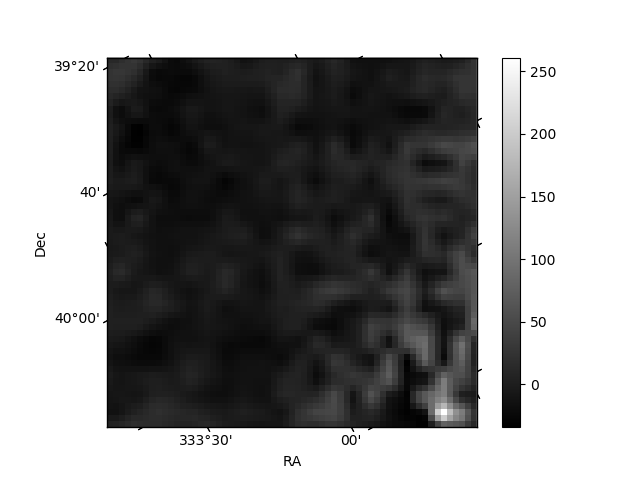
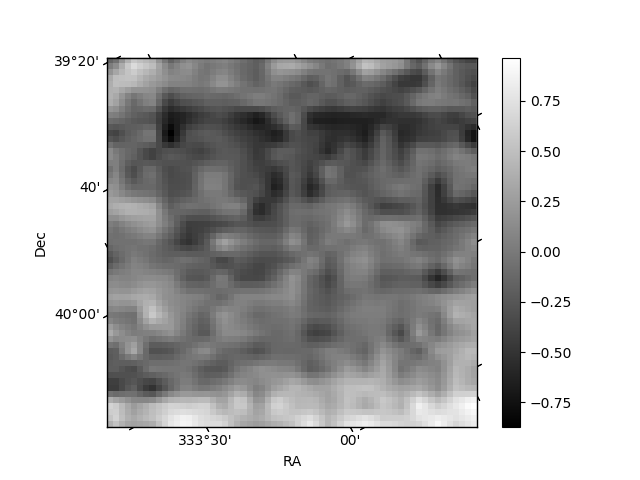
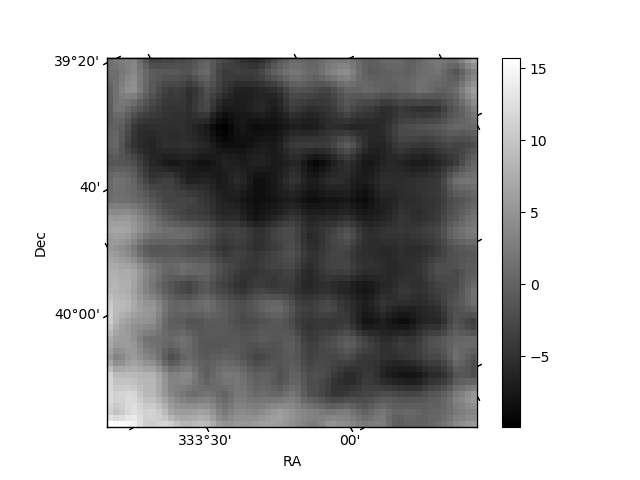
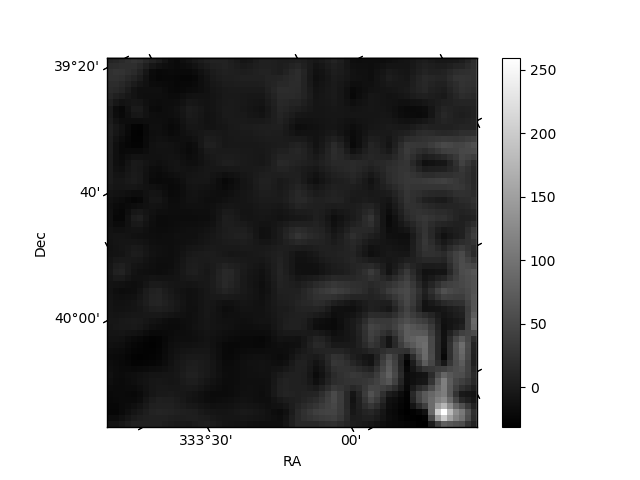
Histogram calculated using DETX and DETY for each event in the final _common_clean file
| Quadrant A | 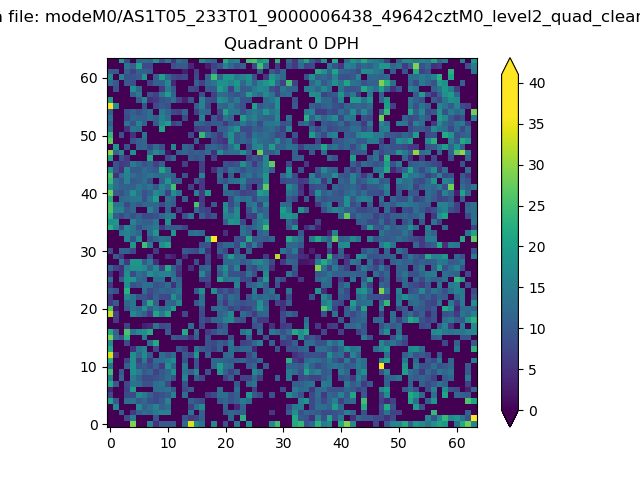 |
 |
Quadrant B |
|---|---|---|---|
| Quadrant D | 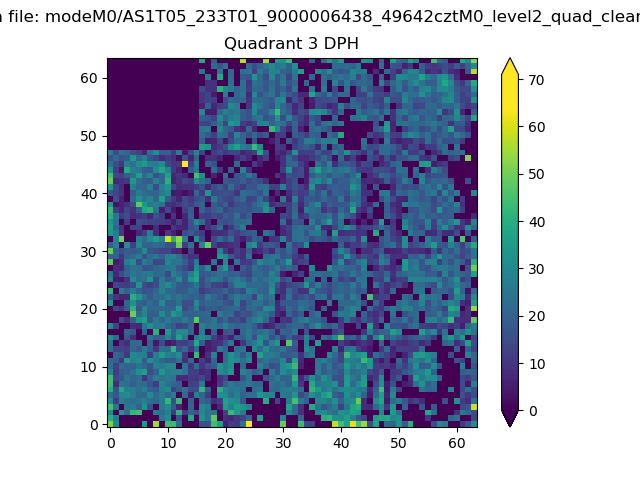 |
 |
Quadrant C |
| Plot type | Count rate plots | Images |
|---|---|---|
| Comparison with Poisson distribution Blue bars denote a histogram of data divided into 1 sec bins. Red curve is a Poisson curve with rate = median count rate of data. |
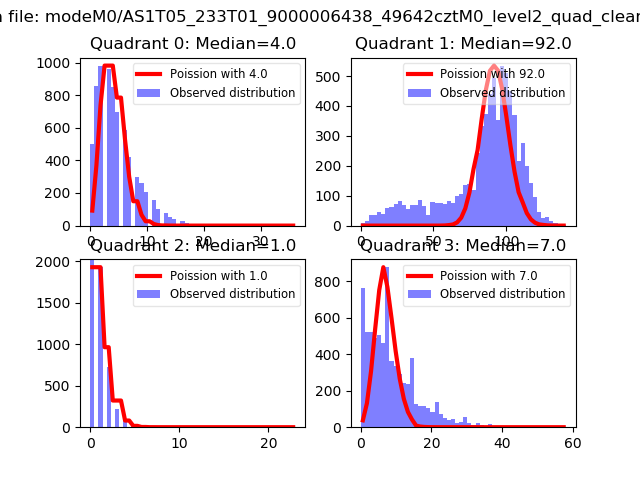 |
 |
| Quadrant-wise count rates Data is divided into 100 sec bins |
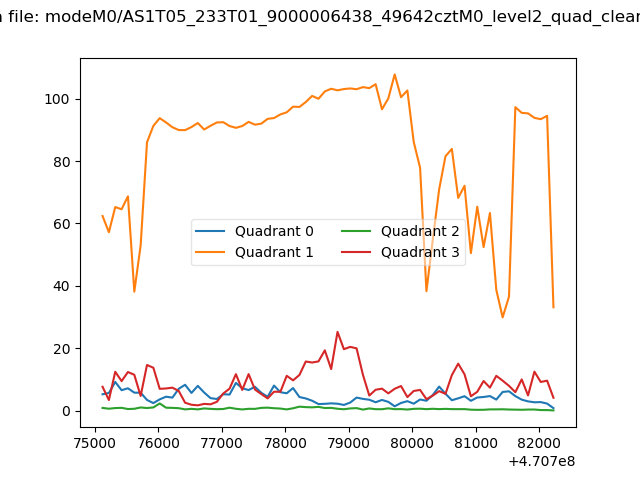 |
|
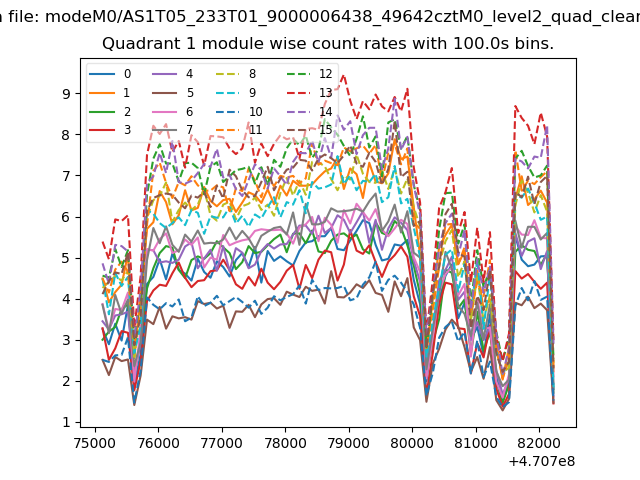
| Module-wise count rates for Quadrant A Data is divided into 100 sec bins |
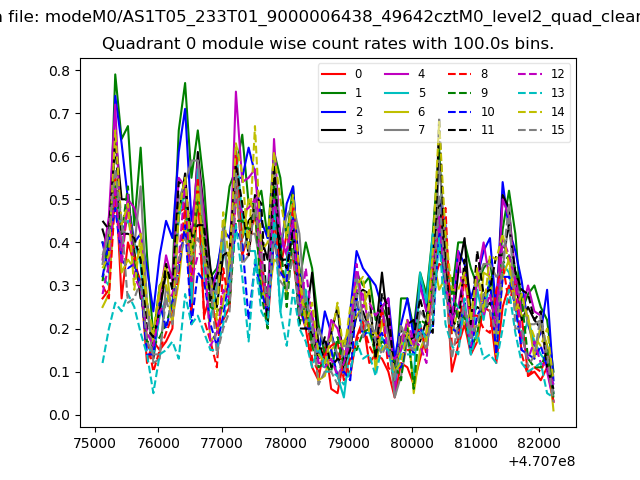 |
 |
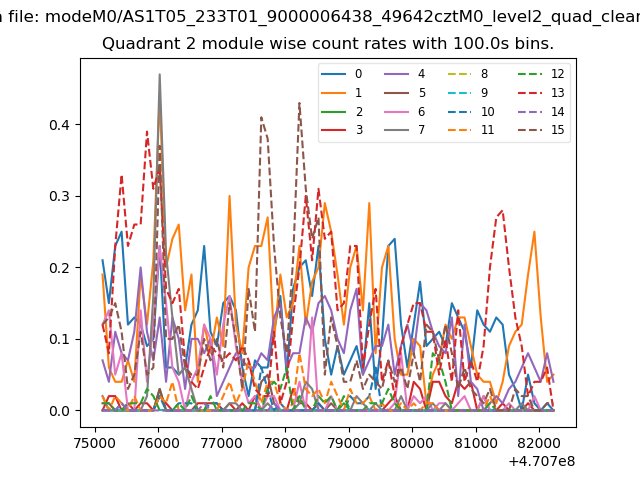
| Module-wise count rates for Quadrant B Data is divided into 100 sec bins |
 |
 |
| Module-wise count rates for Quadrant C Data is divided into 100 sec bins |
 |
 |
| Module-wise count rates for Quadrant D Data is divided into 100 sec bins |
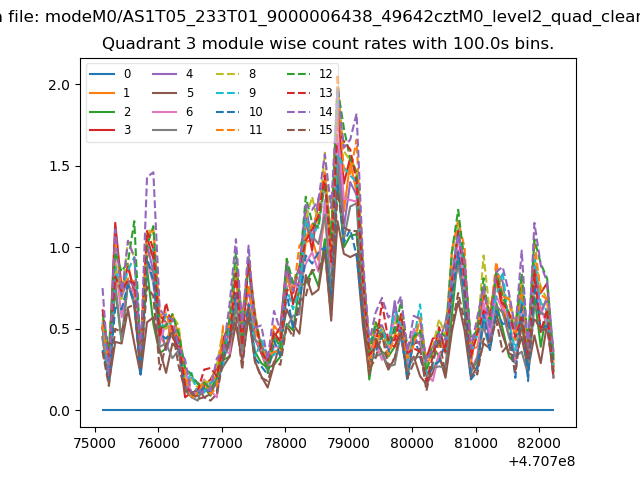 |
 |
| Parameter | Plot |
|---|---|
| CZT HV Monitor | 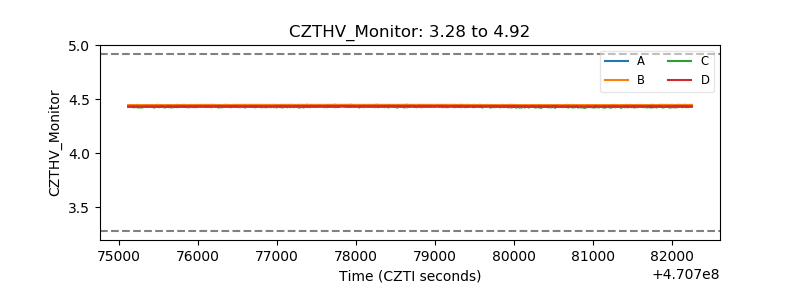 |
| D_VDD | 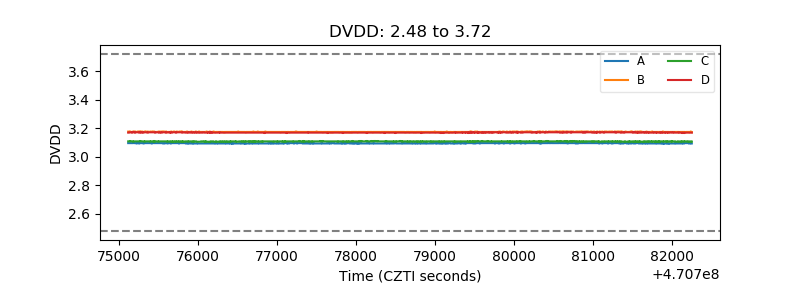 |
| Temperature 1 | 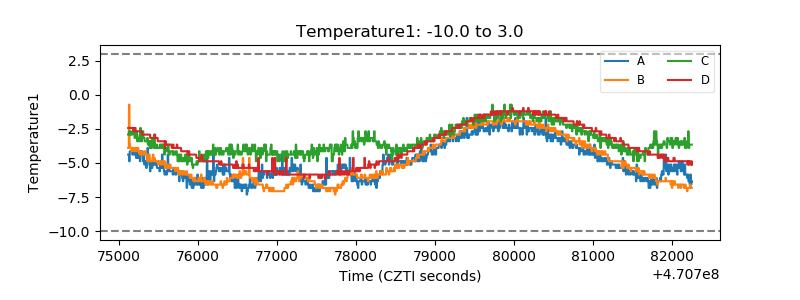 |
| Veto HV Monitor | 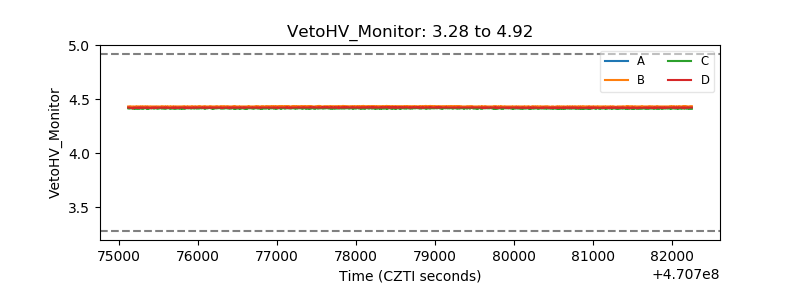 |
| Veto LLD | 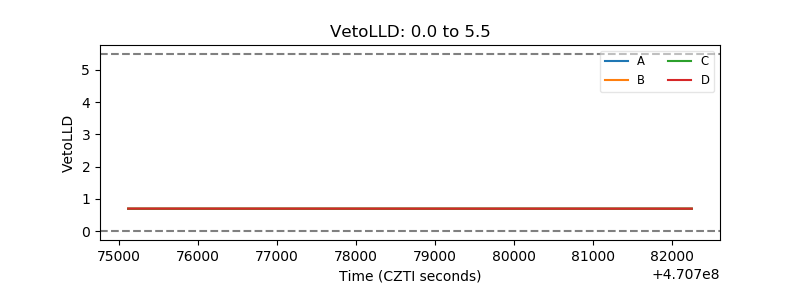 |
| Alpha Counter | 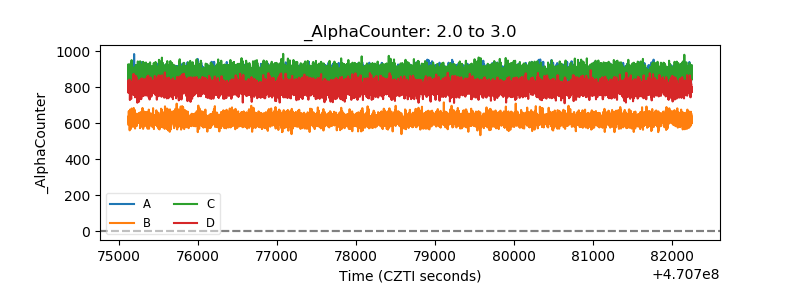 |
| _CPM_Rate | 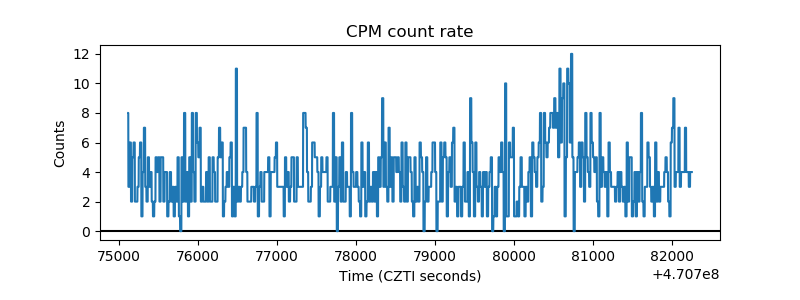 |
| CZT Counter | 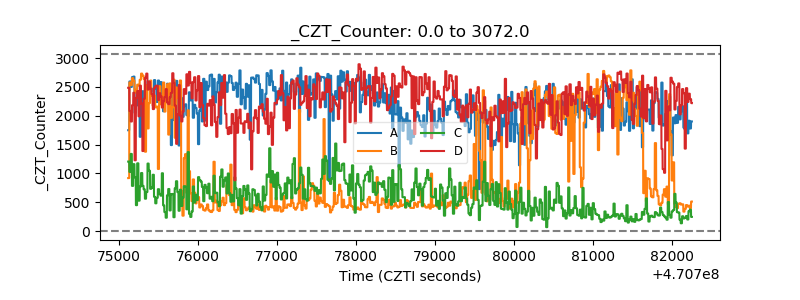 |
| +2.5 Volts monitor | 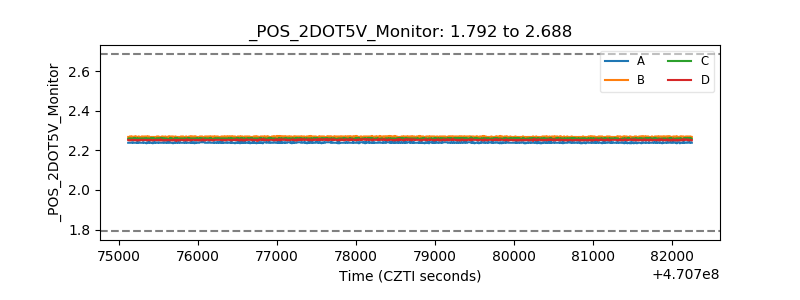 |
| +5 Volts monitor |  |
| _ROLL_ROT | 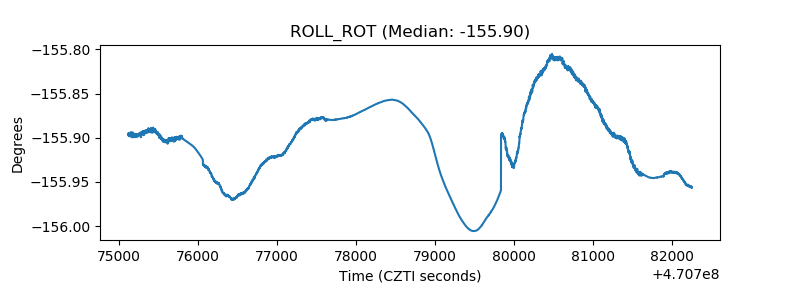 |
| _Roll_DEC | 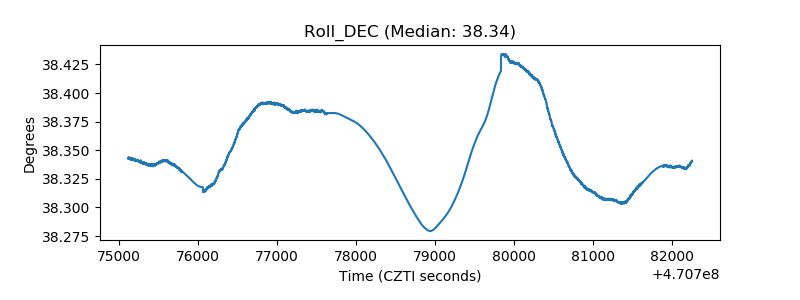 |
| _Roll_RA | 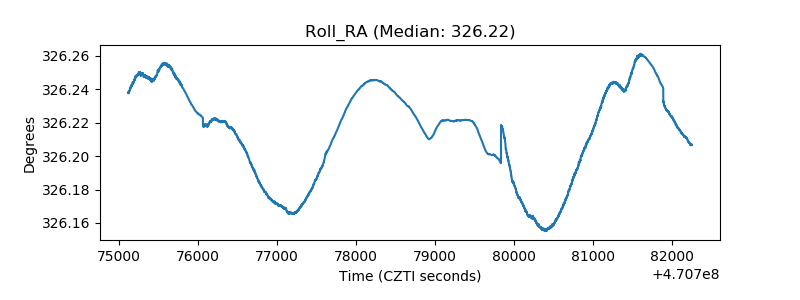 |
| Veto Counter | 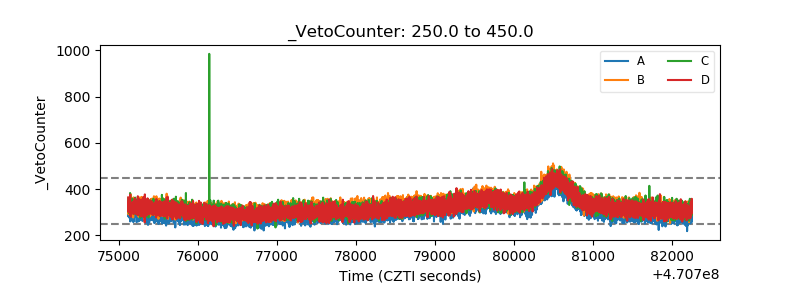 |