| Param | Original file | Final file |
|---|---|---|
| Filename | modeM0/AS1T05_233T01_9000006438_49646cztM0_level2.fits | modeM0/AS1T05_233T01_9000006438_49646cztM0_level2_quad_clean.evt |
| Size (bytes) | 1,275,759,360 | 48,634,560 |
| Size | 1.2 GB | 46.4 MB |
| Events in quadrant A | 17,164,516 | 223,925 |
| Events in quadrant B | 6,138,001 | 624,925 |
| Events in quadrant C | 6,780,333 | 2,471 |
| Events in quadrant D | 16,620,928 | 142,948 |
| Mode M9 | |||
|---|---|---|---|
| Quadrant | BADHDUFLAG | Total packets | Discarded packets |
| A | 0 | 8 | 0 |
| B | 0 | 8 | 0 |
| C | 0 | 8 | 0 |
| D | 0 | 8 | 0 |
| Mode SS | |||
|---|---|---|---|
| Quadrant | BADHDUFLAG | Total packets | Discarded packets |
| A | 0 | 136 | 0 |
| B | 0 | 136 | 0 |
| C | 0 | 136 | 0 |
| D | 0 | 136 | 0 |
| Mode M0 | |||
|---|---|---|---|
| Quadrant | BADHDUFLAG | Total packets | Discarded packets |
| A | 0 | 55643 | 0 |
| B | 0 | 22911 | 0 |
| C | 0 | 24888 | 0 |
| D | 0 | 53978 | 0 |
| Quadrant | Total seconds | Saturated seconds | Saturation percentage |
|---|---|---|---|
| A | 6718 | 6638 | 98.809169% |
| B | 6719 | 957 | 14.243191% |
| C | 6719 | 6719 | 100.000000% |
| D | 6719 | 6682 | 99.449323% |
Noise dominated data is calculated using 1-second bins in cleaned event files. If a bin has >2000 counts, and if more than 50% of those come from <1% of pixels, then it is considered to be noise-dominated and hence unusable.
| Quadrant | # 1 sec bins | Bins with >0 counts | Bins with >2000 counts | High rate bins dominated by noise | Noise dominated (total time) | Noise dominated (detector-on time) | Marked lightcurve |
|---|---|---|---|---|---|---|---|
| A | 7507 | 6717 | 6533 | 6533 | 87.03% | 97.26% | 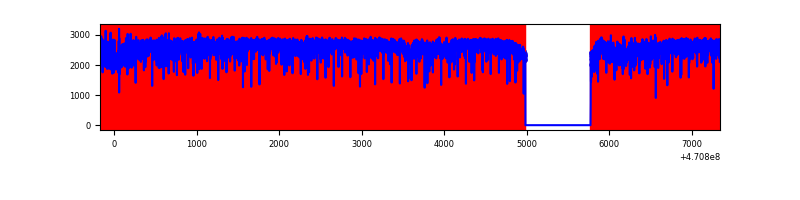 |
| B | 7509 | 6719 | 788 | 788 | 10.49% | 11.73% | 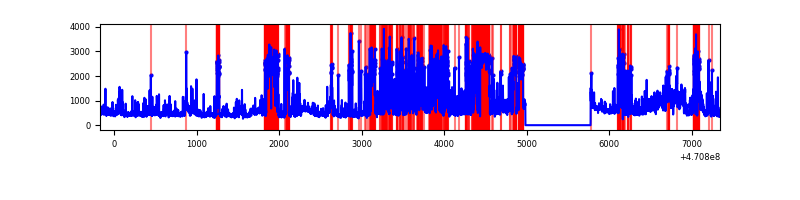 |
| C | 7508 | 6718 | 224 | 224 | 2.98% | 3.33% | 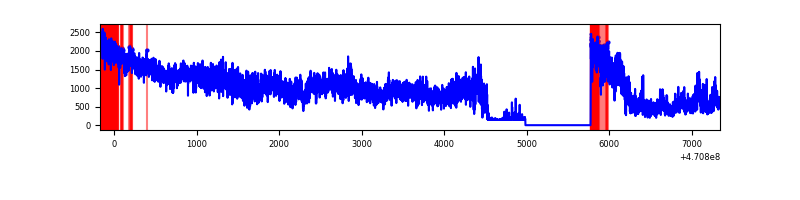 |
| D | 7508 | 6718 | 6381 | 6381 | 84.99% | 94.98% | 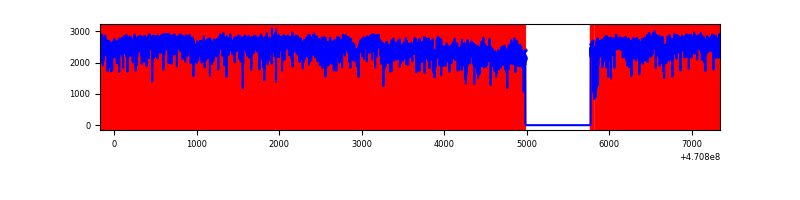 |
Top three noisy pixels from each quadrant. If the there are fewer than three noisy pixels in the level2.evt file, extra rows are filled as -1
| Pixel properties | Quadrant properties | ||||||
|---|---|---|---|---|---|---|---|
| Quadrant | DetID | PixID | Counts | Sigma | Mean | Median | Sigma |
| A | 0 | 99 | 6063804 | 60934.71 | 279 | 267 | 99.5 |
| A | 10 | 83 | 4438661 | 44603.05 | 279 | 267 | 99.5 |
| A | 12 | 50 | 1314982 | 13212.05 | 279 | 267 | 99.5 |
| B | 5 | 173 | 1894370 | 13426.78 | 665 | 645 | 141.0 |
| B | 4 | 206 | 431518 | 3054.95 | 665 | 645 | 141.0 |
| B | 5 | 172 | 263840 | 1866.09 | 665 | 645 | 141.0 |
| C | 15 | 180 | 1830301 | 122036.72 | 21 | 20 | 15.0 |
| C | 15 | 219 | 1075709 | 71723.17 | 21 | 20 | 15.0 |
| C | 15 | 197 | 633120 | 42212.89 | 21 | 20 | 15.0 |
| D | 7 | 45 | 4025870 | 49317.47 | 197 | 185 | 81.6 |
| D | 15 | 40 | 3602998 | 44136.99 | 197 | 185 | 81.6 |
| D | 15 | 106 | 1847651 | 22632.76 | 197 | 185 | 81.6 |
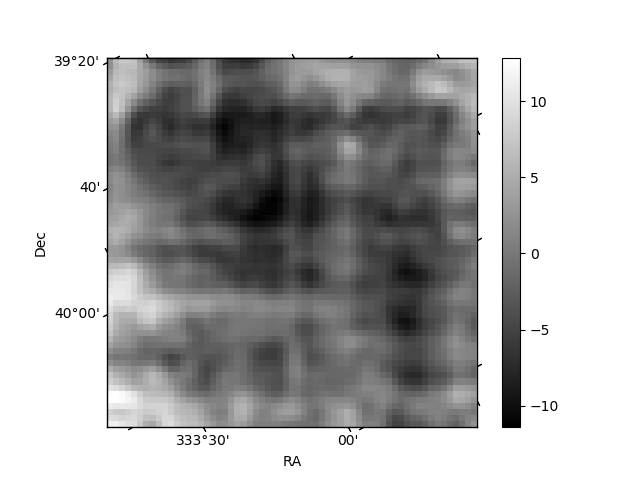
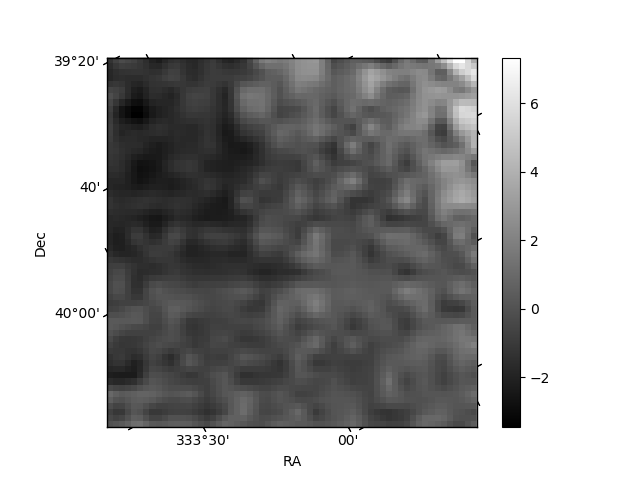
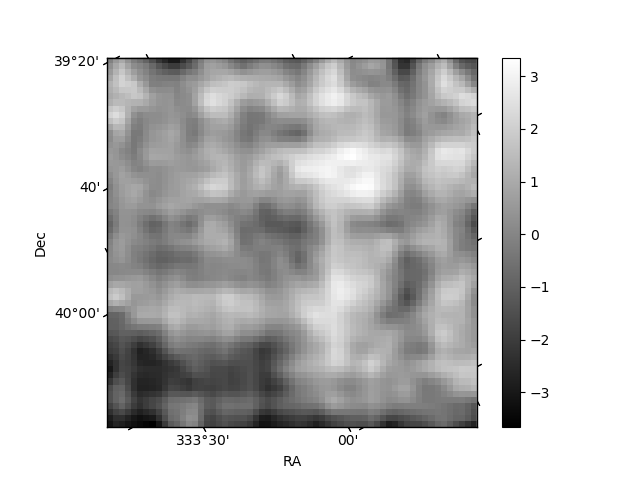
Histogram calculated using DETX and DETY for each event in the final _common_clean file
| Quadrant A | 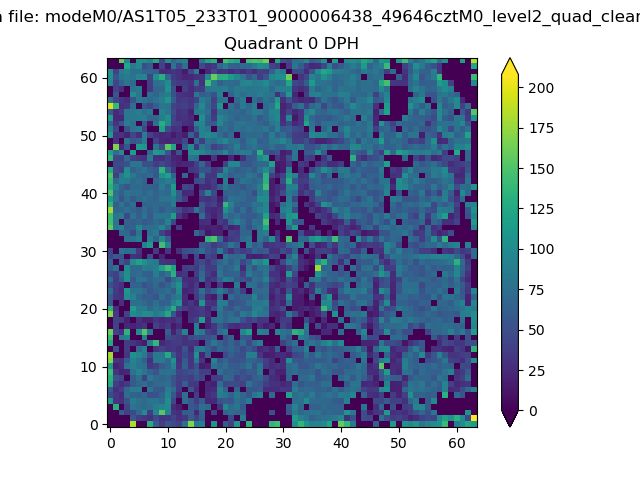 |
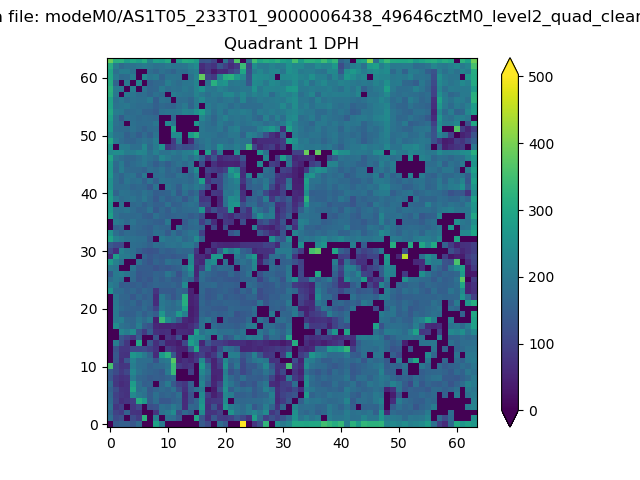 |
Quadrant B |
|---|---|---|---|
| Quadrant D | 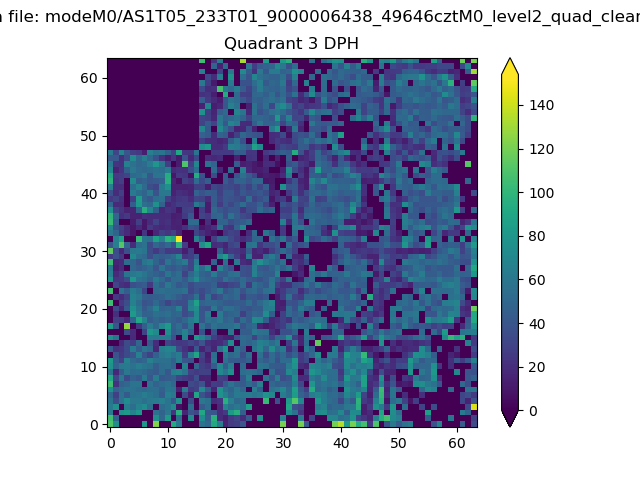 |
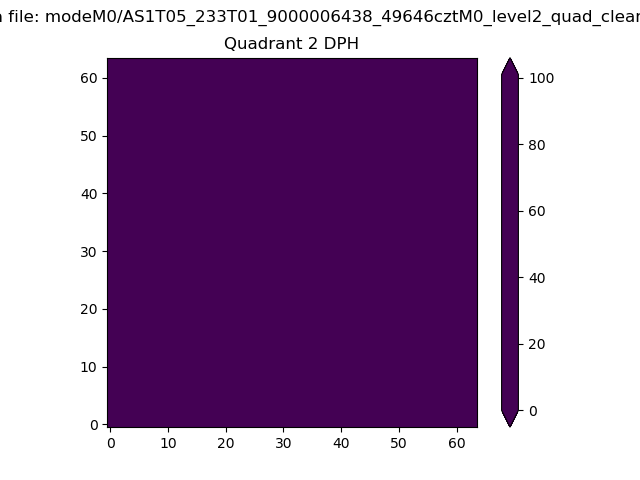 |
Quadrant C |
| Plot type | Count rate plots | Images |
|---|---|---|
| Comparison with Poisson distribution Blue bars denote a histogram of data divided into 1 sec bins. Red curve is a Poisson curve with rate = median count rate of data. |
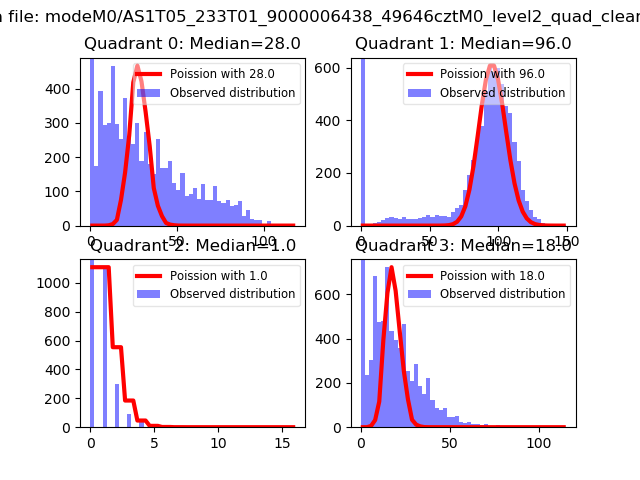 |
 |
| Quadrant-wise count rates Data is divided into 100 sec bins |
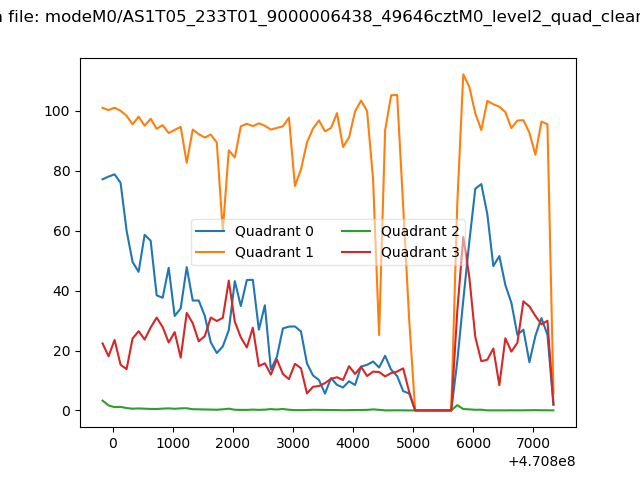 |
|
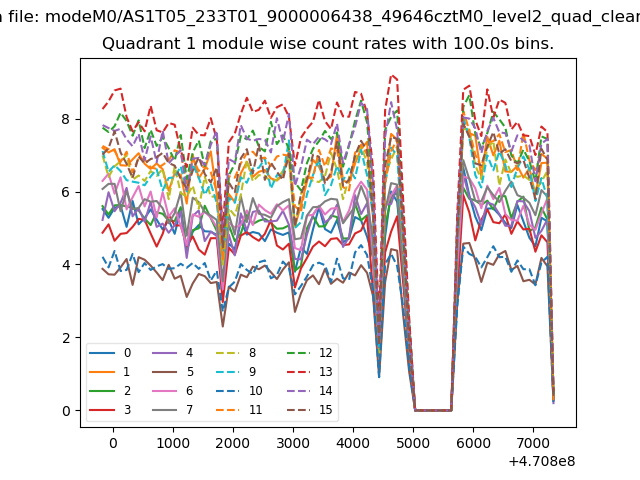
| Module-wise count rates for Quadrant A Data is divided into 100 sec bins |
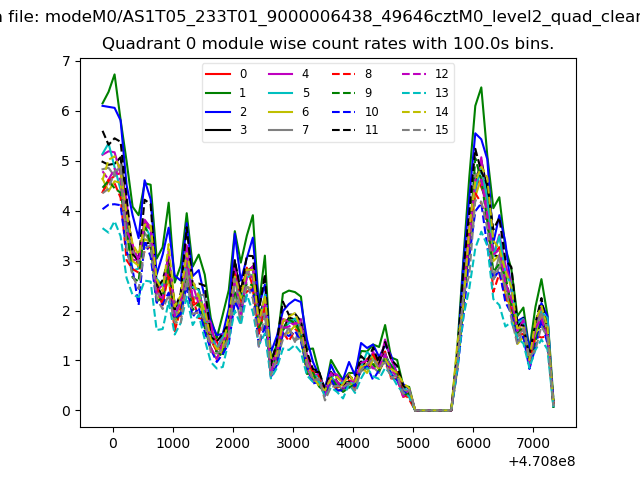 |
 |
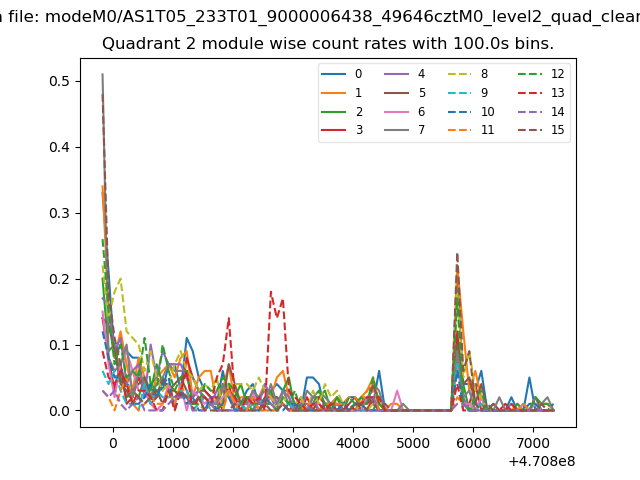
| Module-wise count rates for Quadrant B Data is divided into 100 sec bins |
 |
 |
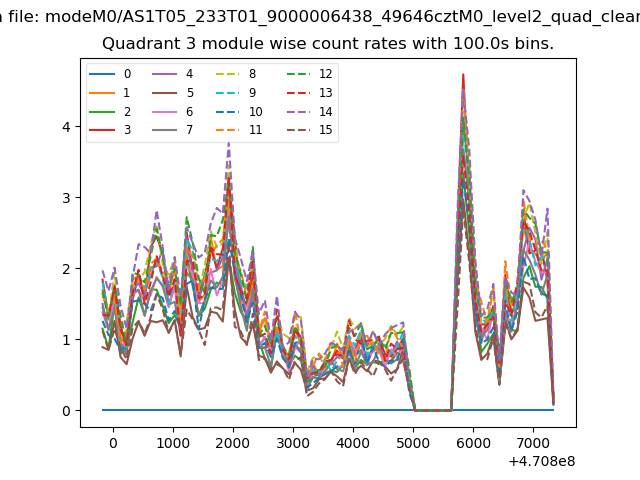
| Module-wise count rates for Quadrant C Data is divided into 100 sec bins |
 |
 |
| Module-wise count rates for Quadrant D Data is divided into 100 sec bins |
 |
 |
| Parameter | Plot |
|---|---|
| CZT HV Monitor | 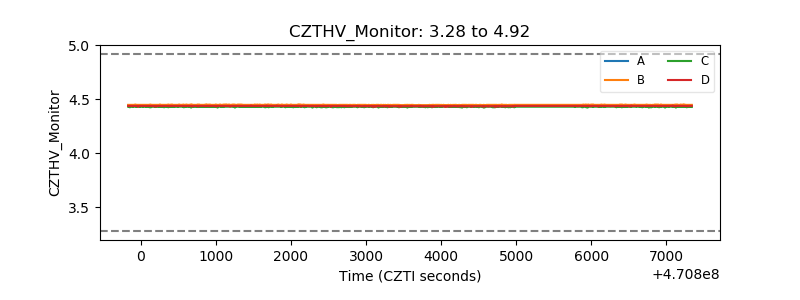 |
| D_VDD | 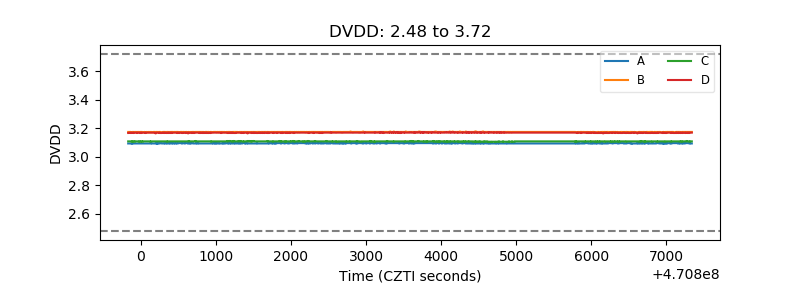 |
| Temperature 1 | 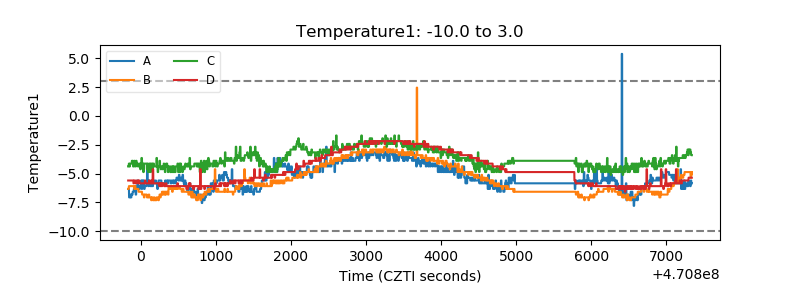 |
| Veto HV Monitor | 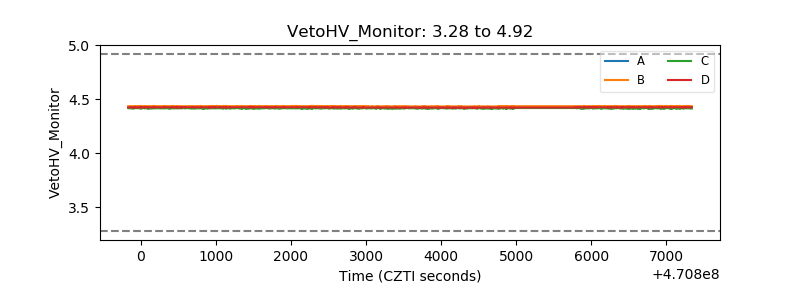 |
| Veto LLD | 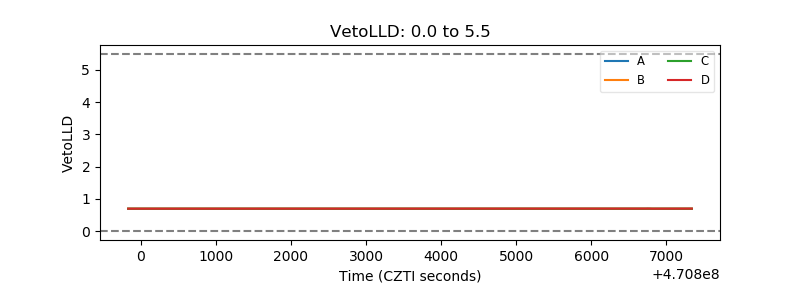 |
| Alpha Counter | 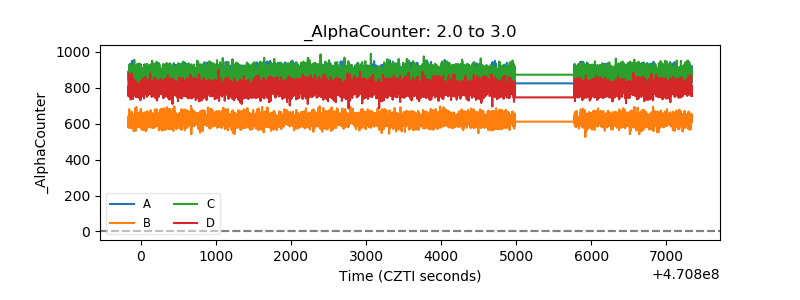 |
| _CPM_Rate | 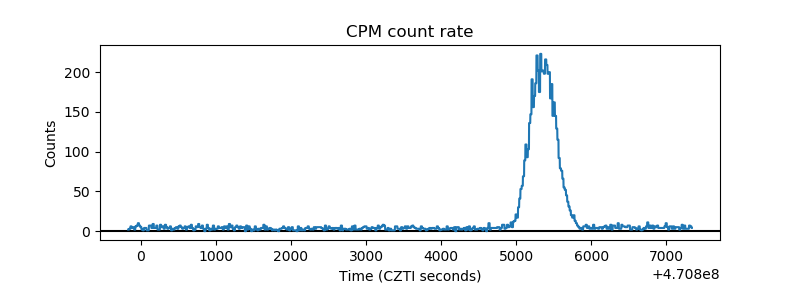 |
| CZT Counter | 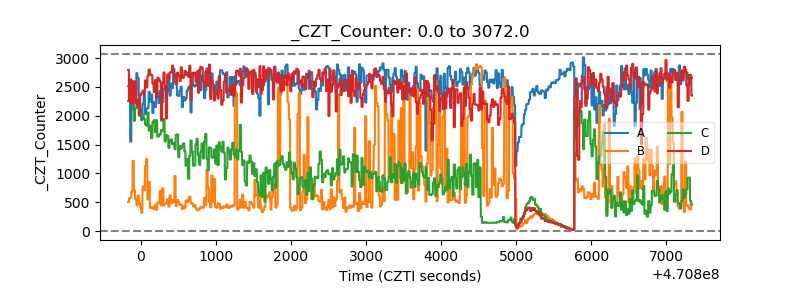 |
| +2.5 Volts monitor | 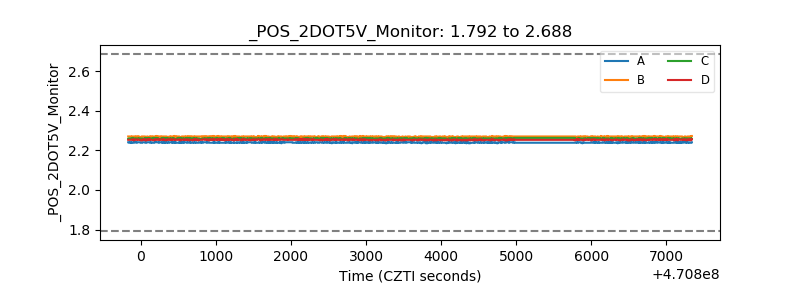 |
| +5 Volts monitor | 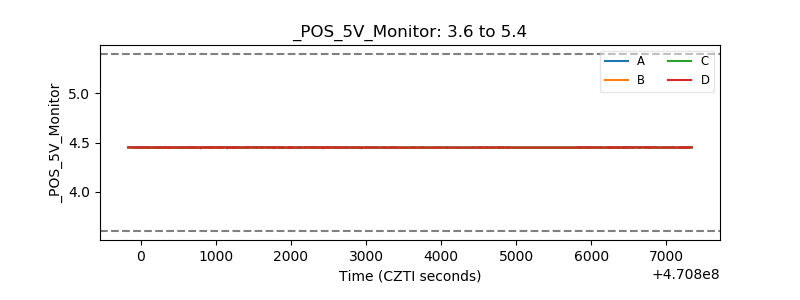 |
| _ROLL_ROT | 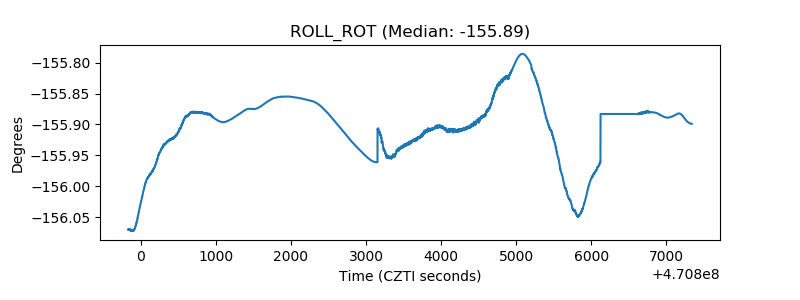 |
| _Roll_DEC | 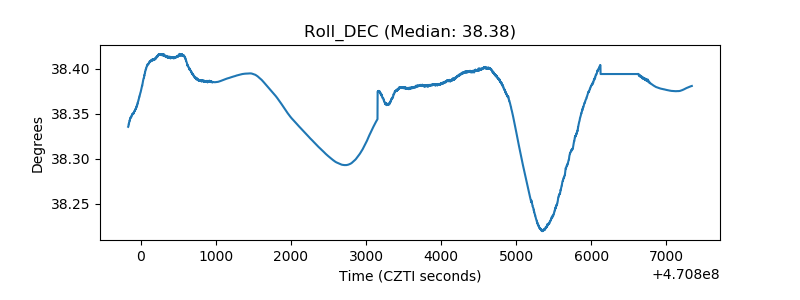 |
| _Roll_RA | 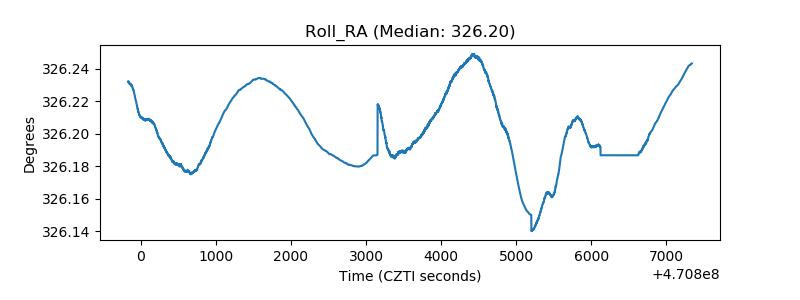 |
| Veto Counter | 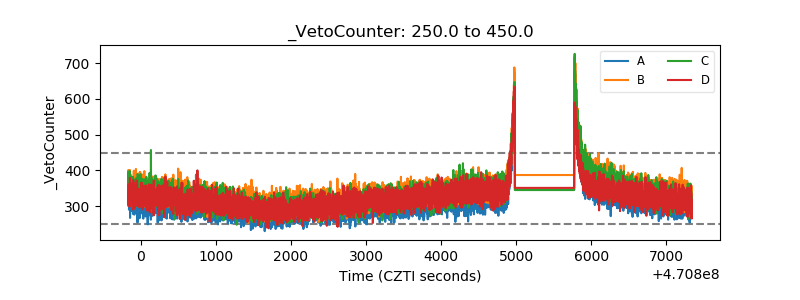 |