| Param | Original file | Final file |
|---|---|---|
| Filename | modeM0/AS1T05_233T01_9000006438_49647cztM0_level2.fits | modeM0/AS1T05_233T01_9000006438_49647cztM0_level2_quad_clean.evt |
| Size (bytes) | 1,102,559,040 | 32,541,120 |
| Size | 1.0 GB | 31.0 MB |
| Events in quadrant A | 15,109,507 | 937 |
| Events in quadrant B | 4,073,410 | 570,851 |
| Events in quadrant C | 6,757,218 | 352 |
| Events in quadrant D | 14,418,406 | 3,635 |
| Mode M9 | |||
|---|---|---|---|
| Quadrant | BADHDUFLAG | Total packets | Discarded packets |
| A | 0 | 10 | 0 |
| B | 0 | 10 | 0 |
| C | 0 | 10 | 0 |
| D | 0 | 10 | 0 |
| Mode SS | |||
|---|---|---|---|
| Quadrant | BADHDUFLAG | Total packets | Discarded packets |
| A | 0 | 118 | 0 |
| B | 0 | 118 | 0 |
| C | 0 | 118 | 0 |
| D | 0 | 118 | 0 |
| Mode M0 | |||
|---|---|---|---|
| Quadrant | BADHDUFLAG | Total packets | Discarded packets |
| A | 0 | 48961 | 7 |
| B | 0 | 16314 | 1 |
| C | 0 | 24254 | 1 |
| D | 0 | 46840 | 1 |
| Quadrant | Total seconds | Saturated seconds | Saturation percentage |
|---|---|---|---|
| A | 5858 | 5852 | 99.897576% |
| B | 5858 | 376 | 6.418573% |
| C | 5859 | 5855 | 99.931729% |
| D | 5859 | 5833 | 99.556238% |
Noise dominated data is calculated using 1-second bins in cleaned event files. If a bin has >2000 counts, and if more than 50% of those come from <1% of pixels, then it is considered to be noise-dominated and hence unusable.
| Quadrant | # 1 sec bins | Bins with >0 counts | Bins with >2000 counts | High rate bins dominated by noise | Noise dominated (total time) | Noise dominated (detector-on time) | Marked lightcurve |
|---|---|---|---|---|---|---|---|
| A | 6827 | 5857 | 5697 | 5697 | 83.45% | 97.27% | 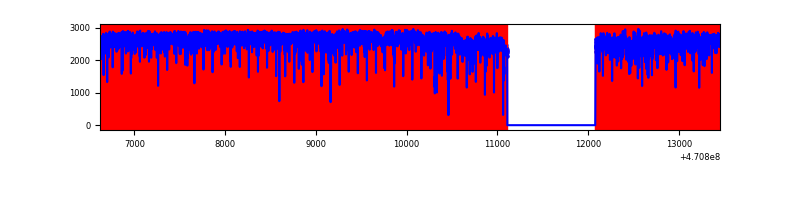 |
| B | 6828 | 5858 | 242 | 242 | 3.54% | 4.13% | 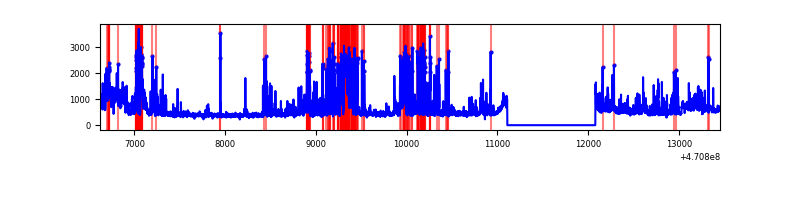 |
| C | 6828 | 5858 | 695 | 695 | 10.18% | 11.86% | 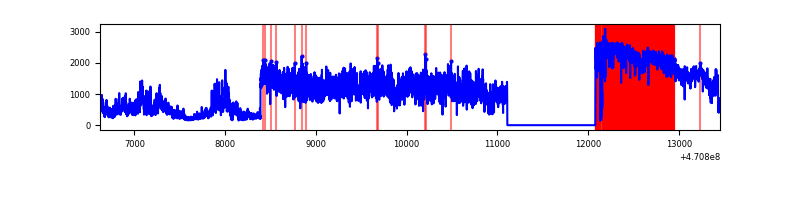 |
| D | 6828 | 5858 | 5525 | 5525 | 80.92% | 94.32% | 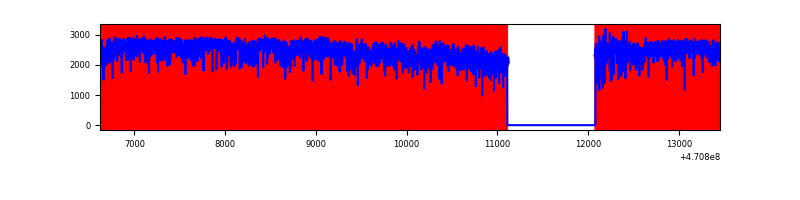 |
Top three noisy pixels from each quadrant. If the there are fewer than three noisy pixels in the level2.evt file, extra rows are filled as -1
| Pixel properties | Quadrant properties | ||||||
|---|---|---|---|---|---|---|---|
| Quadrant | DetID | PixID | Counts | Sigma | Mean | Median | Sigma |
| A | 0 | 99 | 6198221 | 103115.99 | 179 | 172 | 60.1 |
| A | 10 | 83 | 2826235 | 47016.78 | 179 | 172 | 60.1 |
| A | 12 | 50 | 1167960 | 19428.31 | 179 | 172 | 60.1 |
| B | 4 | 206 | 739664 | 5600.79 | 611 | 591 | 132.0 |
| B | 5 | 172 | 221719 | 1675.74 | 611 | 591 | 132.0 |
| B | 7 | 0 | 112738 | 849.86 | 611 | 591 | 132.0 |
| C | 15 | 180 | 1802379 | 91432.12 | 32 | 30 | 19.7 |
| C | 15 | 190 | 838124 | 42516.02 | 32 | 30 | 19.7 |
| C | 15 | 163 | 645121 | 32725.09 | 32 | 30 | 19.7 |
| D | 15 | 40 | 3243155 | 41261.67 | 163 | 152 | 78.6 |
| D | 7 | 45 | 3024804 | 38483.53 | 163 | 152 | 78.6 |
| D | 7 | 60 | 1712811 | 21790.66 | 163 | 152 | 78.6 |
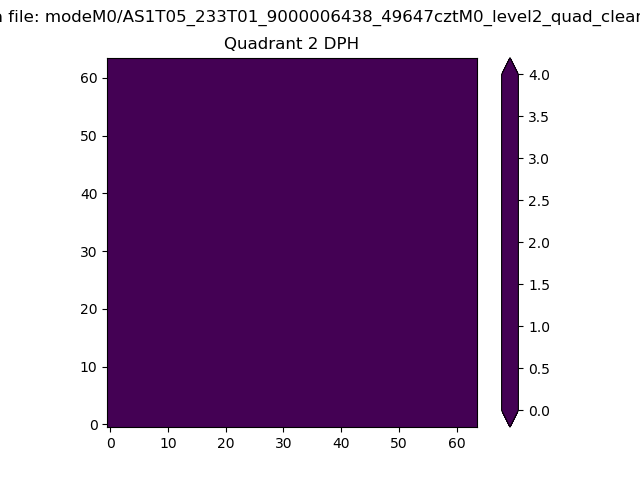
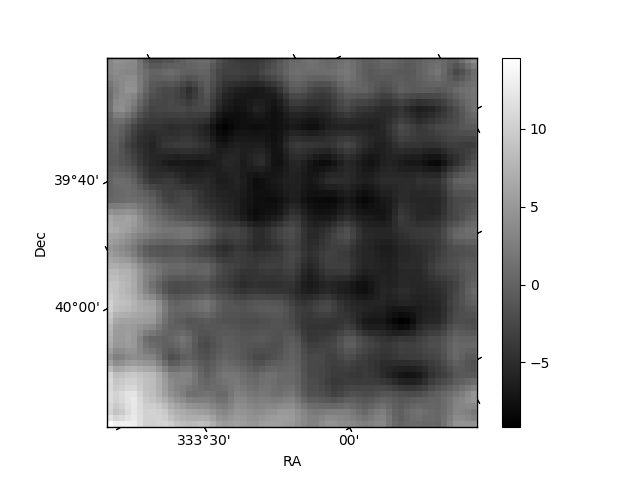
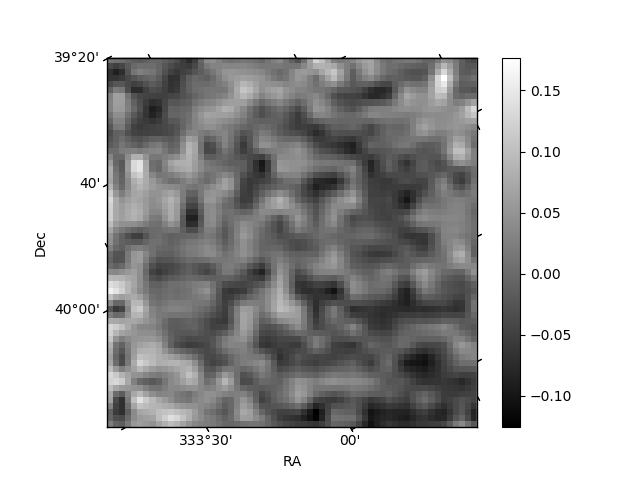
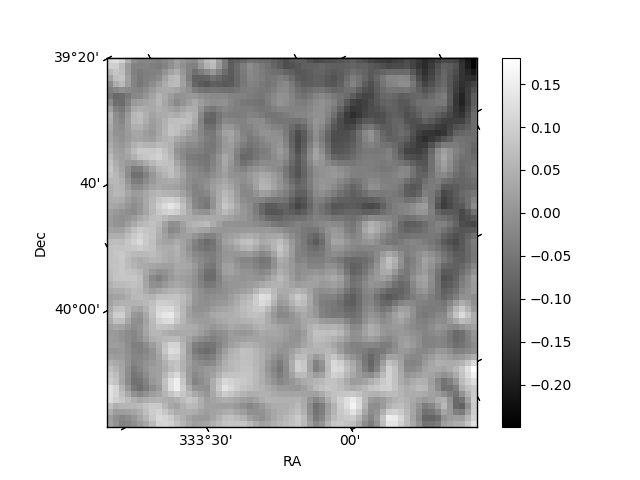
Histogram calculated using DETX and DETY for each event in the final _common_clean file
| Quadrant A | 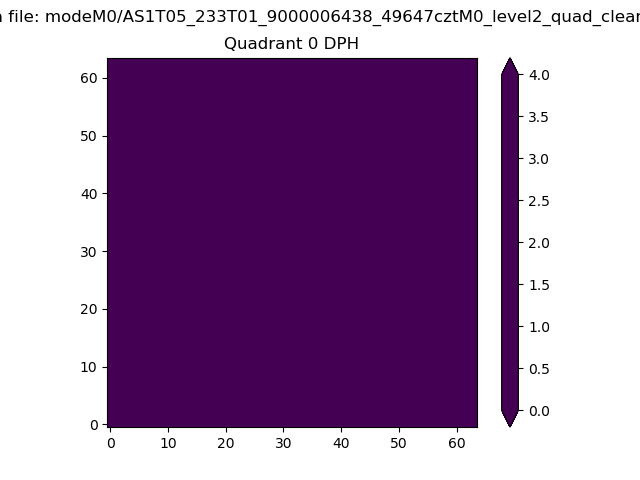 |
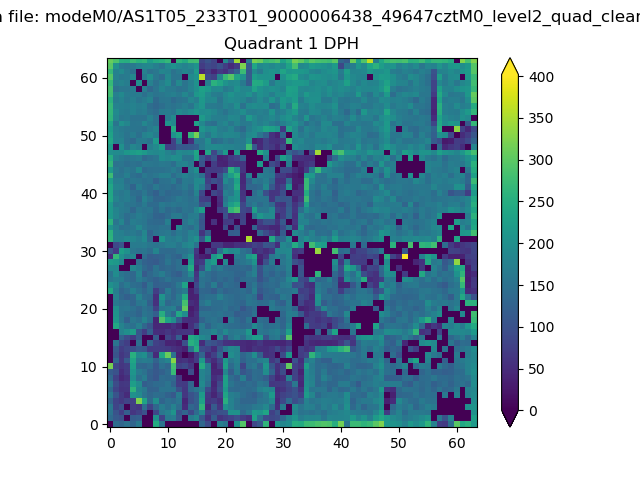 |
Quadrant B |
|---|---|---|---|
| Quadrant D | 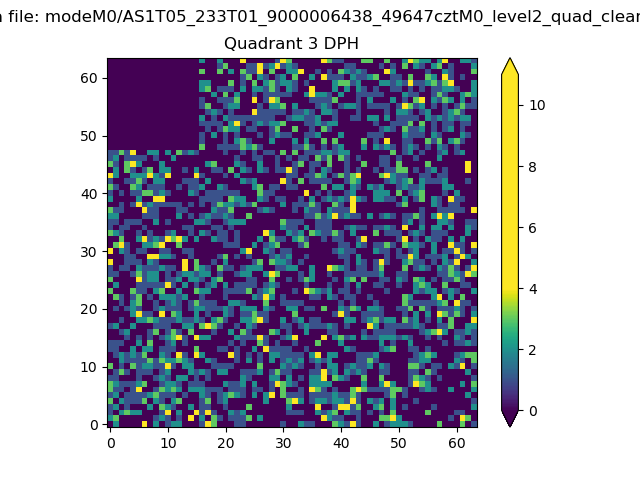 |
 |
Quadrant C |
| Plot type | Count rate plots | Images |
|---|---|---|
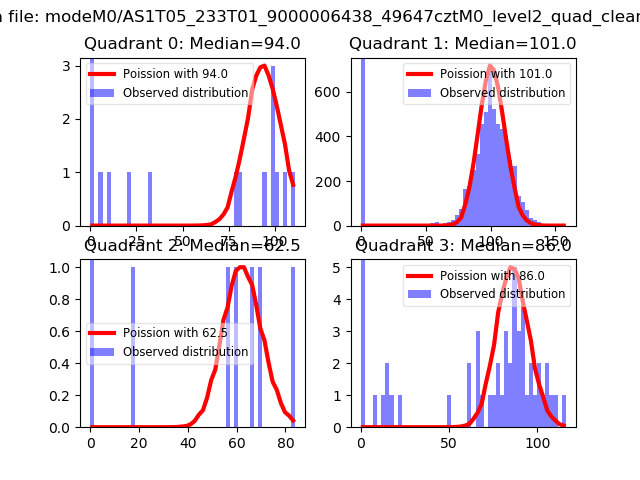
| Comparison with Poisson distribution Blue bars denote a histogram of data divided into 1 sec bins. Red curve is a Poisson curve with rate = median count rate of data. |
 |
 |
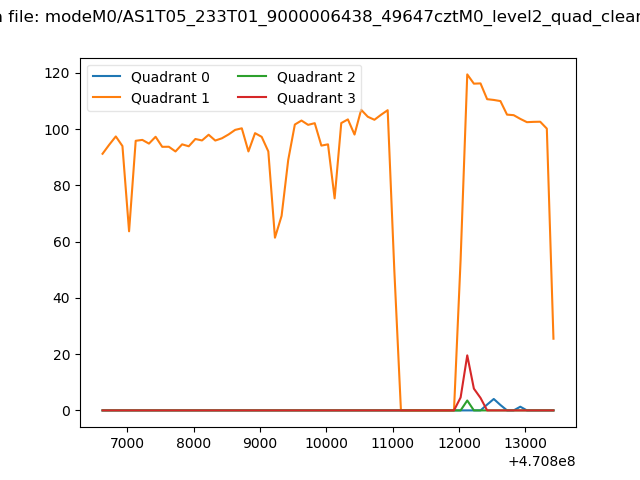
| Quadrant-wise count rates Data is divided into 100 sec bins |
 |
|
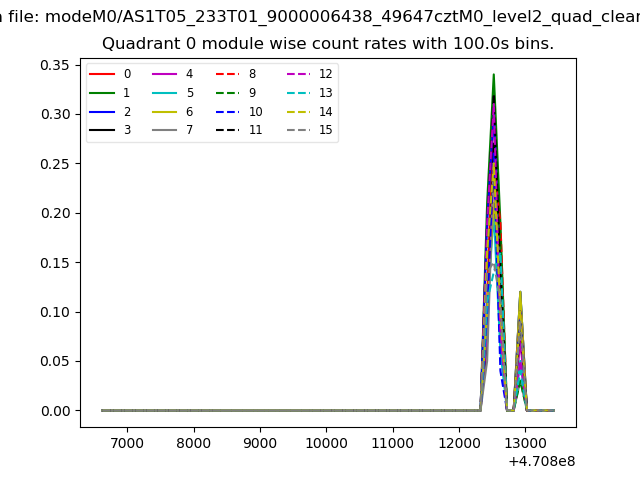
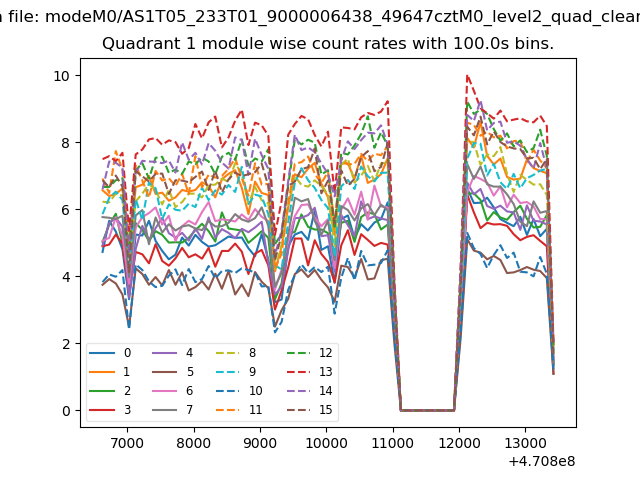
| Module-wise count rates for Quadrant A Data is divided into 100 sec bins |
 |
 |
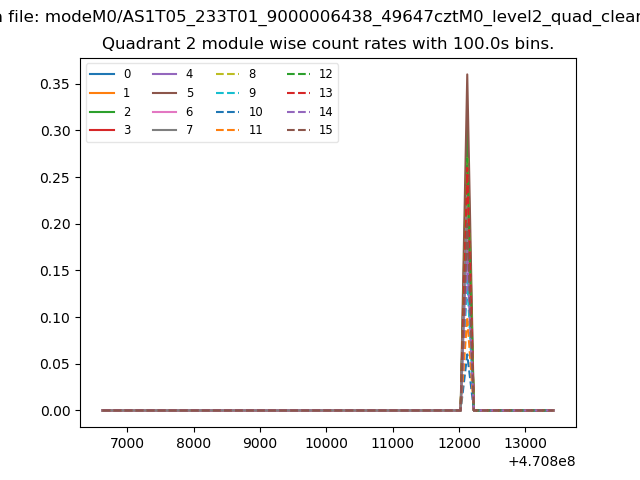
| Module-wise count rates for Quadrant B Data is divided into 100 sec bins |
 |
 |
| Module-wise count rates for Quadrant C Data is divided into 100 sec bins |
 |
 |
| Module-wise count rates for Quadrant D Data is divided into 100 sec bins |
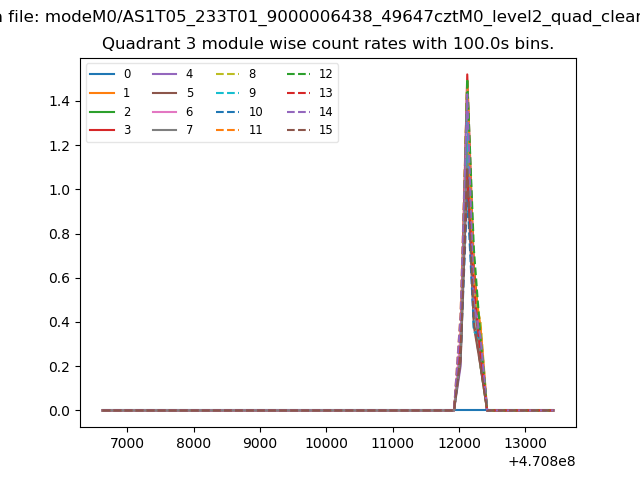 |
 |
| Parameter | Plot |
|---|---|
| CZT HV Monitor | 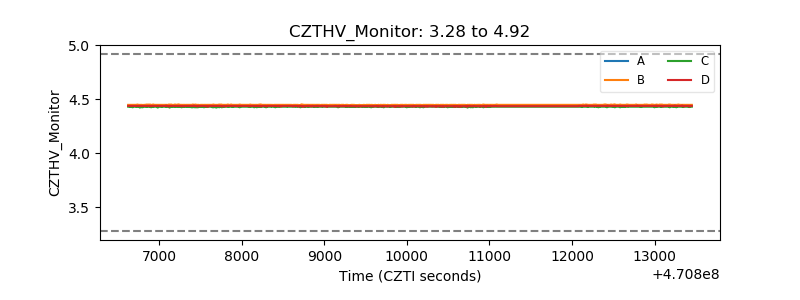 |
| D_VDD | 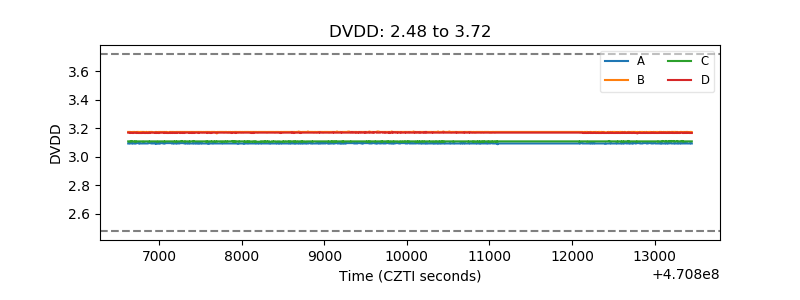 |
| Temperature 1 | 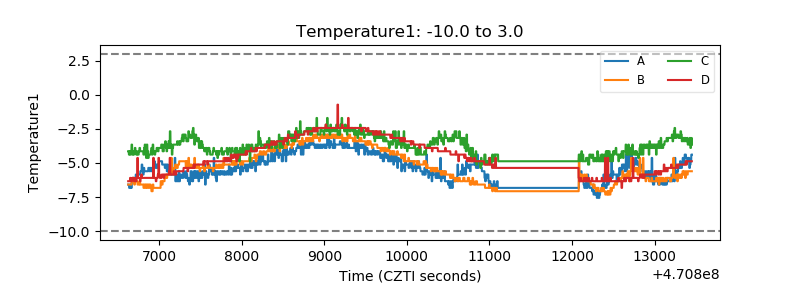 |
| Veto HV Monitor | 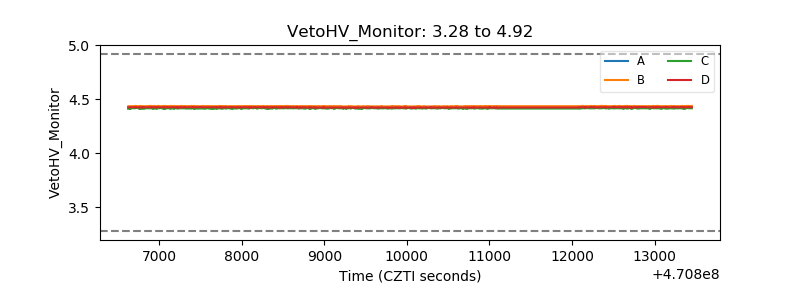 |
| Veto LLD | 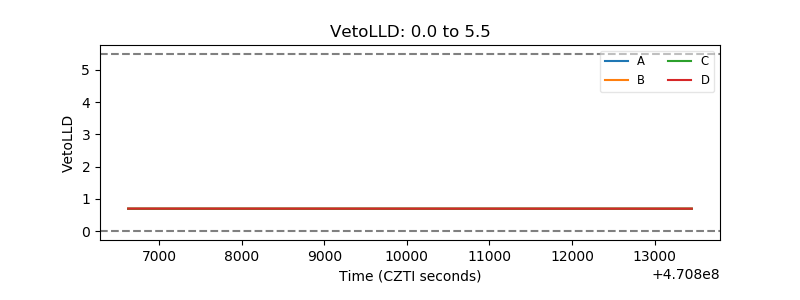 |
| Alpha Counter | 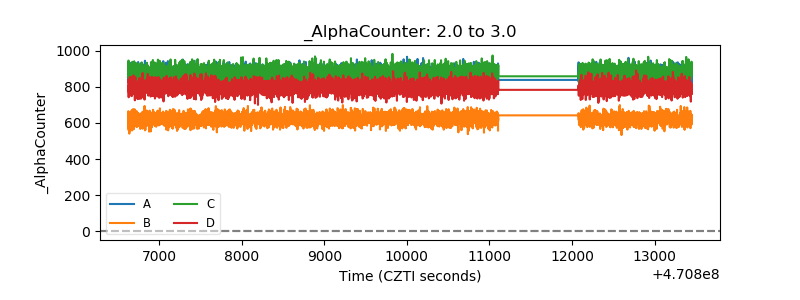 |
| _CPM_Rate | 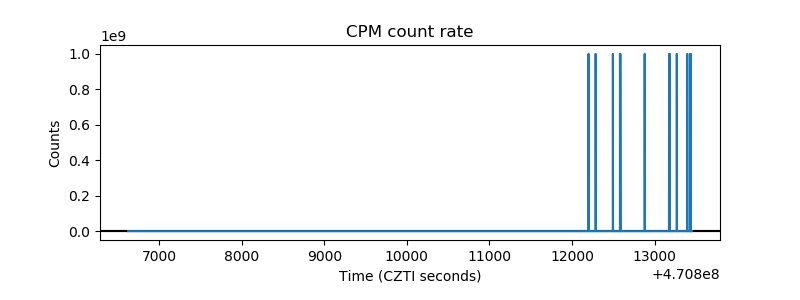 |
| CZT Counter | 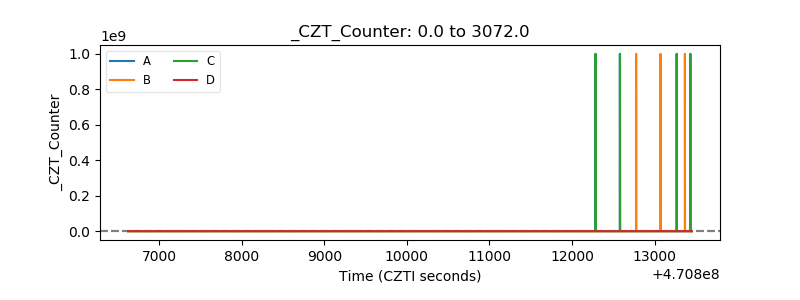 |
| +2.5 Volts monitor | 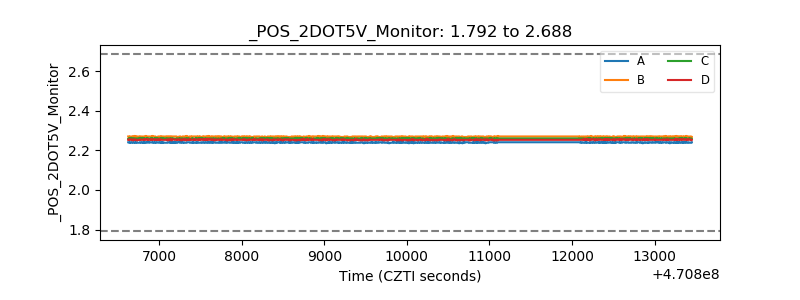 |
| +5 Volts monitor | 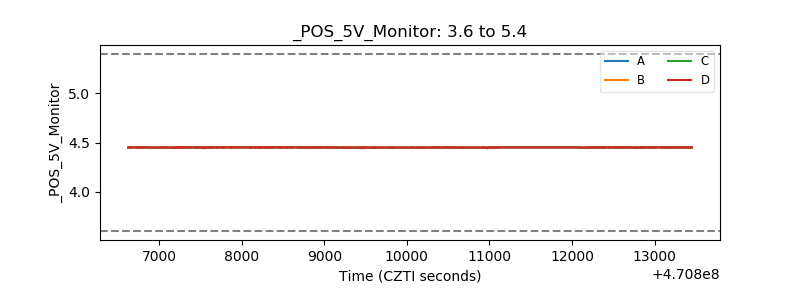 |
| _ROLL_ROT | 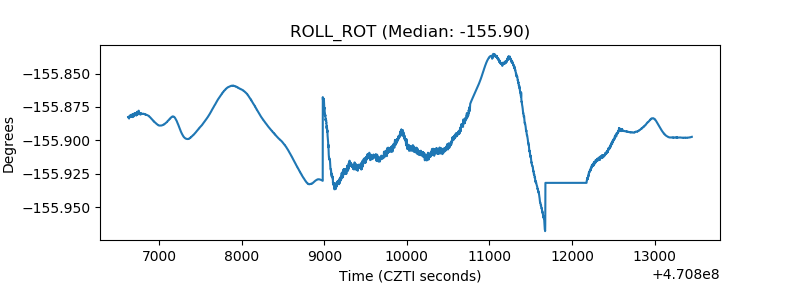 |
| _Roll_DEC | 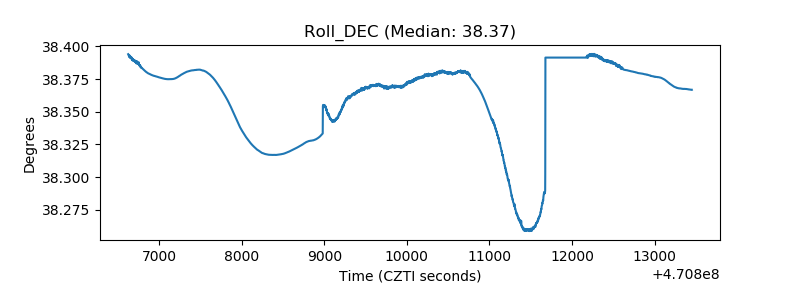 |
| _Roll_RA | 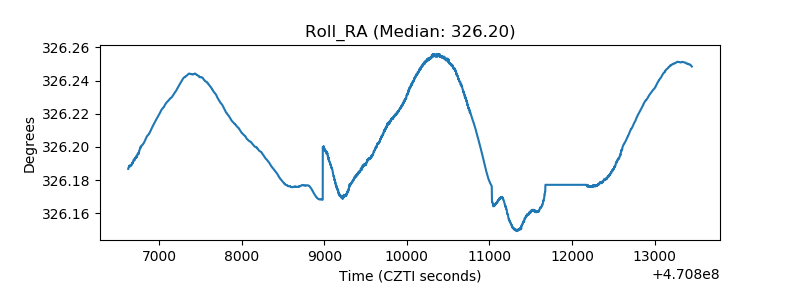 |
| Veto Counter | 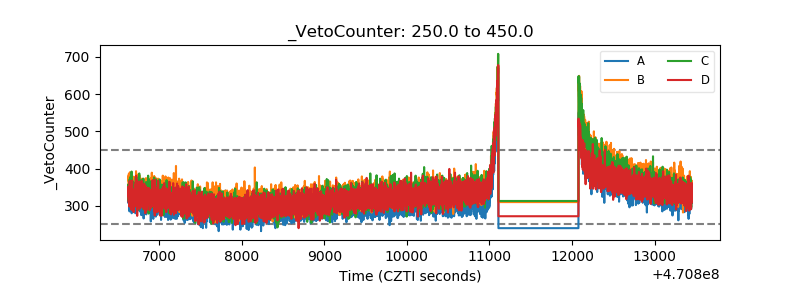 |