| Param | Original file | Final file |
|---|---|---|
| Filename | modeM0/AS1T05_233T01_9000006438_49649cztM0_level2.fits | modeM0/AS1T05_233T01_9000006438_49649cztM0_level2_quad_clean.evt |
| Size (bytes) | 1,269,383,040 | 37,745,280 |
| Size | 1.2 GB | 36.0 MB |
| Events in quadrant A | 16,754,269 | 7,486 |
| Events in quadrant B | 4,682,755 | 662,061 |
| Events in quadrant C | 8,820,158 | 8,013 |
| Events in quadrant D | 16,225,943 | 10,094 |
| Mode M9 | |||
|---|---|---|---|
| Quadrant | BADHDUFLAG | Total packets | Discarded packets |
| A | 0 | 11 | 0 |
| B | 0 | 11 | 0 |
| C | 0 | 11 | 0 |
| D | 0 | 11 | 0 |
| Mode SS | |||
|---|---|---|---|
| Quadrant | BADHDUFLAG | Total packets | Discarded packets |
| A | 0 | 130 | 0 |
| B | 0 | 130 | 0 |
| C | 0 | 130 | 0 |
| D | 0 | 130 | 0 |
| Mode M0 | |||
|---|---|---|---|
| Quadrant | BADHDUFLAG | Total packets | Discarded packets |
| A | 0 | 54334 | 1 |
| B | 0 | 18555 | 1 |
| C | 0 | 30810 | 1 |
| D | 0 | 52611 | 1 |
| Quadrant | Total seconds | Saturated seconds | Saturation percentage |
|---|---|---|---|
| A | 6531 | 6486 | 99.310978% |
| B | 6531 | 413 | 6.323687% |
| C | 6531 | 6478 | 99.188486% |
| D | 6531 | 6452 | 98.790384% |
Noise dominated data is calculated using 1-second bins in cleaned event files. If a bin has >2000 counts, and if more than 50% of those come from <1% of pixels, then it is considered to be noise-dominated and hence unusable.
| Quadrant | # 1 sec bins | Bins with >0 counts | Bins with >2000 counts | High rate bins dominated by noise | Noise dominated (total time) | Noise dominated (detector-on time) | Marked lightcurve |
|---|---|---|---|---|---|---|---|
| A | 7565 | 6530 | 6317 | 6317 | 83.50% | 96.74% | 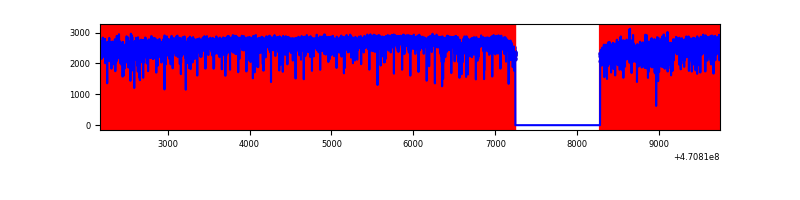 |
| B | 7566 | 6531 | 256 | 256 | 3.38% | 3.92% | 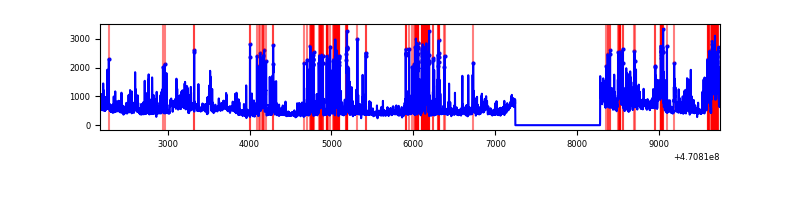 |
| C | 7565 | 6530 | 1244 | 1244 | 16.44% | 19.05% | 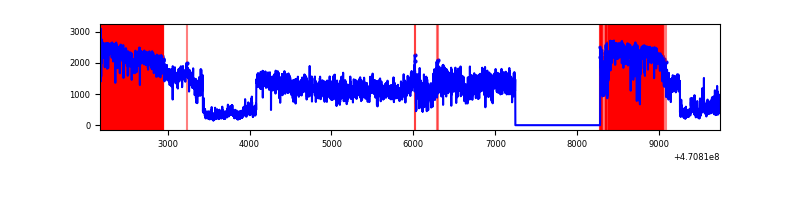 |
| D | 7565 | 6530 | 6207 | 6207 | 82.05% | 95.05% | 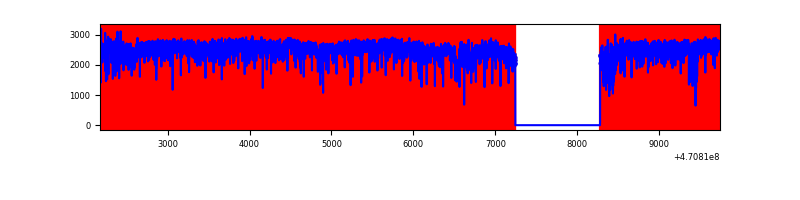 |
Top three noisy pixels from each quadrant. If the there are fewer than three noisy pixels in the level2.evt file, extra rows are filled as -1
| Pixel properties | Quadrant properties | ||||||
|---|---|---|---|---|---|---|---|
| Quadrant | DetID | PixID | Counts | Sigma | Mean | Median | Sigma |
| A | 0 | 99 | 6390592 | 69088.33 | 283 | 271 | 92.5 |
| A | 10 | 83 | 4256434 | 46015.09 | 283 | 271 | 92.5 |
| A | 0 | 98 | 991269 | 10714.08 | 283 | 271 | 92.5 |
| B | 4 | 206 | 681265 | 4552.88 | 701 | 679 | 149.5 |
| B | 1 | 238 | 313931 | 2095.54 | 701 | 679 | 149.5 |
| B | 5 | 173 | 243138 | 1621.96 | 701 | 679 | 149.5 |
| C | 15 | 180 | 3065881 | 117876.52 | 62 | 60 | 26.0 |
| C | 15 | 190 | 1167179 | 44874.09 | 62 | 60 | 26.0 |
| C | 15 | 163 | 809353 | 31116.18 | 62 | 60 | 26.0 |
| D | 7 | 45 | 3538152 | 40092.22 | 221 | 209 | 88.2 |
| D | 15 | 40 | 2611902 | 29595.89 | 221 | 209 | 88.2 |
| D | 7 | 60 | 2249601 | 25490.27 | 221 | 209 | 88.2 |
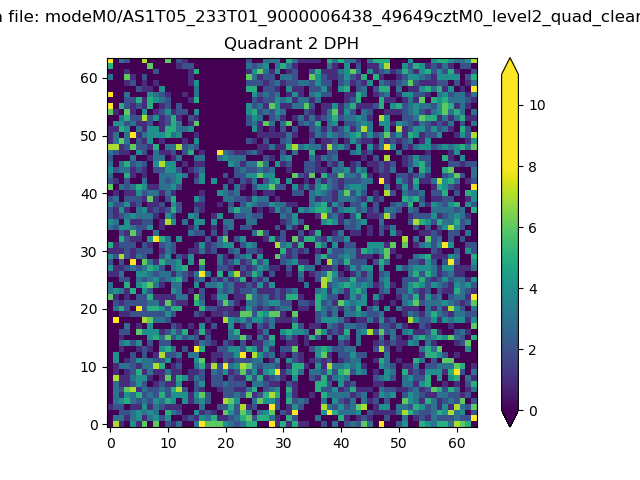
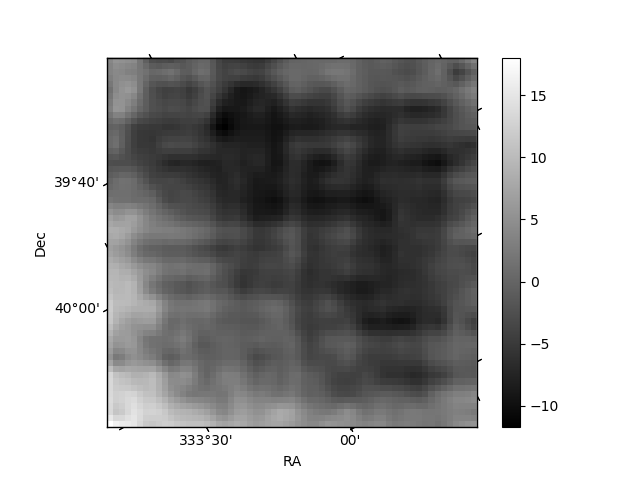
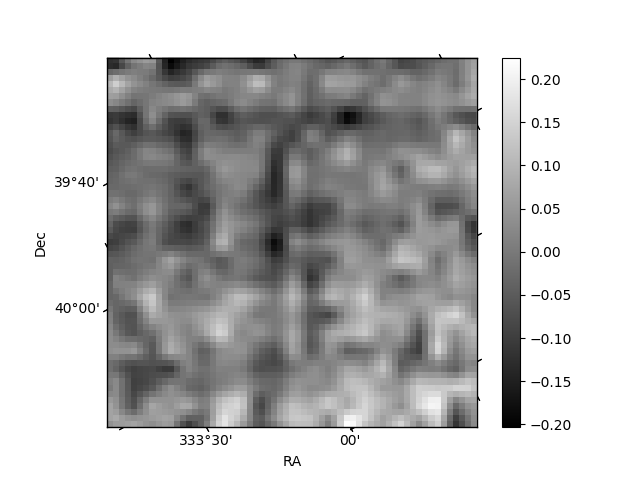
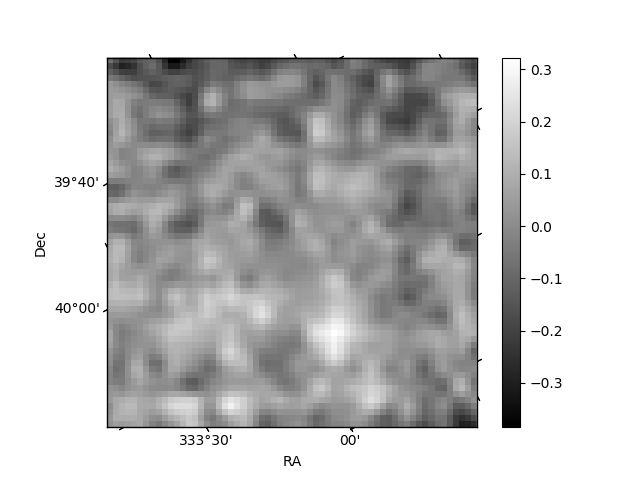
Histogram calculated using DETX and DETY for each event in the final _common_clean file
| Quadrant A | 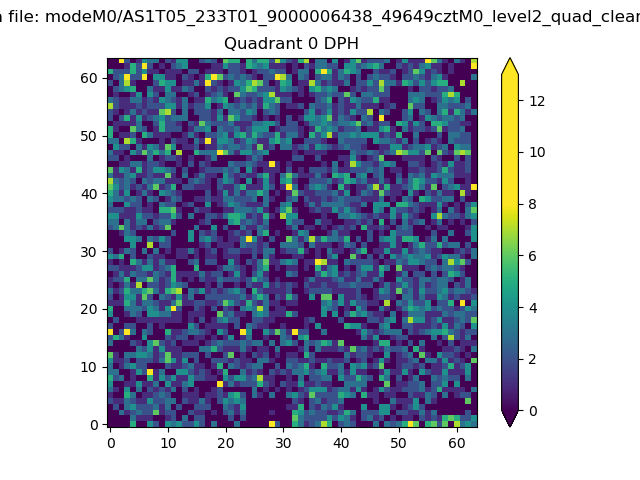 |
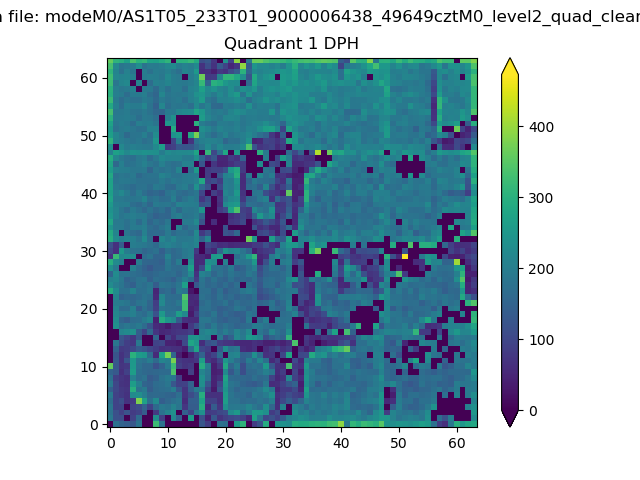 |
Quadrant B |
|---|---|---|---|
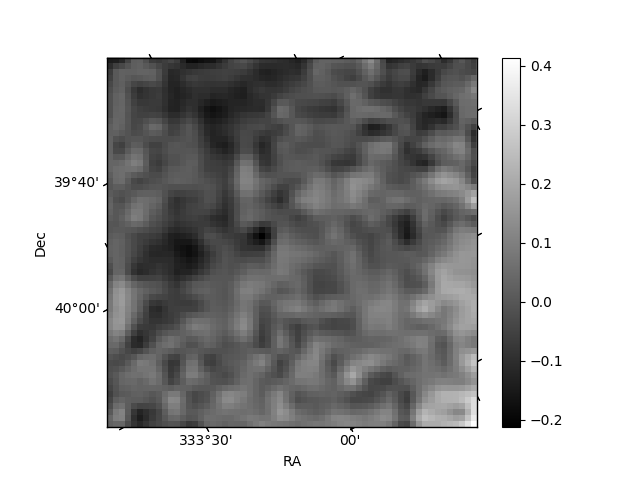
| Quadrant D | 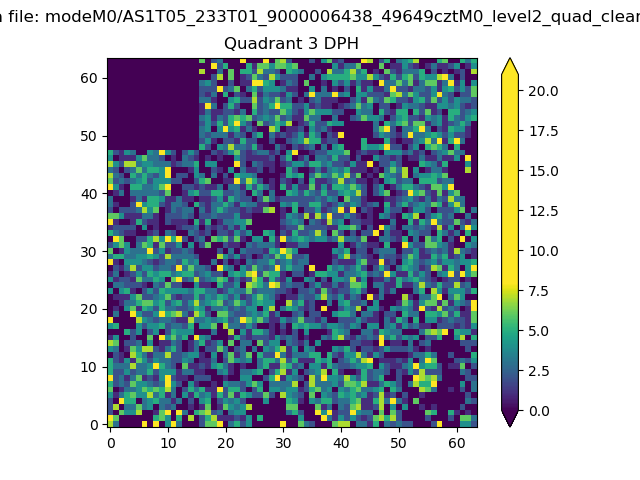 |
 |
Quadrant C |
| Plot type | Count rate plots | Images |
|---|---|---|
| Comparison with Poisson distribution Blue bars denote a histogram of data divided into 1 sec bins. Red curve is a Poisson curve with rate = median count rate of data. |
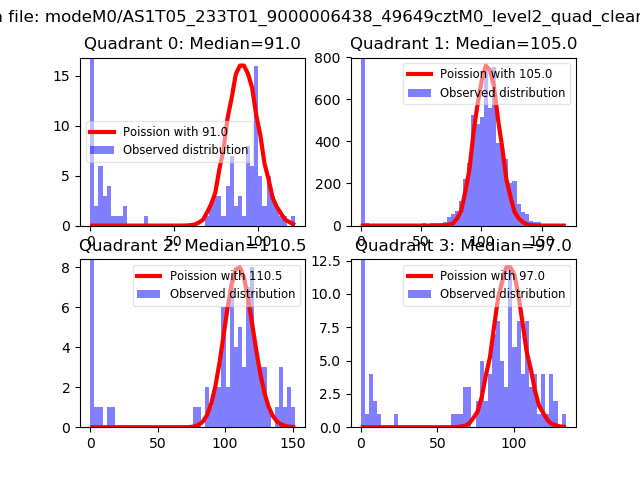 |
 |
| Quadrant-wise count rates Data is divided into 100 sec bins |
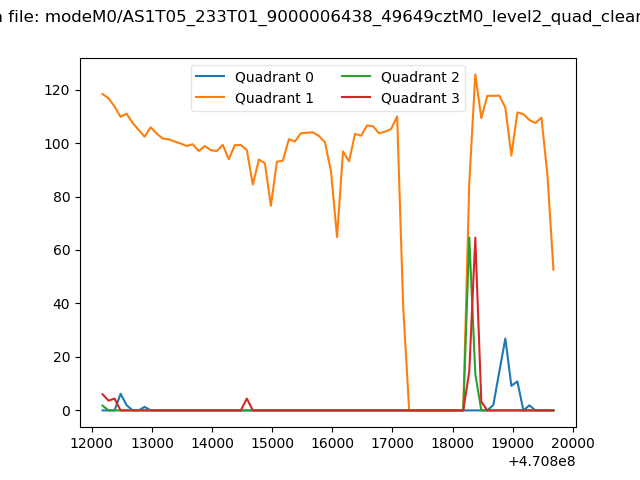 |
|
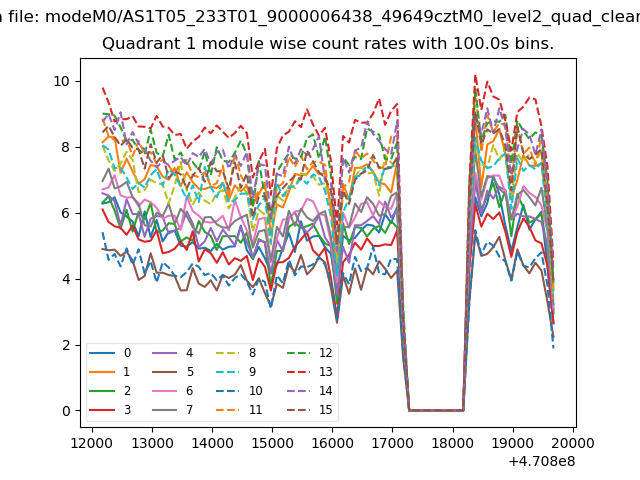
| Module-wise count rates for Quadrant A Data is divided into 100 sec bins |
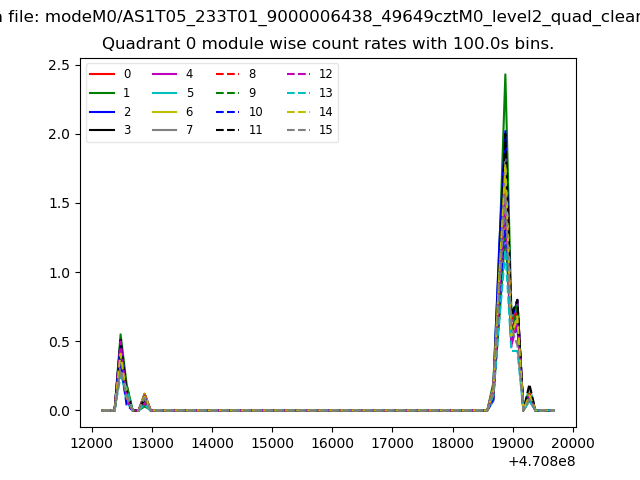 |
 |
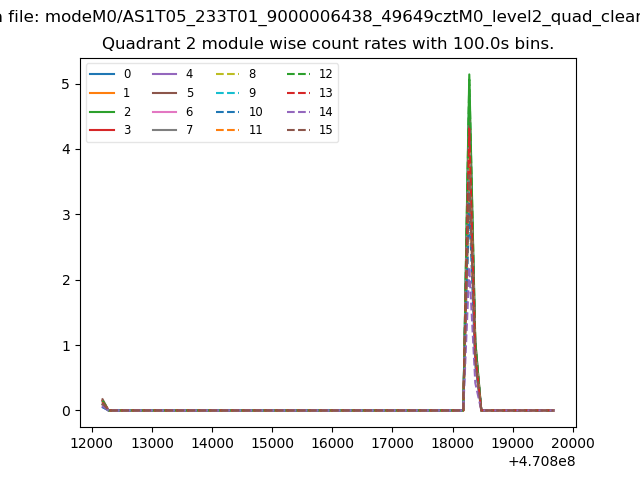
| Module-wise count rates for Quadrant B Data is divided into 100 sec bins |
 |
 |
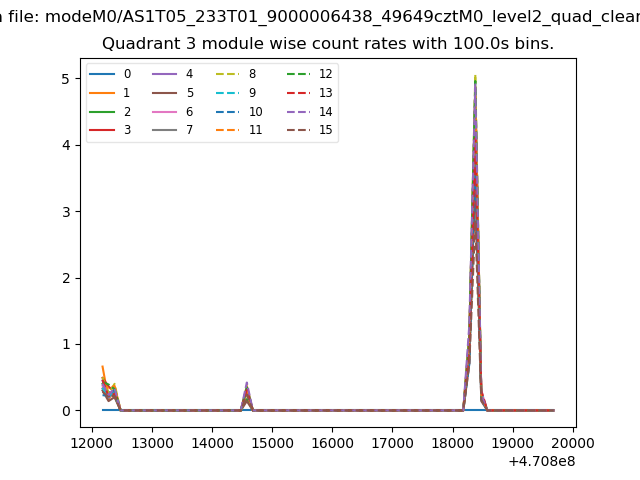
| Module-wise count rates for Quadrant C Data is divided into 100 sec bins |
 |
 |
| Module-wise count rates for Quadrant D Data is divided into 100 sec bins |
 |
 |
| Parameter | Plot |
|---|---|
| CZT HV Monitor | 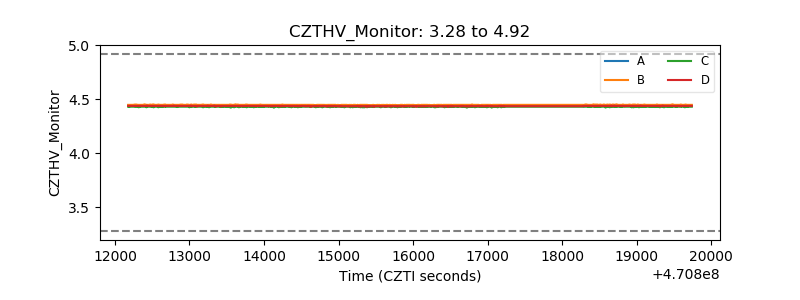 |
| D_VDD | 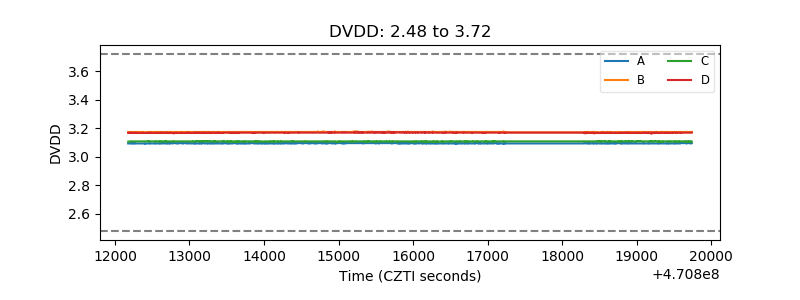 |
| Temperature 1 | 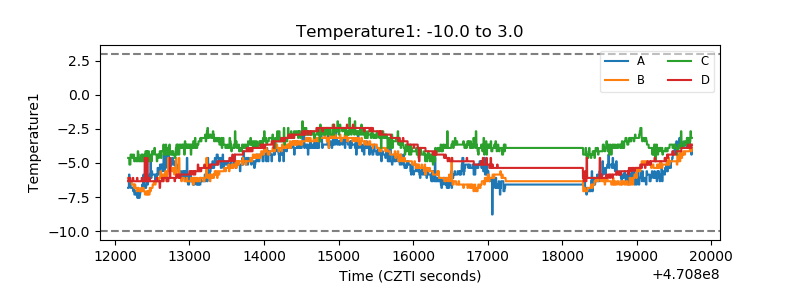 |
| Veto HV Monitor | 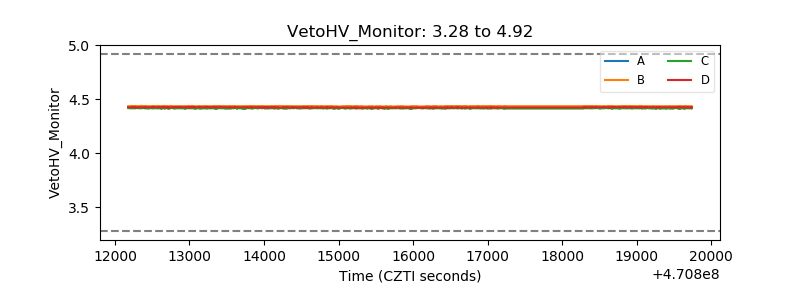 |
| Veto LLD | 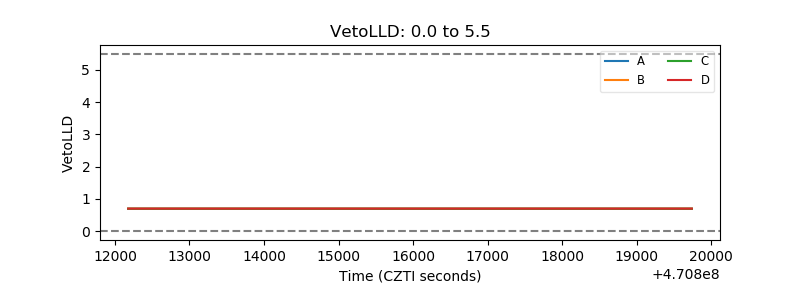 |
| Alpha Counter | 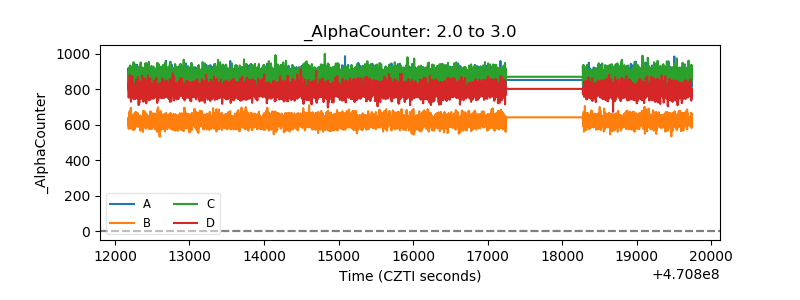 |
| _CPM_Rate | 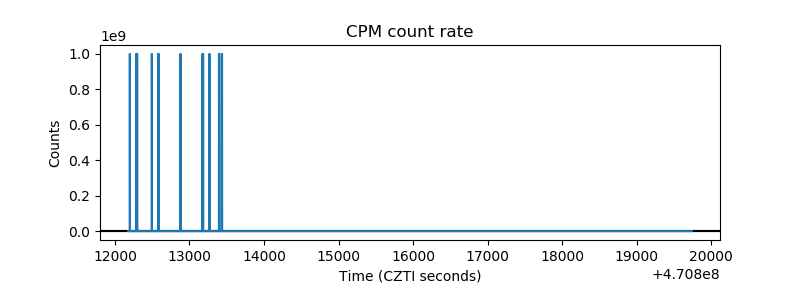 |
| CZT Counter | 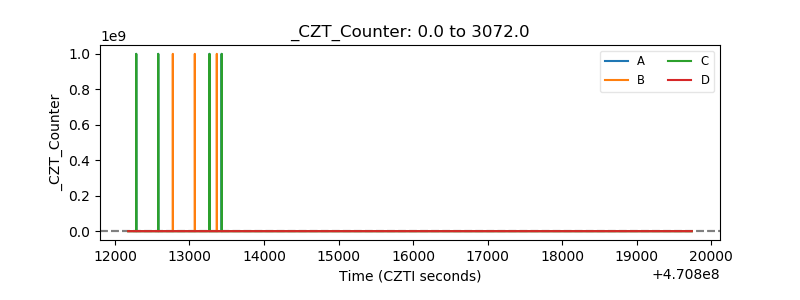 |
| +2.5 Volts monitor |  |
| +5 Volts monitor | 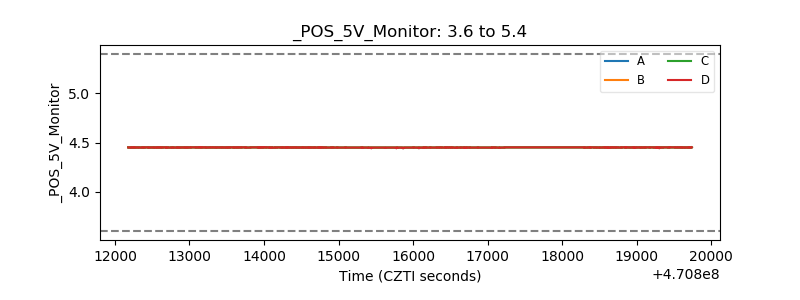 |
| _ROLL_ROT | 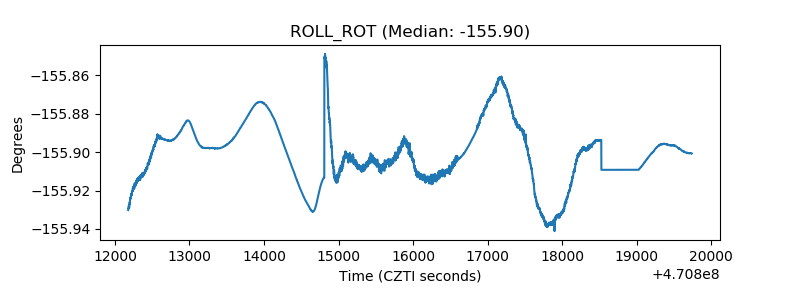 |
| _Roll_DEC | 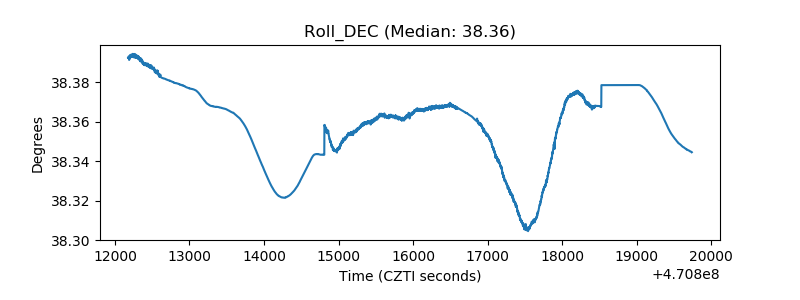 |
| _Roll_RA | 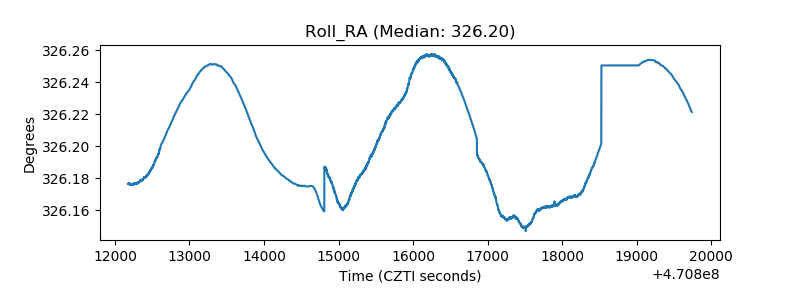 |
| Veto Counter | 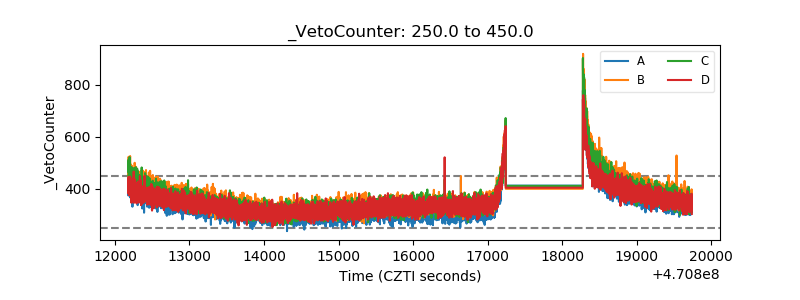 |