| Param | Original file | Final file |
|---|---|---|
| Filename | modeM0/AS1T05_233T01_9000006438_49650cztM0_level2.fits | modeM0/AS1T05_233T01_9000006438_49650cztM0_level2_quad_clean.evt |
| Size (bytes) | 1,129,207,680 | 33,819,840 |
| Size | 1.1 GB | 32.3 MB |
| Events in quadrant A | 14,673,945 | 13,378 |
| Events in quadrant B | 4,660,122 | 589,975 |
| Events in quadrant C | 7,747,514 | 8,004 |
| Events in quadrant D | 14,271,798 | 9,263 |
| Mode M9 | |||
|---|---|---|---|
| Quadrant | BADHDUFLAG | Total packets | Discarded packets |
| A | 0 | 11 | 0 |
| B | 0 | 11 | 0 |
| C | 0 | 11 | 0 |
| D | 0 | 11 | 0 |
| Mode SS | |||
|---|---|---|---|
| Quadrant | BADHDUFLAG | Total packets | Discarded packets |
| A | 0 | 118 | 0 |
| B | 0 | 118 | 0 |
| C | 0 | 118 | 0 |
| D | 0 | 118 | 0 |
| Mode M0 | |||
|---|---|---|---|
| Quadrant | BADHDUFLAG | Total packets | Discarded packets |
| A | 0 | 47540 | 1 |
| B | 0 | 17736 | 1 |
| C | 0 | 27099 | 1 |
| D | 0 | 46367 | 2 |
| Quadrant | Total seconds | Saturated seconds | Saturation percentage |
|---|---|---|---|
| A | 5763 | 5683 | 98.611834% |
| B | 5764 | 474 | 8.223456% |
| C | 5764 | 5709 | 99.045802% |
| D | 5763 | 5694 | 98.802707% |
Noise dominated data is calculated using 1-second bins in cleaned event files. If a bin has >2000 counts, and if more than 50% of those come from <1% of pixels, then it is considered to be noise-dominated and hence unusable.
| Quadrant | # 1 sec bins | Bins with >0 counts | Bins with >2000 counts | High rate bins dominated by noise | Noise dominated (total time) | Noise dominated (detector-on time) | Marked lightcurve |
|---|---|---|---|---|---|---|---|
| A | 6902 | 5762 | 5527 | 5527 | 80.08% | 95.92% | 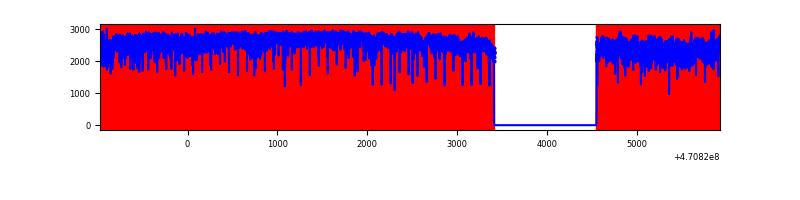 |
| B | 6904 | 5764 | 313 | 313 | 4.53% | 5.43% | 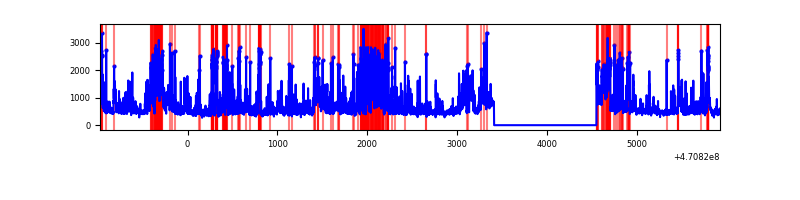 |
| C | 6903 | 5763 | 530 | 530 | 7.68% | 9.20% | 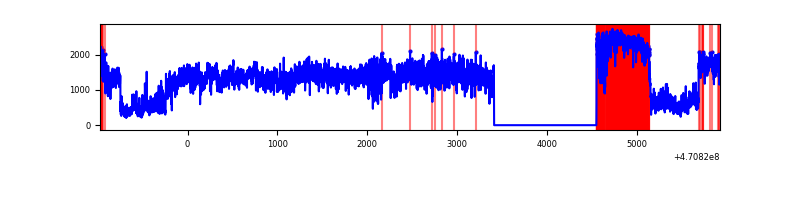 |
| D | 6902 | 5762 | 5417 | 5417 | 78.48% | 94.01% |  |
Top three noisy pixels from each quadrant. If the there are fewer than three noisy pixels in the level2.evt file, extra rows are filled as -1
| Pixel properties | Quadrant properties | ||||||
|---|---|---|---|---|---|---|---|
| Quadrant | DetID | PixID | Counts | Sigma | Mean | Median | Sigma |
| A | 0 | 99 | 4216893 | 56704.03 | 254 | 245 | 74.4 |
| A | 10 | 83 | 3728511 | 50136.44 | 254 | 245 | 74.4 |
| A | 0 | 98 | 1406689 | 18913.38 | 254 | 245 | 74.4 |
| B | 4 | 206 | 809904 | 6111.83 | 616 | 597 | 132.4 |
| B | 7 | 0 | 367103 | 2767.83 | 616 | 597 | 132.4 |
| B | 5 | 173 | 283075 | 2133.25 | 616 | 597 | 132.4 |
| C | 15 | 180 | 3055333 | 125076.24 | 50 | 48 | 24.4 |
| C | 15 | 163 | 838759 | 34334.87 | 50 | 48 | 24.4 |
| C | 15 | 190 | 666259 | 27273.12 | 50 | 48 | 24.4 |
| D | 15 | 40 | 3600945 | 58133.54 | 180 | 172 | 61.9 |
| D | 7 | 45 | 2904808 | 46894.59 | 180 | 172 | 61.9 |
| D | 7 | 60 | 1077450 | 17392.37 | 180 | 172 | 61.9 |
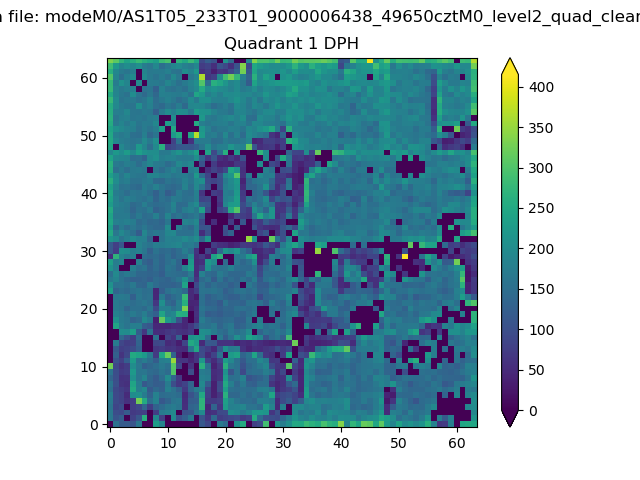
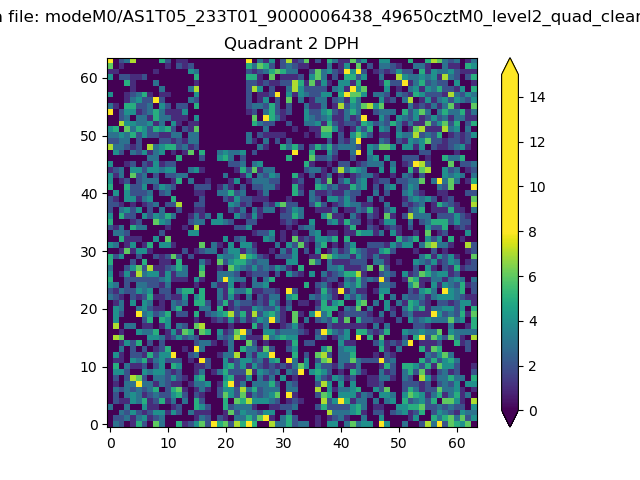
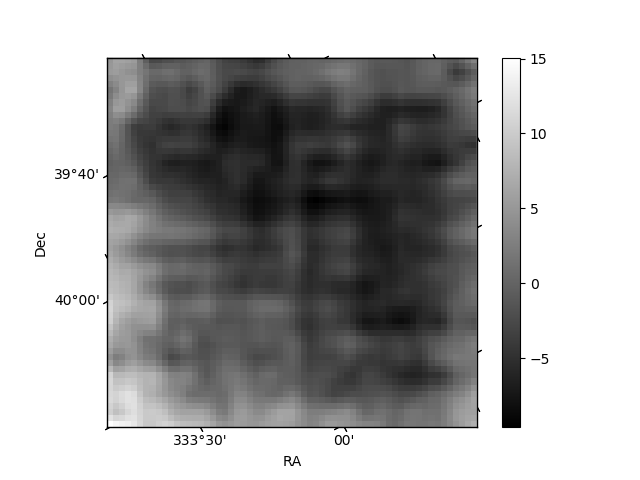
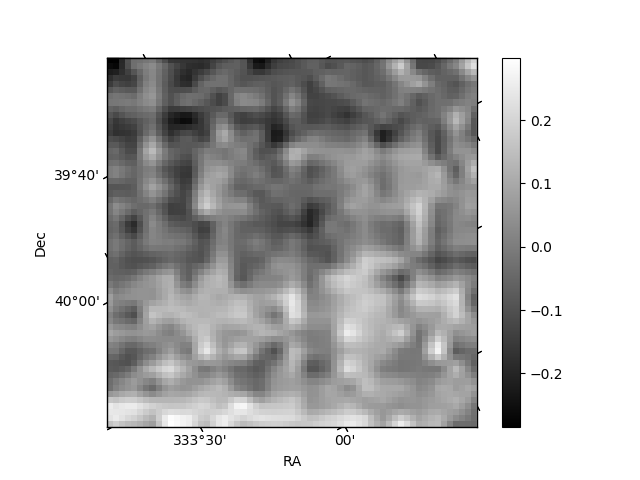
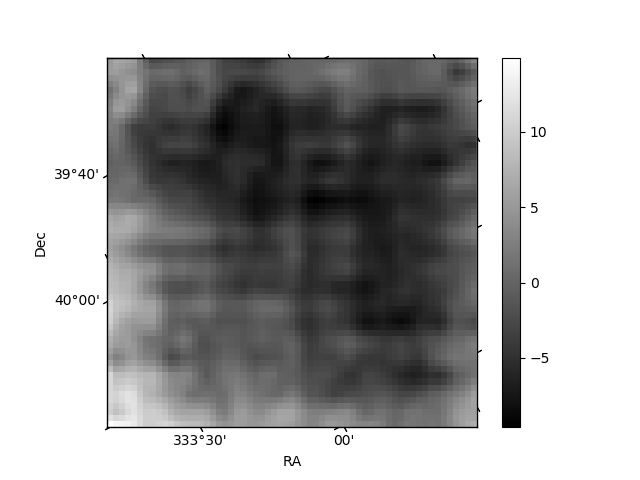
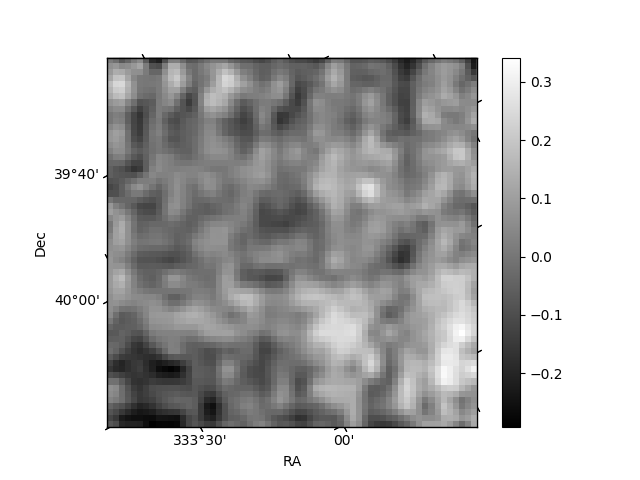
Histogram calculated using DETX and DETY for each event in the final _common_clean file
| Quadrant A | 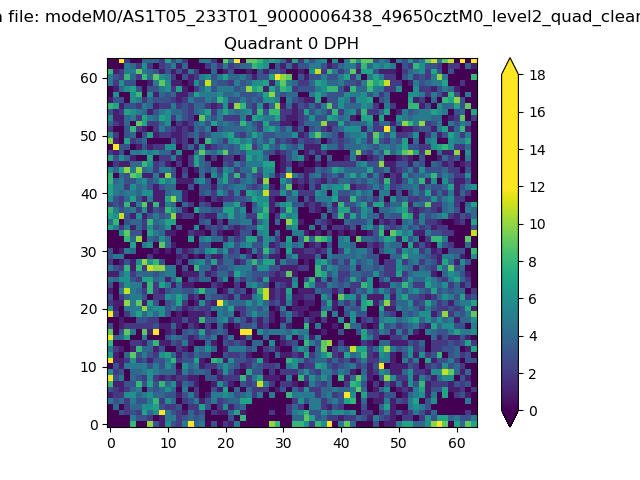 |
 |
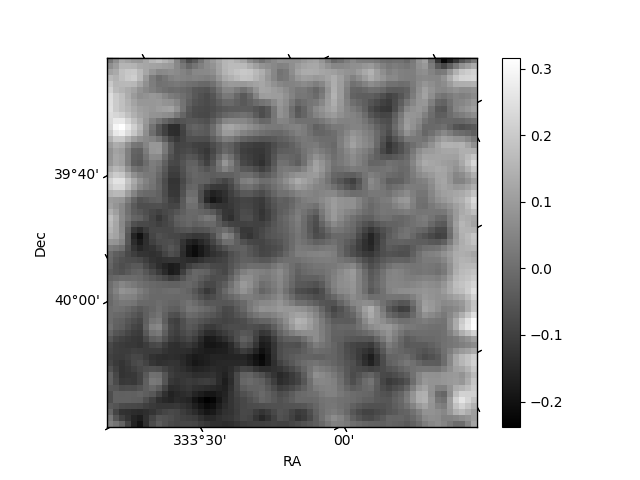
Quadrant B |
|---|---|---|---|
| Quadrant D | 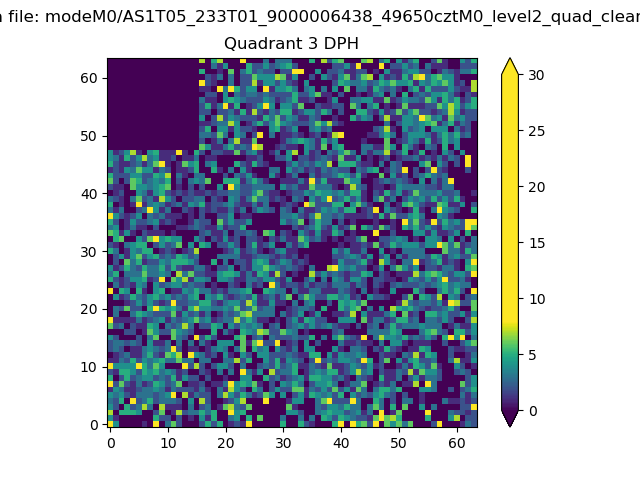 |
 |
Quadrant C |
| Plot type | Count rate plots | Images |
|---|---|---|
| Comparison with Poisson distribution Blue bars denote a histogram of data divided into 1 sec bins. Red curve is a Poisson curve with rate = median count rate of data. |
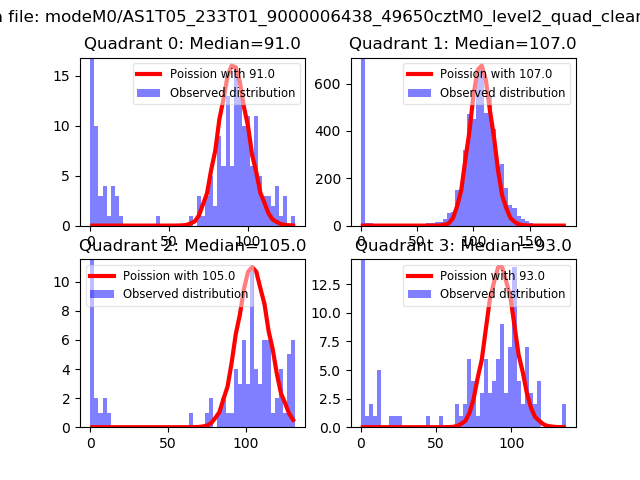 |
 |
| Quadrant-wise count rates Data is divided into 100 sec bins |
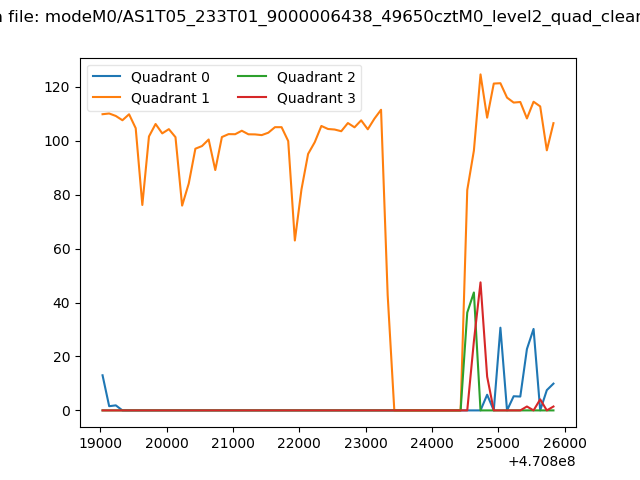 |
|
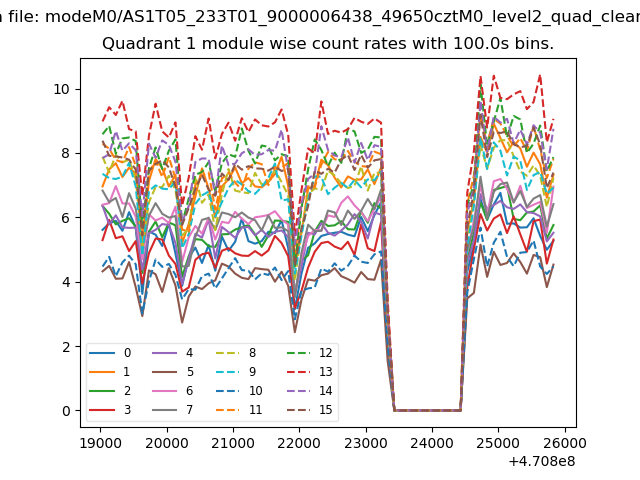
| Module-wise count rates for Quadrant A Data is divided into 100 sec bins |
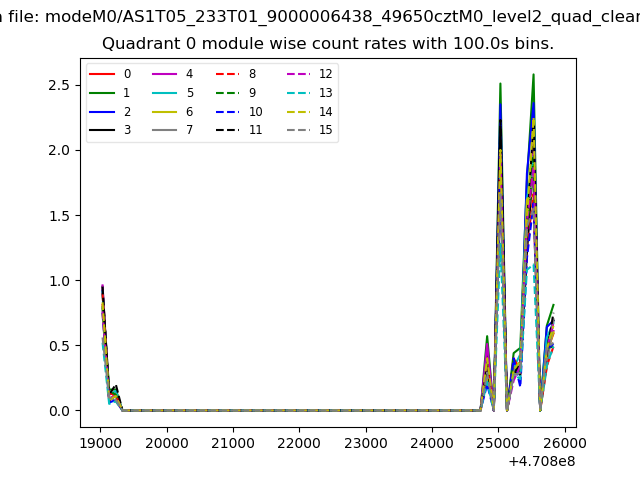 |
 |
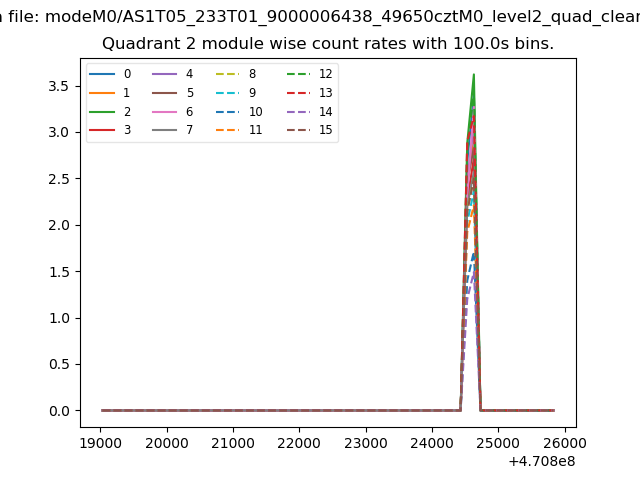
| Module-wise count rates for Quadrant B Data is divided into 100 sec bins |
 |
 |
| Module-wise count rates for Quadrant C Data is divided into 100 sec bins |
 |
 |
| Module-wise count rates for Quadrant D Data is divided into 100 sec bins |
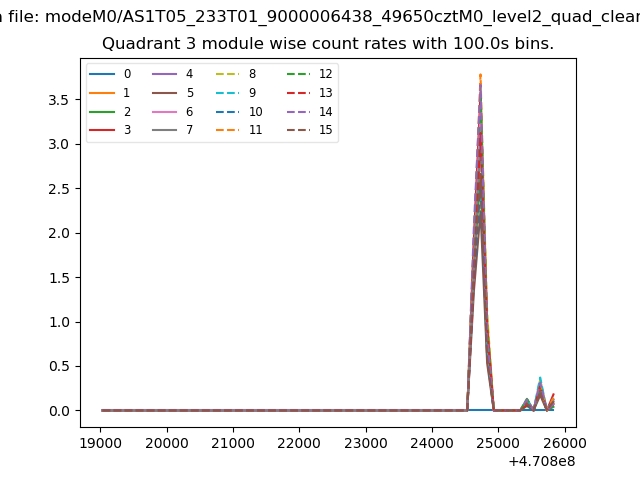 |
 |
| Parameter | Plot |
|---|---|
| CZT HV Monitor | 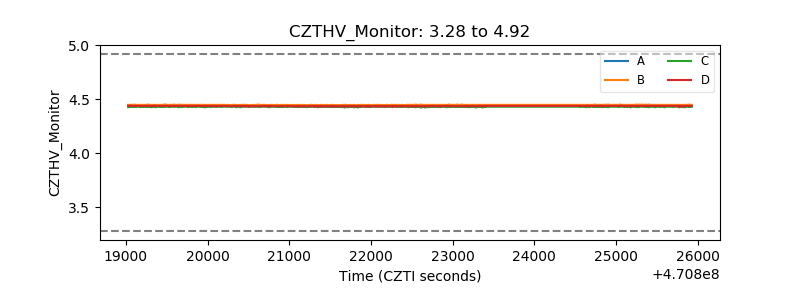 |
| D_VDD | 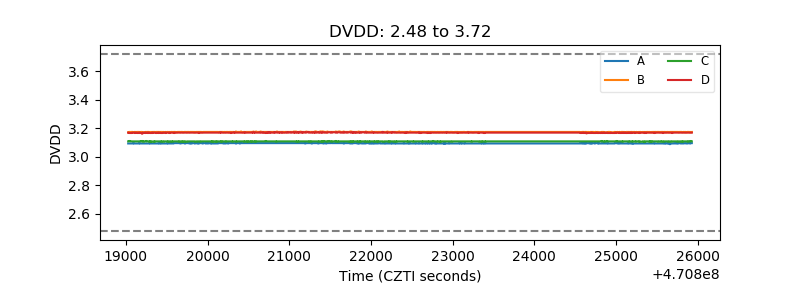 |
| Temperature 1 | 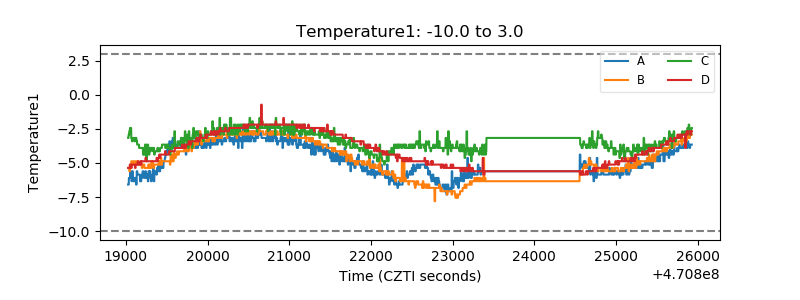 |
| Veto HV Monitor |  |
| Veto LLD | 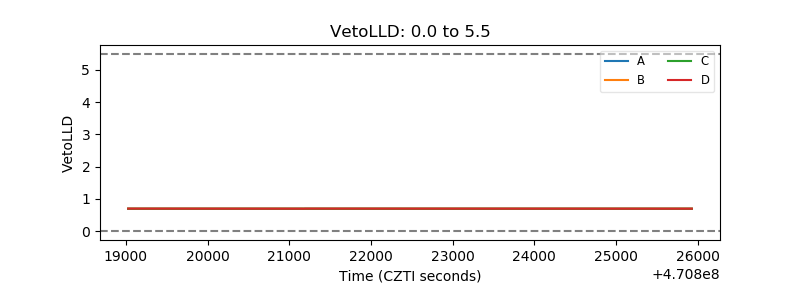 |
| Alpha Counter | 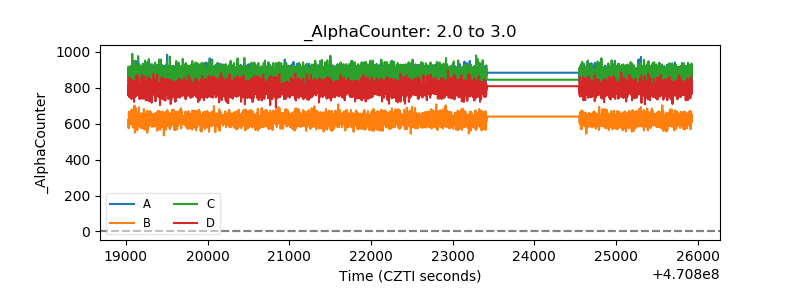 |
| _CPM_Rate | 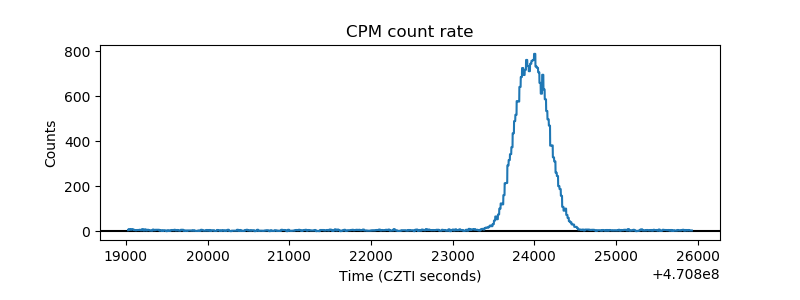 |
| CZT Counter | 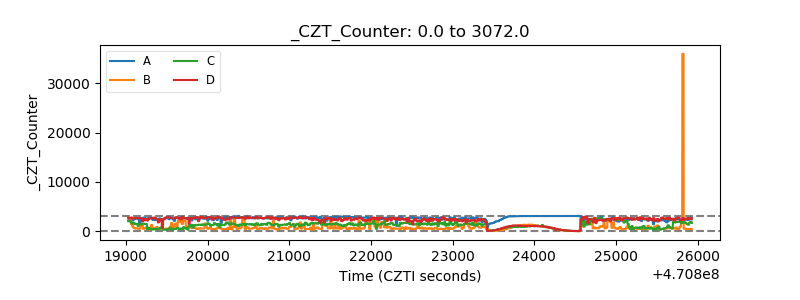 |
| +2.5 Volts monitor | 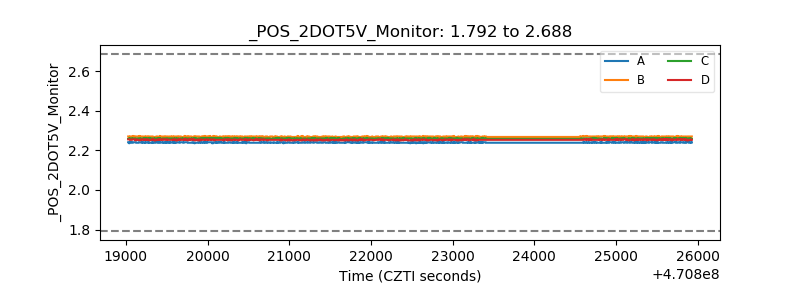 |
| +5 Volts monitor |  |
| _ROLL_ROT | 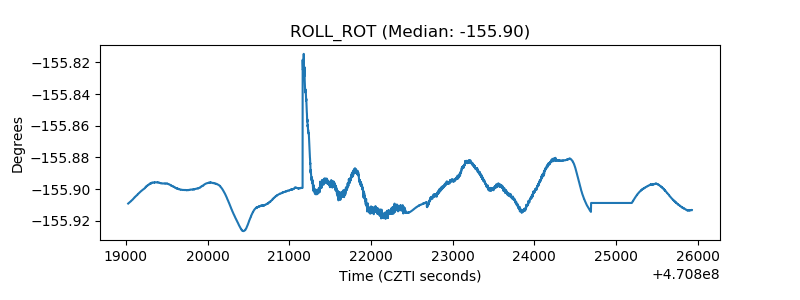 |
| _Roll_DEC | 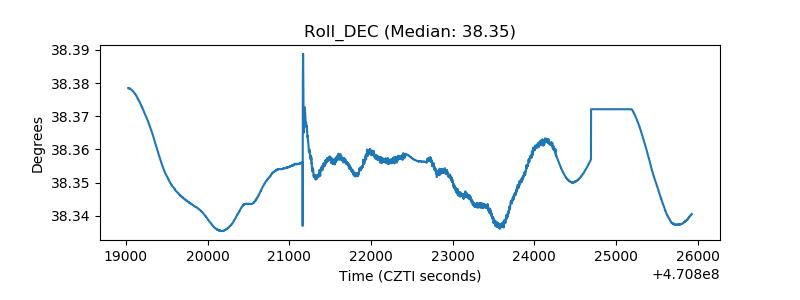 |
| _Roll_RA | 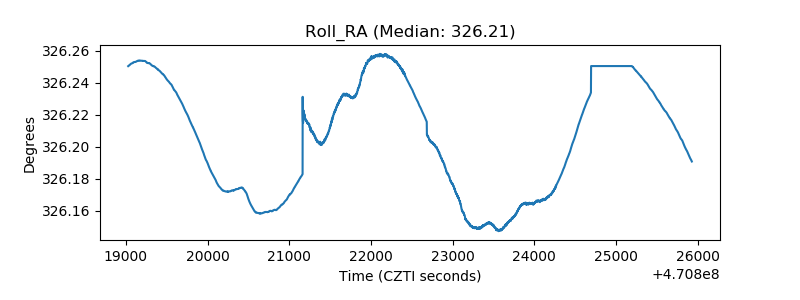 |
| Veto Counter | 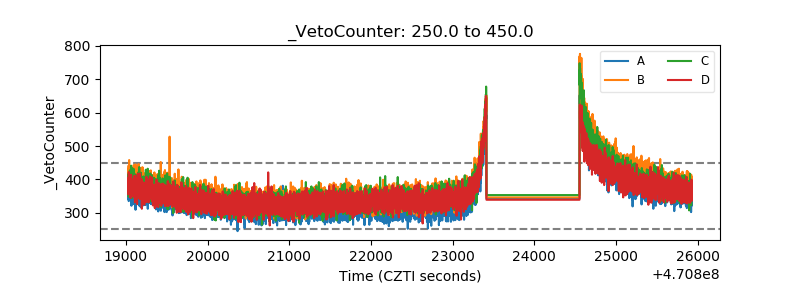 |