| Param | Original file | Final file |
|---|---|---|
| Filename | modeM0/AS1T05_233T01_9000006438_49651cztM0_level2.fits | modeM0/AS1T05_233T01_9000006438_49651cztM0_level2_quad_clean.evt |
| Size (bytes) | 1,116,486,720 | 35,124,480 |
| Size | 1.0 GB | 33.5 MB |
| Events in quadrant A | 14,700,451 | 23,826 |
| Events in quadrant B | 4,670,277 | 601,115 |
| Events in quadrant C | 7,470,577 | 1,910 |
| Events in quadrant D | 14,030,845 | 25,317 |
| Mode M9 | |||
|---|---|---|---|
| Quadrant | BADHDUFLAG | Total packets | Discarded packets |
| A | 0 | 11 | 0 |
| B | 0 | 11 | 0 |
| C | 0 | 11 | 0 |
| D | 0 | 11 | 0 |
| Mode SS | |||
|---|---|---|---|
| Quadrant | BADHDUFLAG | Total packets | Discarded packets |
| A | 0 | 118 | 0 |
| B | 0 | 118 | 0 |
| C | 0 | 118 | 0 |
| D | 0 | 118 | 0 |
| Mode M0 | |||
|---|---|---|---|
| Quadrant | BADHDUFLAG | Total packets | Discarded packets |
| A | 0 | 47724 | 1 |
| B | 0 | 17811 | 1 |
| C | 0 | 26459 | 1 |
| D | 0 | 45691 | 1 |
| Quadrant | Total seconds | Saturated seconds | Saturation percentage |
|---|---|---|---|
| A | 5888 | 5748 | 97.622283% |
| B | 5889 | 549 | 9.322466% |
| C | 5889 | 5875 | 99.762269% |
| D | 5889 | 5682 | 96.484972% |
Noise dominated data is calculated using 1-second bins in cleaned event files. If a bin has >2000 counts, and if more than 50% of those come from <1% of pixels, then it is considered to be noise-dominated and hence unusable.
| Quadrant | # 1 sec bins | Bins with >0 counts | Bins with >2000 counts | High rate bins dominated by noise | Noise dominated (total time) | Noise dominated (detector-on time) | Marked lightcurve |
|---|---|---|---|---|---|---|---|
| A | 6952 | 5887 | 5590 | 5590 | 80.41% | 94.95% |  |
| B | 6954 | 5889 | 338 | 338 | 4.86% | 5.74% | 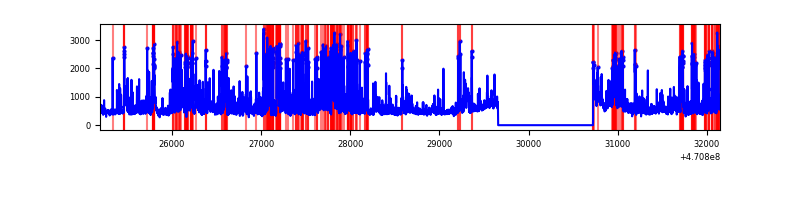 |
| C | 6953 | 5888 | 631 | 631 | 9.08% | 10.72% | 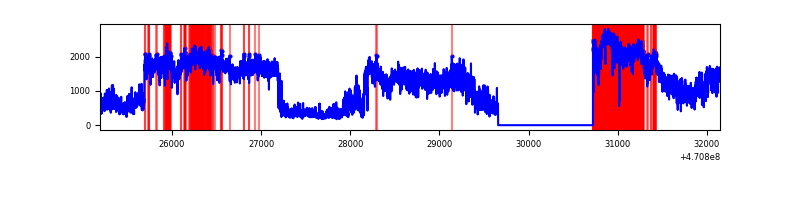 |
| D | 6953 | 5888 | 5112 | 5112 | 73.52% | 86.82% | 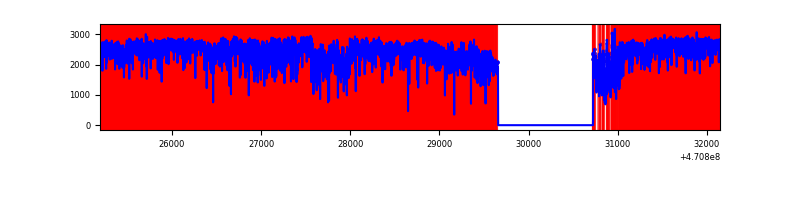 |
Top three noisy pixels from each quadrant. If the there are fewer than three noisy pixels in the level2.evt file, extra rows are filled as -1
| Pixel properties | Quadrant properties | ||||||
|---|---|---|---|---|---|---|---|
| Quadrant | DetID | PixID | Counts | Sigma | Mean | Median | Sigma |
| A | 10 | 83 | 4599681 | 51789.24 | 320 | 311 | 88.8 |
| A | 0 | 99 | 3671318 | 41335.8 | 320 | 311 | 88.8 |
| A | 6 | 35 | 782523 | 8807.76 | 320 | 311 | 88.8 |
| B | 4 | 206 | 570131 | 4254.83 | 635 | 614 | 133.9 |
| B | 7 | 0 | 446385 | 3330.33 | 635 | 614 | 133.9 |
| B | 3 | 232 | 255416 | 1903.61 | 635 | 614 | 133.9 |
| C | 15 | 180 | 2446291 | 135646.31 | 36 | 35 | 18.0 |
| C | 15 | 219 | 1742381 | 96614.1 | 36 | 35 | 18.0 |
| C | 15 | 163 | 549898 | 30490.22 | 36 | 35 | 18.0 |
| D | 15 | 40 | 3578098 | 44758.75 | 191 | 179 | 79.9 |
| D | 7 | 45 | 2452680 | 30680.09 | 191 | 179 | 79.9 |
| D | 4 | 99 | 1151656 | 14404.65 | 191 | 179 | 79.9 |
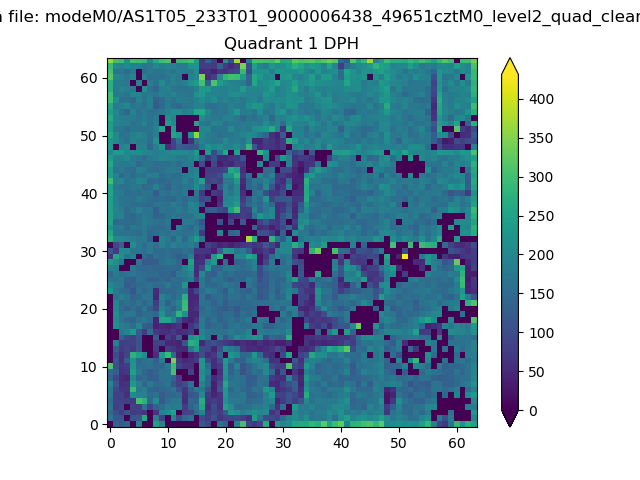
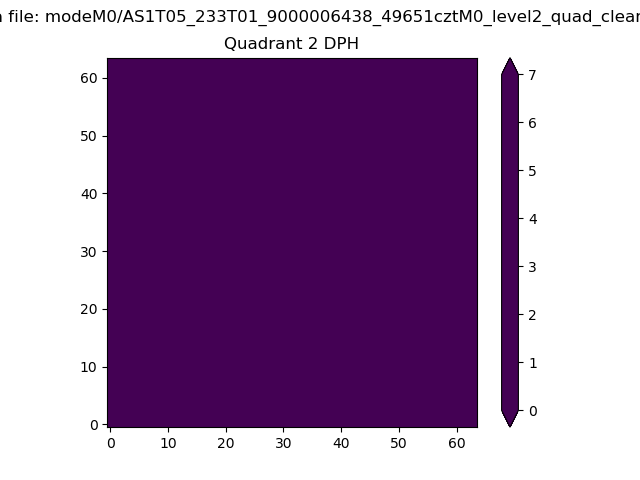
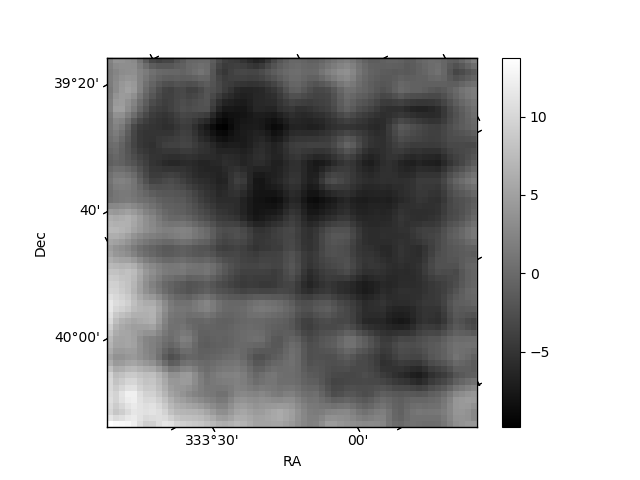
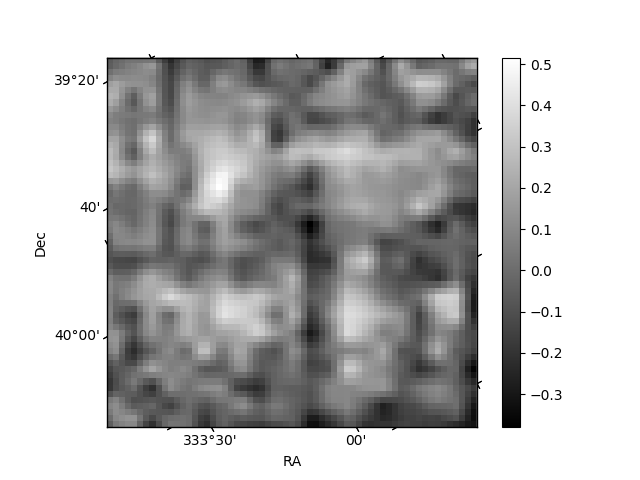
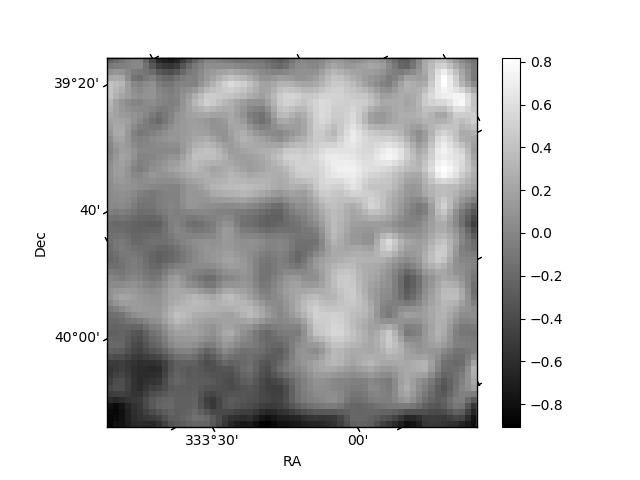
Histogram calculated using DETX and DETY for each event in the final _common_clean file
| Quadrant A | 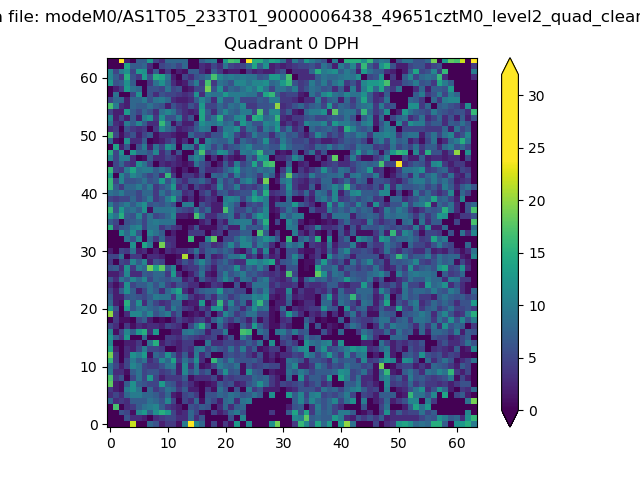 |
 |
Quadrant B |
|---|---|---|---|
| Quadrant D | 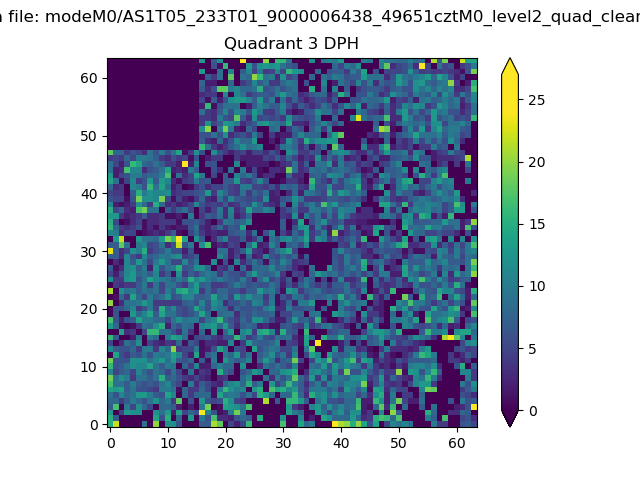 |
 |
Quadrant C |
| Plot type | Count rate plots | Images |
|---|---|---|
| Comparison with Poisson distribution Blue bars denote a histogram of data divided into 1 sec bins. Red curve is a Poisson curve with rate = median count rate of data. |
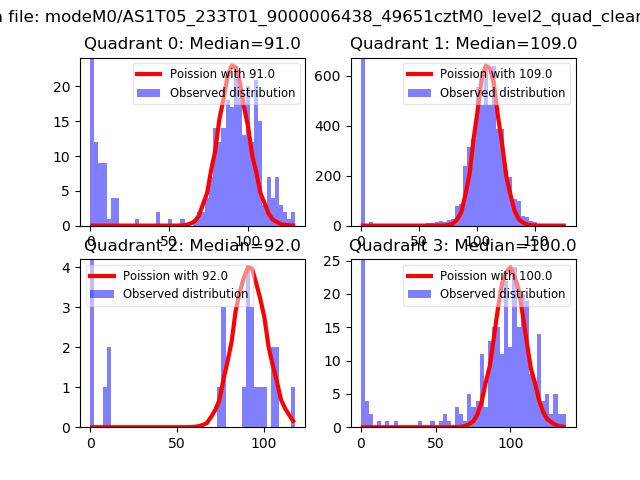 |
 |
| Quadrant-wise count rates Data is divided into 100 sec bins |
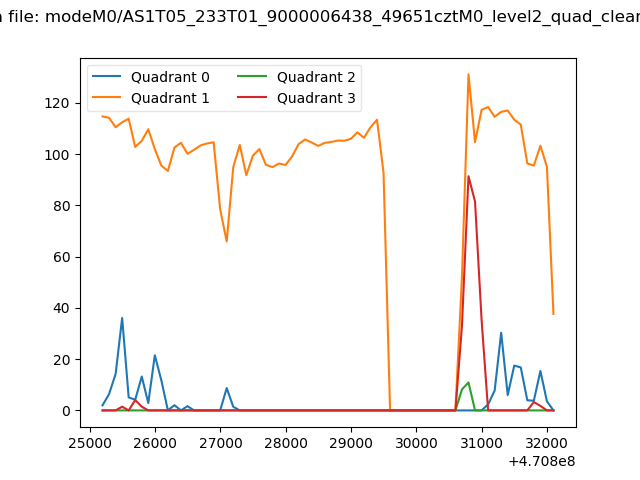 |
|
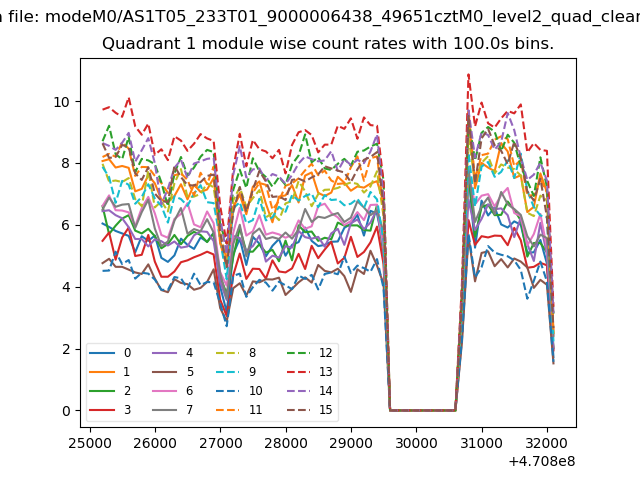
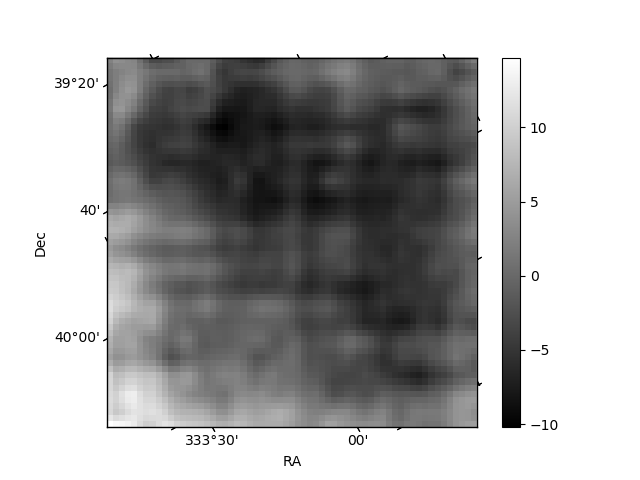
| Module-wise count rates for Quadrant A Data is divided into 100 sec bins |
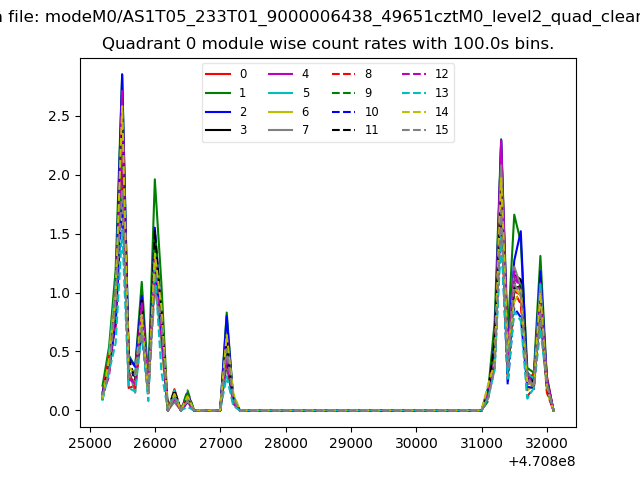 |
 |
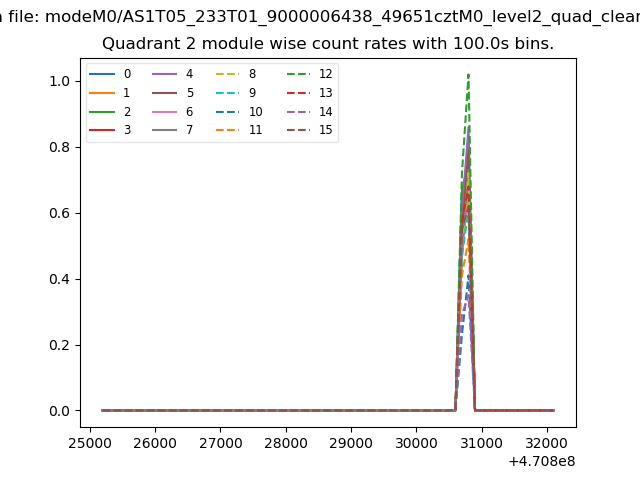
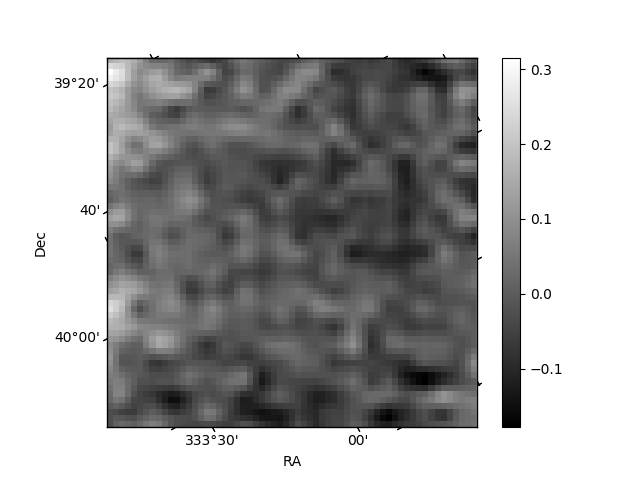
| Module-wise count rates for Quadrant B Data is divided into 100 sec bins |
 |
 |
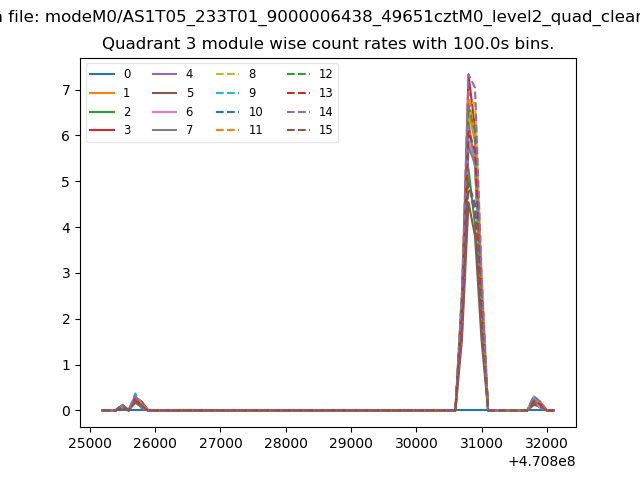
| Module-wise count rates for Quadrant C Data is divided into 100 sec bins |
 |
 |
| Module-wise count rates for Quadrant D Data is divided into 100 sec bins |
 |
 |
| Parameter | Plot |
|---|---|
| CZT HV Monitor | 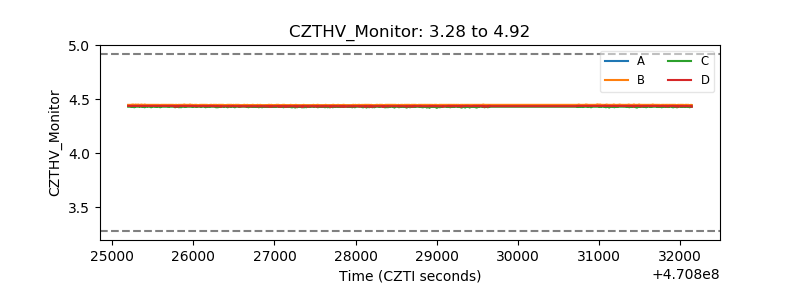 |
| D_VDD | 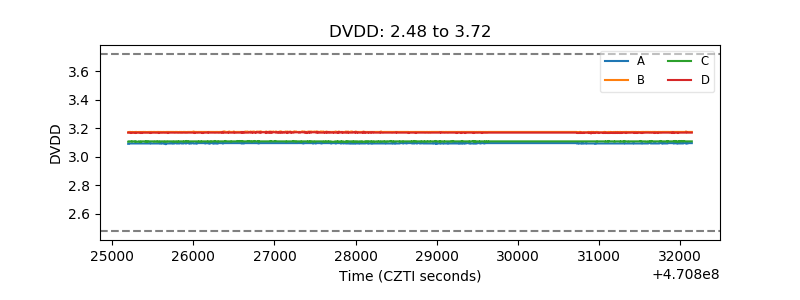 |
| Temperature 1 | 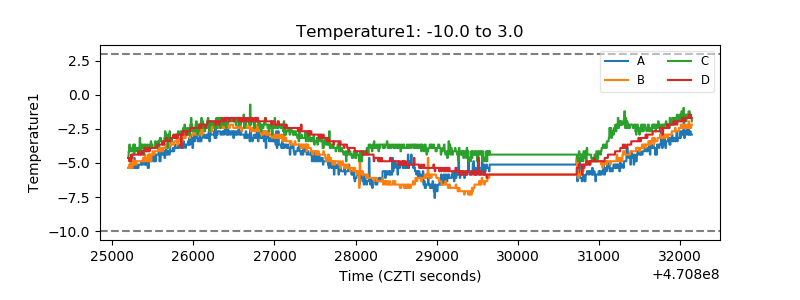 |
| Veto HV Monitor | 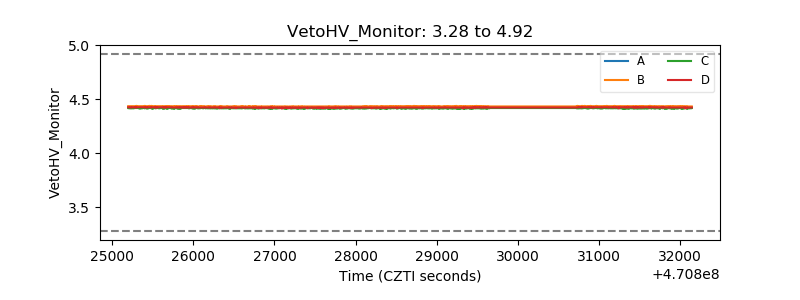 |
| Veto LLD | 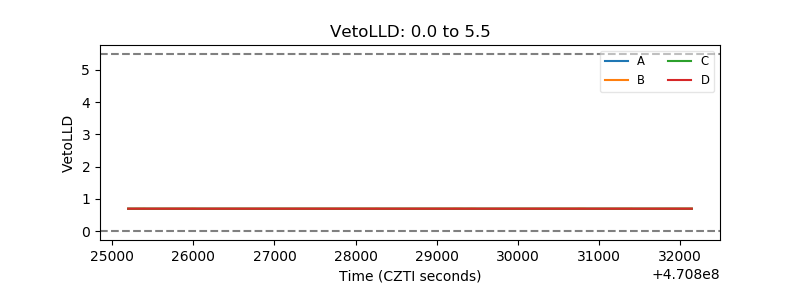 |
| Alpha Counter | 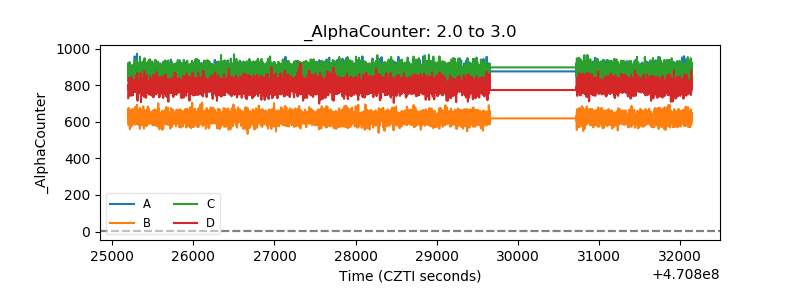 |
| _CPM_Rate | 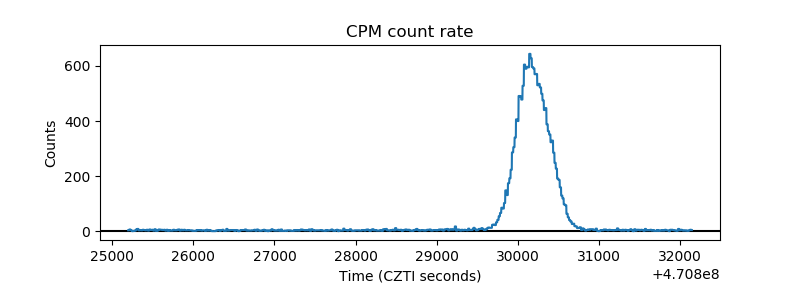 |
| CZT Counter | 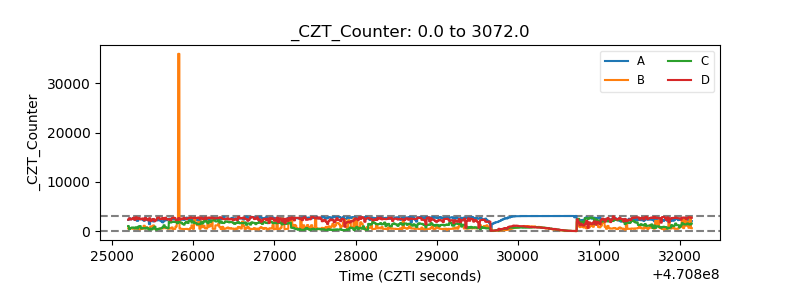 |
| +2.5 Volts monitor | 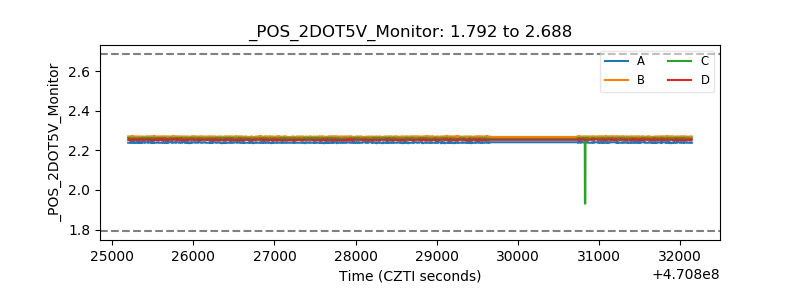 |
| +5 Volts monitor |  |
| _ROLL_ROT | 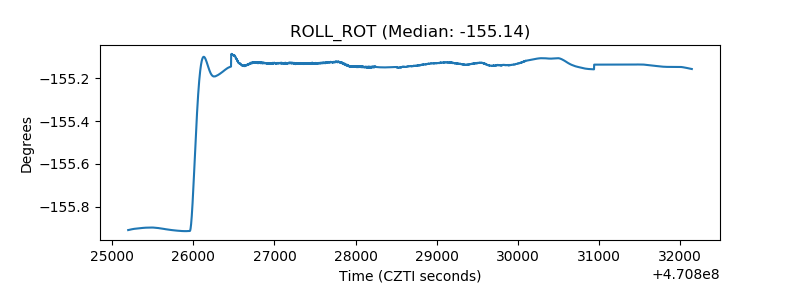 |
| _Roll_DEC | 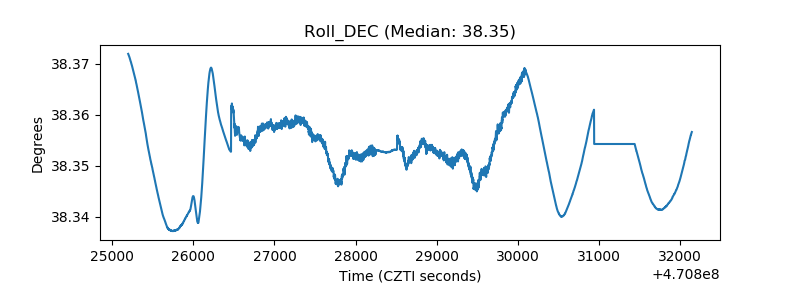 |
| _Roll_RA | 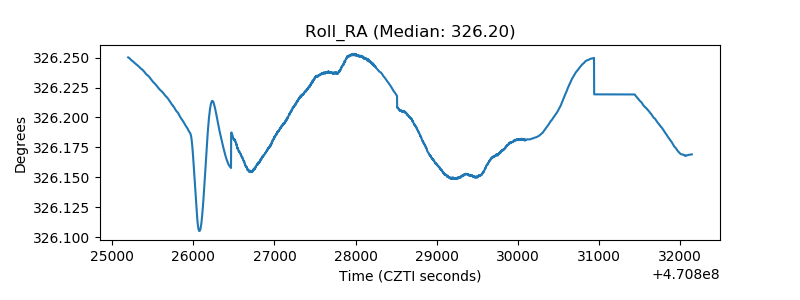 |
| Veto Counter | 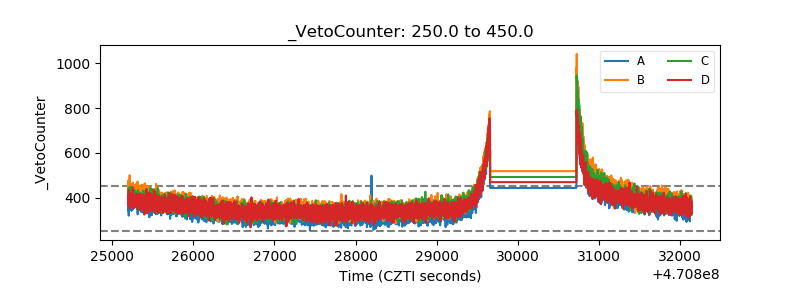 |