| Param | Original file | Final file |
|---|---|---|
| Filename | modeM0/AS1T05_233T01_9000006438_49653cztM0_level2.fits | modeM0/AS1T05_233T01_9000006438_49653cztM0_level2_quad_clean.evt |
| Size (bytes) | 1,199,344,320 | 34,833,600 |
| Size | 1.1 GB | 33.2 MB |
| Events in quadrant A | 16,026,628 | 931 |
| Events in quadrant B | 4,330,586 | 616,695 |
| Events in quadrant C | 9,111,218 | 1,285 |
| Events in quadrant D | 14,452,403 | 7,278 |
| Mode M9 | |||
|---|---|---|---|
| Quadrant | BADHDUFLAG | Total packets | Discarded packets |
| A | 0 | 9 | 0 |
| B | 0 | 9 | 0 |
| C | 0 | 9 | 0 |
| D | 0 | 9 | 0 |
| Mode SS | |||
|---|---|---|---|
| Quadrant | BADHDUFLAG | Total packets | Discarded packets |
| A | 0 | 122 | 0 |
| B | 0 | 122 | 0 |
| C | 0 | 122 | 0 |
| D | 0 | 122 | 0 |
| Mode M0 | |||
|---|---|---|---|
| Quadrant | BADHDUFLAG | Total packets | Discarded packets |
| A | 0 | 51771 | 1 |
| B | 0 | 17014 | 1 |
| C | 0 | 31452 | 1 |
| D | 0 | 47148 | 7 |
| Quadrant | Total seconds | Saturated seconds | Saturation percentage |
|---|---|---|---|
| A | 6136 | 6131 | 99.918514% |
| B | 6136 | 329 | 5.361799% |
| C | 6137 | 6130 | 99.885938% |
| D | 6136 | 6081 | 99.103651% |
Noise dominated data is calculated using 1-second bins in cleaned event files. If a bin has >2000 counts, and if more than 50% of those come from <1% of pixels, then it is considered to be noise-dominated and hence unusable.
| Quadrant | # 1 sec bins | Bins with >0 counts | Bins with >2000 counts | High rate bins dominated by noise | Noise dominated (total time) | Noise dominated (detector-on time) | Marked lightcurve |
|---|---|---|---|---|---|---|---|
| A | 7050 | 6135 | 5941 | 5941 | 84.27% | 96.84% | 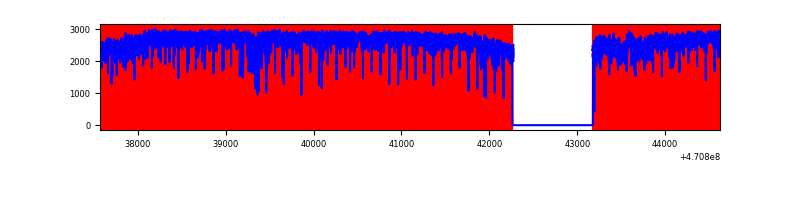 |
| B | 7051 | 6136 | 162 | 162 | 2.30% | 2.64% | 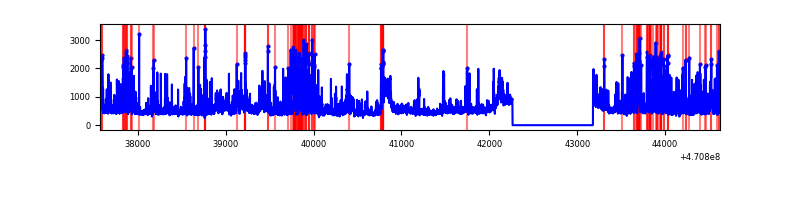 |
| C | 7051 | 6136 | 1575 | 1575 | 22.34% | 25.67% | 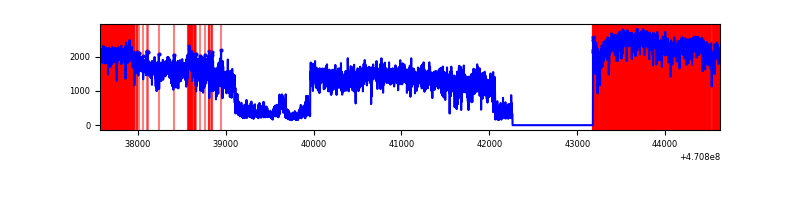 |
| D | 7050 | 6135 | 5183 | 5183 | 73.52% | 84.48% | 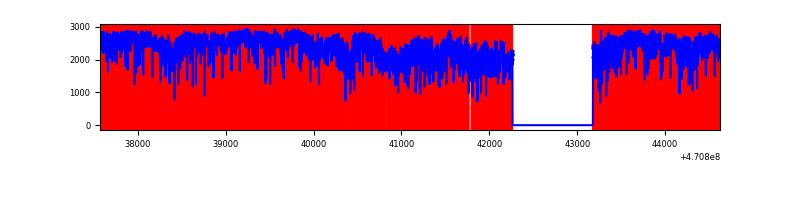 |
Top three noisy pixels from each quadrant. If the there are fewer than three noisy pixels in the level2.evt file, extra rows are filled as -1
| Pixel properties | Quadrant properties | ||||||
|---|---|---|---|---|---|---|---|
| Quadrant | DetID | PixID | Counts | Sigma | Mean | Median | Sigma |
| A | 10 | 83 | 3204347 | 43281.54 | 206 | 196 | 74.0 |
| A | 0 | 99 | 2703871 | 36521.13 | 206 | 196 | 74.0 |
| A | 3 | 130 | 2242644 | 30290.9 | 206 | 196 | 74.0 |
| B | 4 | 206 | 585661 | 4241.91 | 649 | 630 | 137.9 |
| B | 10 | 57 | 212308 | 1534.82 | 649 | 630 | 137.9 |
| B | 7 | 0 | 175469 | 1267.71 | 649 | 630 | 137.9 |
| C | 15 | 180 | 2270699 | 57254.31 | 73 | 69 | 39.7 |
| C | 15 | 197 | 1056187 | 26630.19 | 73 | 69 | 39.7 |
| C | 15 | 163 | 1040810 | 26242.46 | 73 | 69 | 39.7 |
| D | 15 | 40 | 2675100 | 48089.22 | 116 | 107 | 55.6 |
| D | 7 | 60 | 2271446 | 40832.6 | 116 | 107 | 55.6 |
| D | 15 | 184 | 1938385 | 34845.05 | 116 | 107 | 55.6 |
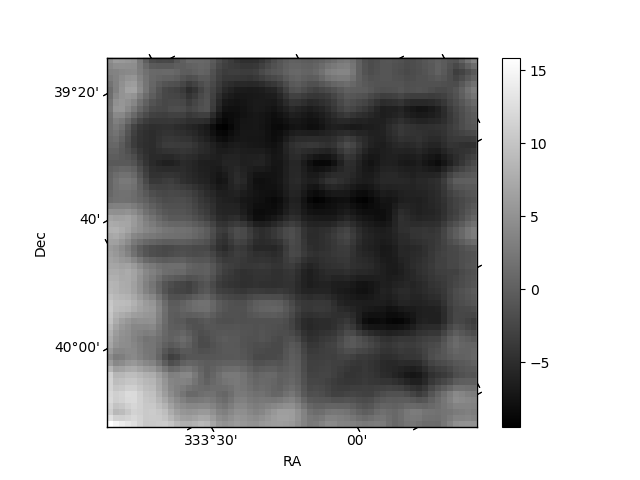
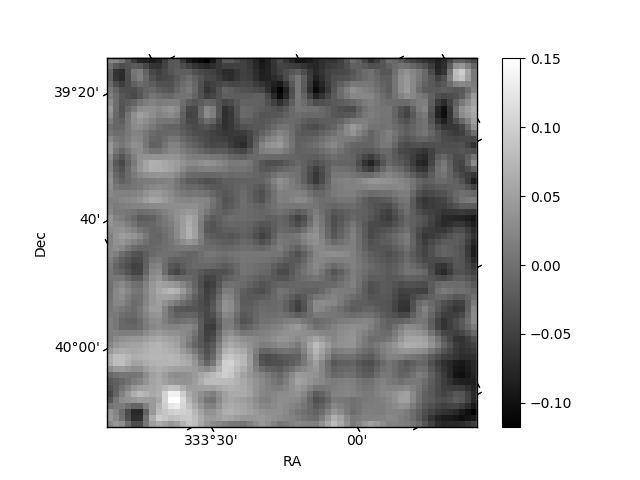
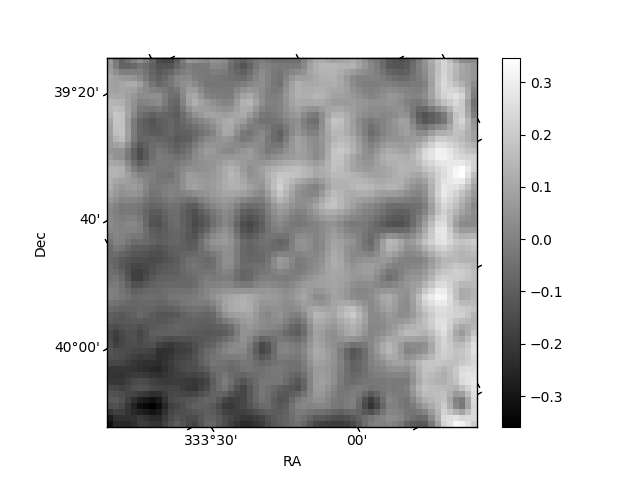
Histogram calculated using DETX and DETY for each event in the final _common_clean file
| Quadrant A | 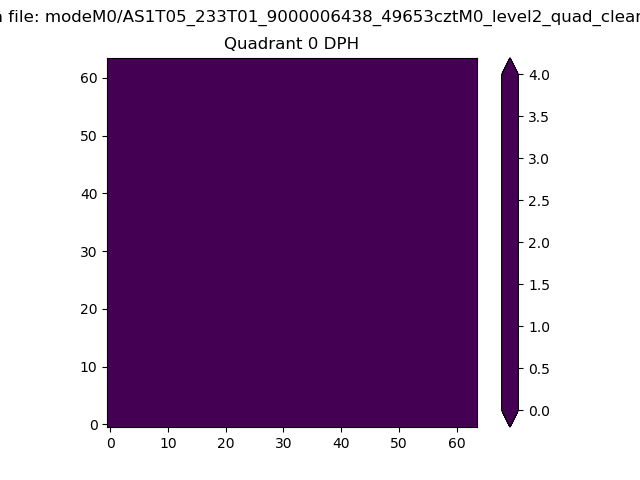 |
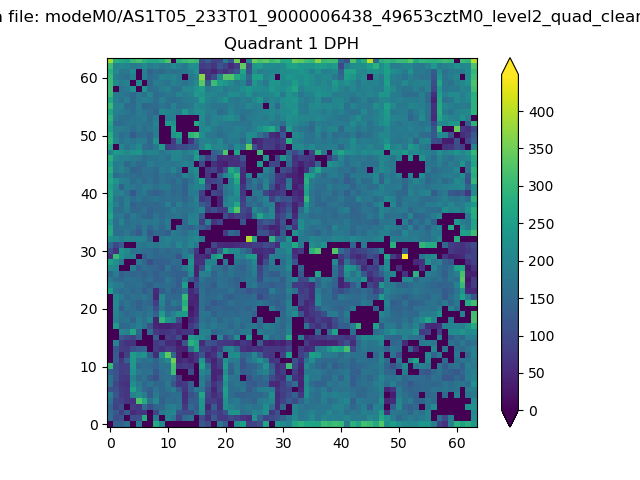 |
Quadrant B |
|---|---|---|---|
| Quadrant D | 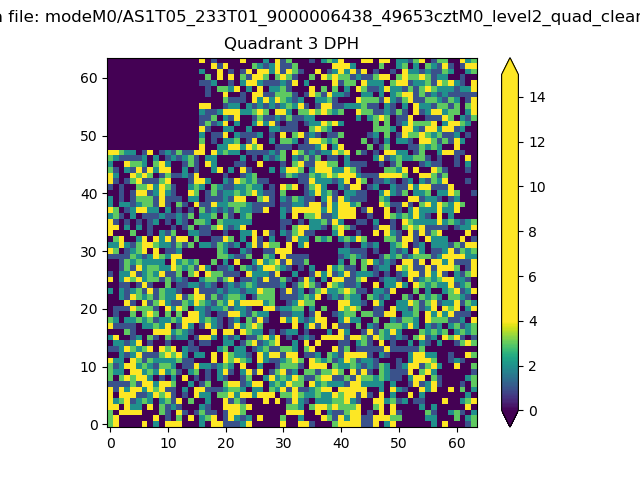 |
 |
Quadrant C |
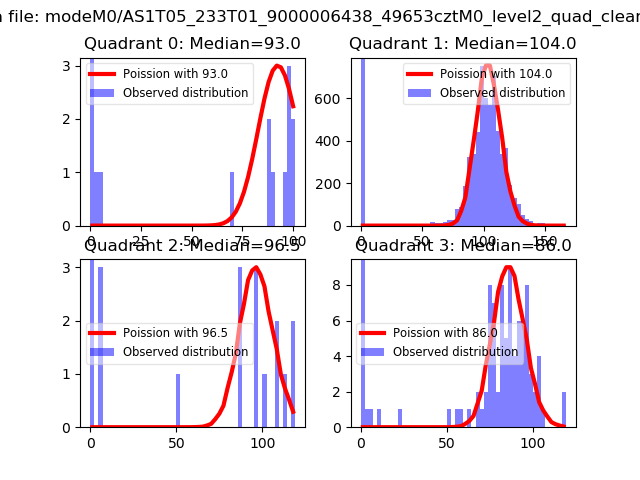
| Plot type | Count rate plots | Images |
|---|---|---|
| Comparison with Poisson distribution Blue bars denote a histogram of data divided into 1 sec bins. Red curve is a Poisson curve with rate = median count rate of data. |
 |
 |
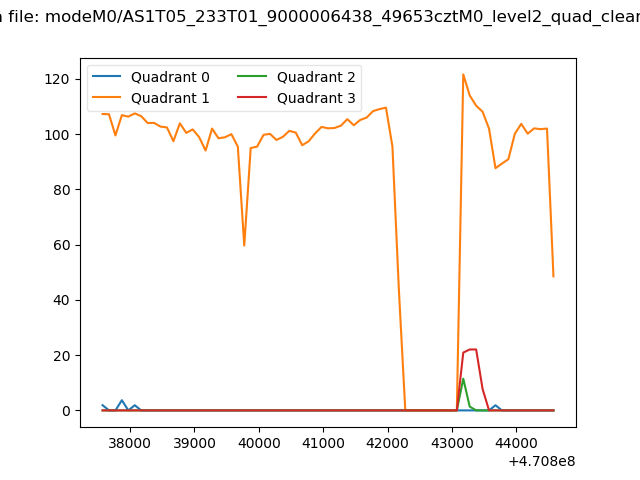
| Quadrant-wise count rates Data is divided into 100 sec bins |
 |
|
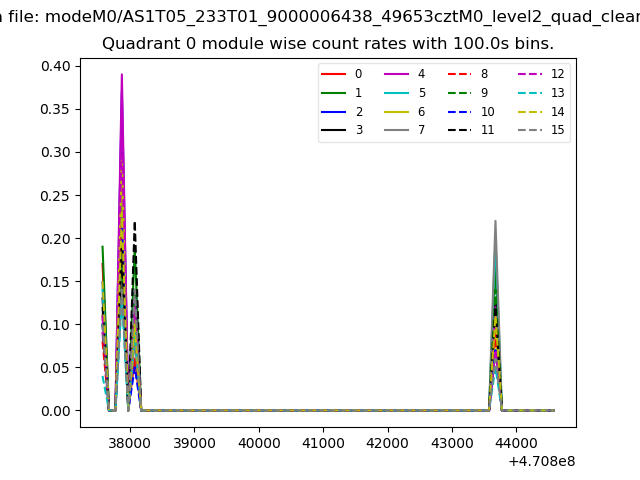
| Module-wise count rates for Quadrant A Data is divided into 100 sec bins |
 |
 |
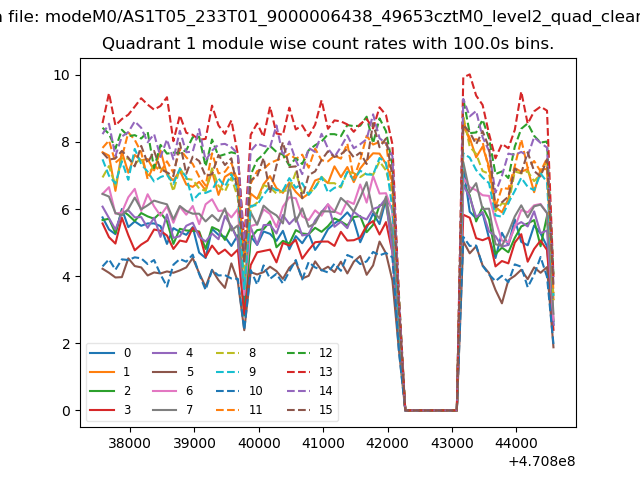
| Module-wise count rates for Quadrant B Data is divided into 100 sec bins |
 |
 |
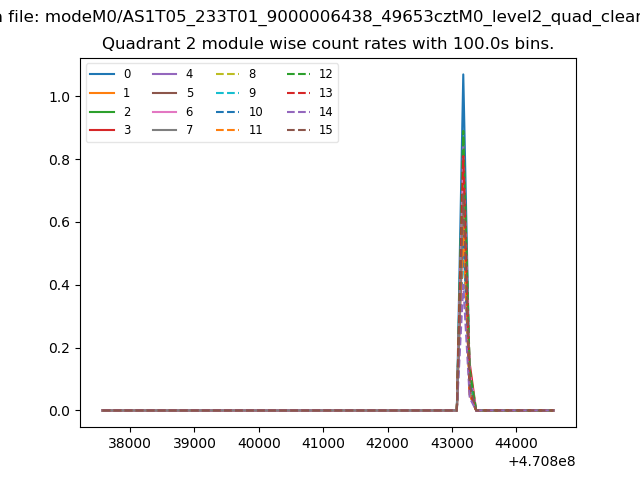
| Module-wise count rates for Quadrant C Data is divided into 100 sec bins |
 |
 |
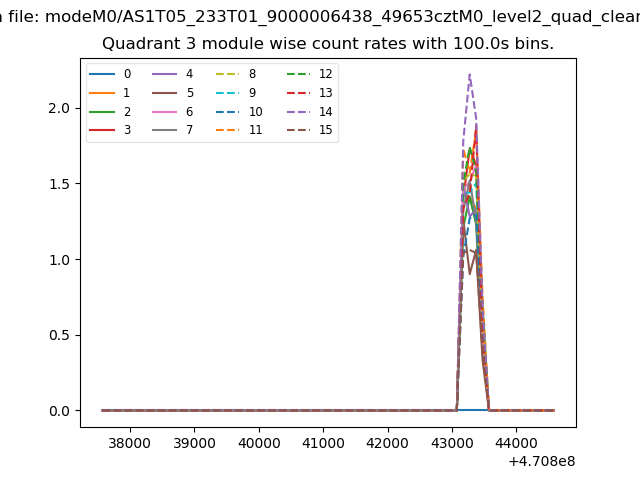
| Module-wise count rates for Quadrant D Data is divided into 100 sec bins |
 |
 |
| Parameter | Plot |
|---|---|
| CZT HV Monitor |  |
| D_VDD | 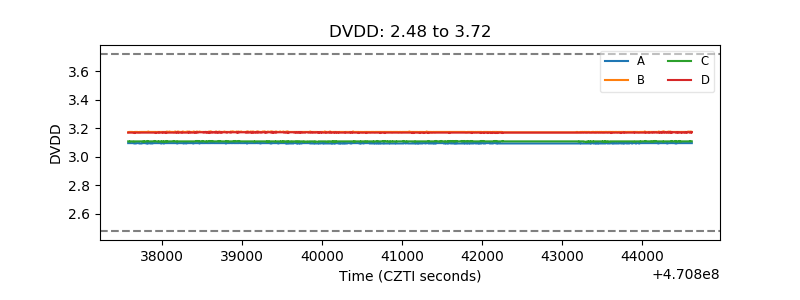 |
| Temperature 1 | 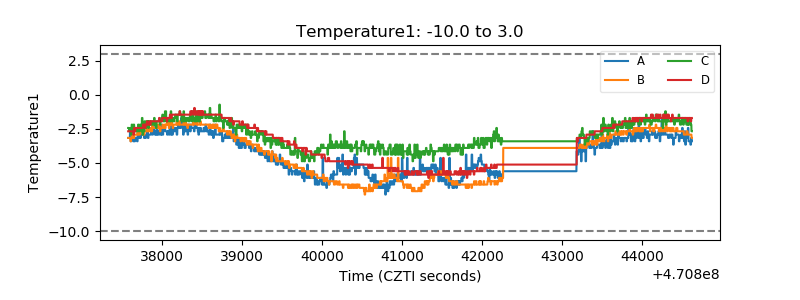 |
| Veto HV Monitor | 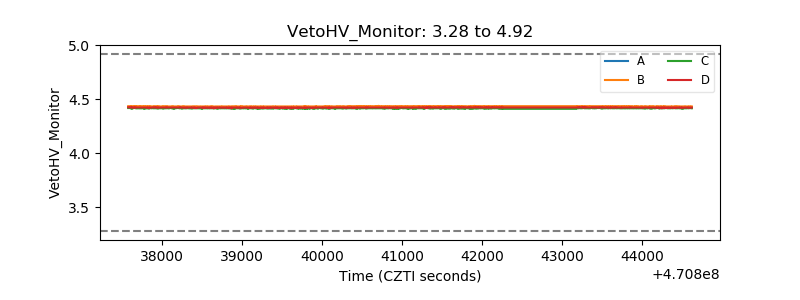 |
| Veto LLD | 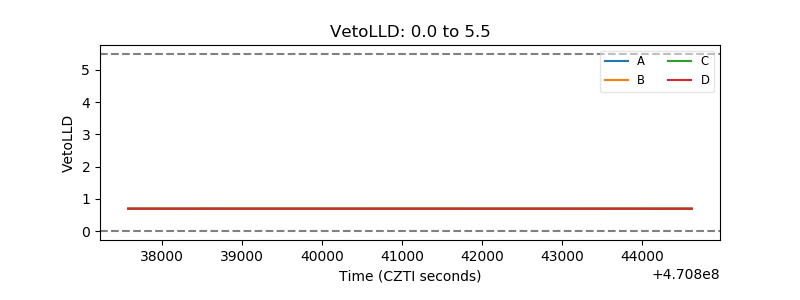 |
| Alpha Counter | 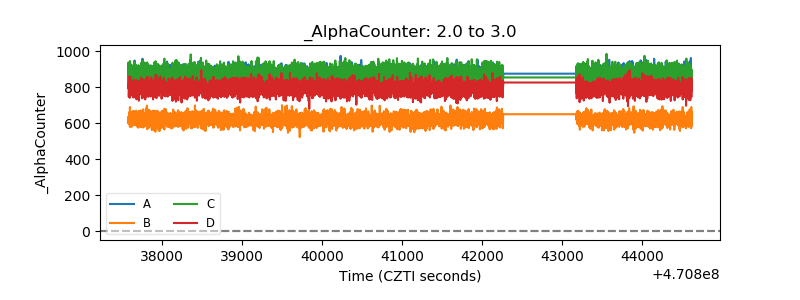 |
| _CPM_Rate | 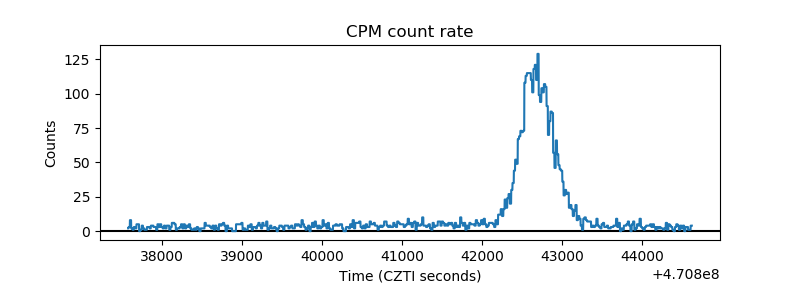 |
| CZT Counter | 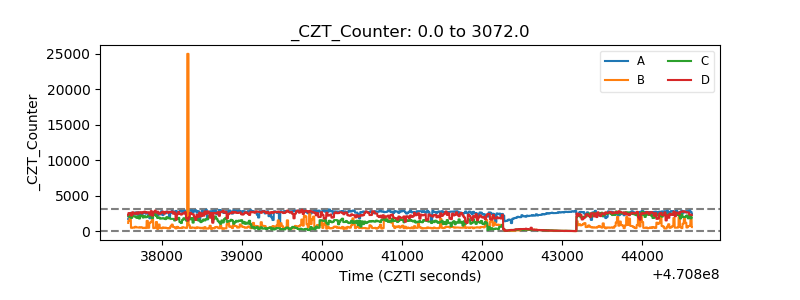 |
| +2.5 Volts monitor |  |
| +5 Volts monitor | 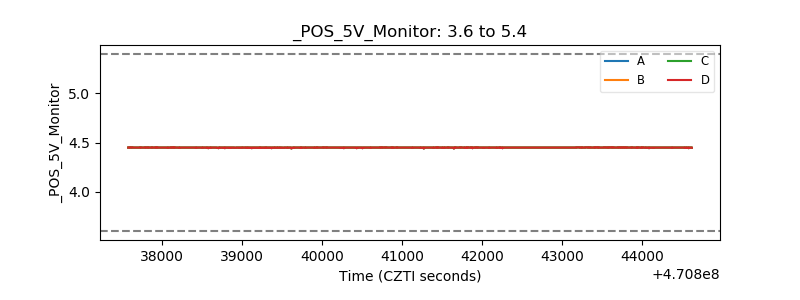 |
| _ROLL_ROT | 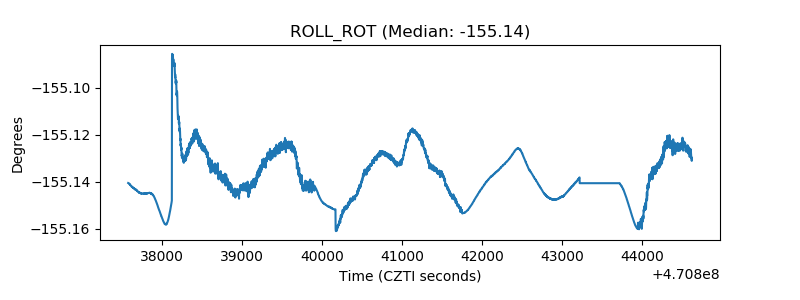 |
| _Roll_DEC | 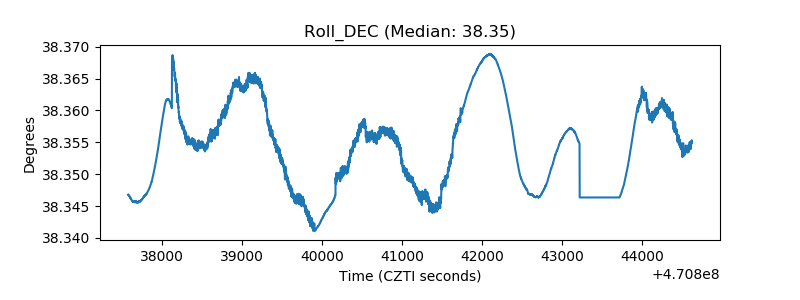 |
| _Roll_RA | 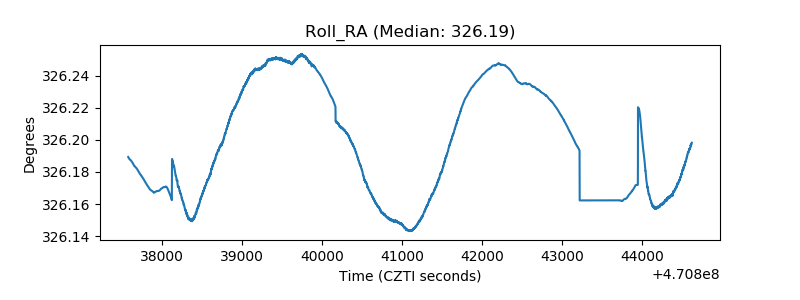 |
| Veto Counter | 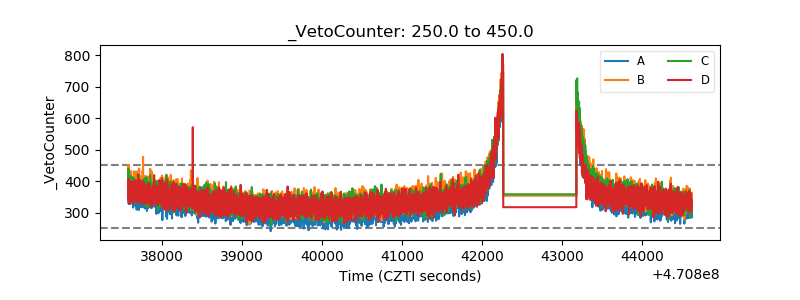 |