| Param | Original file | Final file |
|---|---|---|
| Filename | modeM0/AS1T05_233T01_9000006438_49654cztM0_level2.fits | modeM0/AS1T05_233T01_9000006438_49654cztM0_level2_quad_clean.evt |
| Size (bytes) | 1,354,466,880 | 38,744,640 |
| Size | 1.3 GB | 36.9 MB |
| Events in quadrant A | 18,201,815 | 558 |
| Events in quadrant B | 4,975,341 | 671,660 |
| Events in quadrant C | 10,289,046 | 7,736 |
| Events in quadrant D | 16,137,787 | 11,121 |
| Mode M9 | |||
|---|---|---|---|
| Quadrant | BADHDUFLAG | Total packets | Discarded packets |
| A | 0 | 5 | 0 |
| B | 0 | 5 | 0 |
| C | 0 | 5 | 0 |
| D | 0 | 5 | 0 |
| Mode SS | |||
|---|---|---|---|
| Quadrant | BADHDUFLAG | Total packets | Discarded packets |
| A | 0 | 142 | 0 |
| B | 0 | 142 | 0 |
| C | 0 | 142 | 0 |
| D | 0 | 142 | 0 |
| Mode M0 | |||
|---|---|---|---|
| Quadrant | BADHDUFLAG | Total packets | Discarded packets |
| A | 0 | 58764 | 1 |
| B | 0 | 19550 | 2 |
| C | 0 | 35461 | 1 |
| D | 0 | 52693 | 1 |
| Quadrant | Total seconds | Saturated seconds | Saturation percentage |
|---|---|---|---|
| A | 6908 | 6905 | 99.956572% |
| B | 6907 | 473 | 6.848125% |
| C | 6907 | 6861 | 99.334009% |
| D | 6907 | 6821 | 98.754886% |
Noise dominated data is calculated using 1-second bins in cleaned event files. If a bin has >2000 counts, and if more than 50% of those come from <1% of pixels, then it is considered to be noise-dominated and hence unusable.
| Quadrant | # 1 sec bins | Bins with >0 counts | Bins with >2000 counts | High rate bins dominated by noise | Noise dominated (total time) | Noise dominated (detector-on time) | Marked lightcurve |
|---|---|---|---|---|---|---|---|
| A | 7447 | 6907 | 6759 | 6759 | 90.76% | 97.86% | 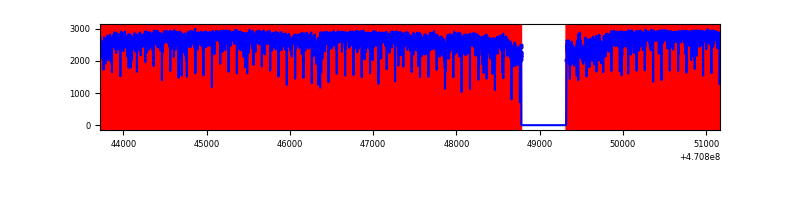 |
| B | 7446 | 6906 | 287 | 287 | 3.85% | 4.16% | 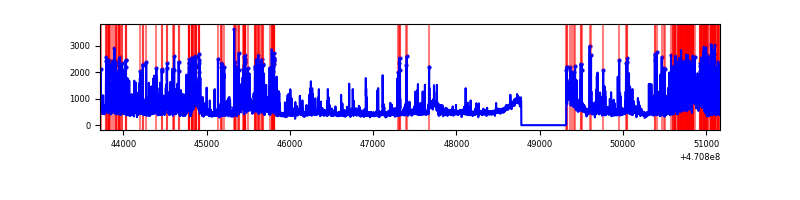 |
| C | 7446 | 6906 | 2057 | 2057 | 27.63% | 29.79% | 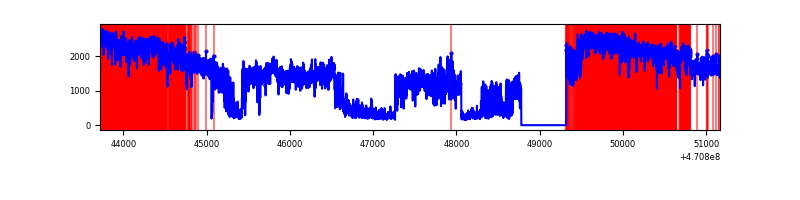 |
| D | 7446 | 6906 | 5632 | 5632 | 75.64% | 81.55% | 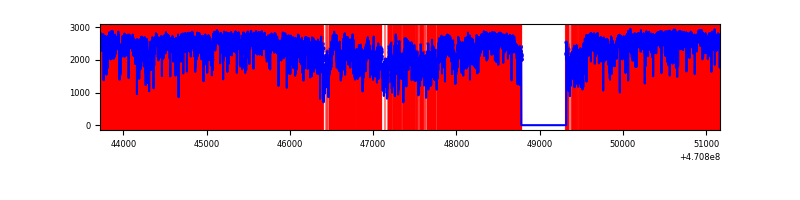 |
Top three noisy pixels from each quadrant. If the there are fewer than three noisy pixels in the level2.evt file, extra rows are filled as -1
| Pixel properties | Quadrant properties | ||||||
|---|---|---|---|---|---|---|---|
| Quadrant | DetID | PixID | Counts | Sigma | Mean | Median | Sigma |
| A | 0 | 99 | 6420582 | 92559.19 | 183 | 172 | 69.4 |
| A | 3 | 130 | 2899019 | 41790.94 | 183 | 172 | 69.4 |
| A | 10 | 83 | 2889100 | 41647.94 | 183 | 172 | 69.4 |
| B | 4 | 206 | 518487 | 3345.31 | 729 | 708 | 154.8 |
| B | 3 | 232 | 459939 | 2967.04 | 729 | 708 | 154.8 |
| B | 7 | 0 | 285070 | 1837.23 | 729 | 708 | 154.8 |
| C | 15 | 180 | 2181416 | 68607.4 | 90 | 88 | 31.8 |
| C | 15 | 163 | 1523357 | 47910.04 | 90 | 88 | 31.8 |
| C | 15 | 197 | 994667 | 31281.62 | 90 | 88 | 31.8 |
| D | 15 | 40 | 2528257 | 41474.83 | 136 | 127 | 61.0 |
| D | 7 | 60 | 2311826 | 37924.21 | 136 | 127 | 61.0 |
| D | 7 | 45 | 2162445 | 35473.56 | 136 | 127 | 61.0 |
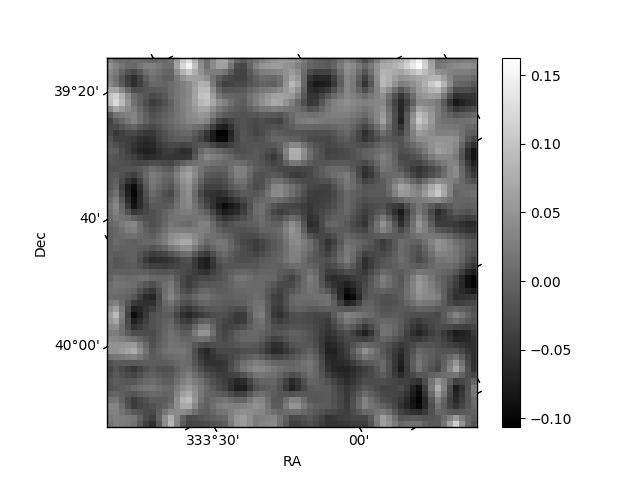
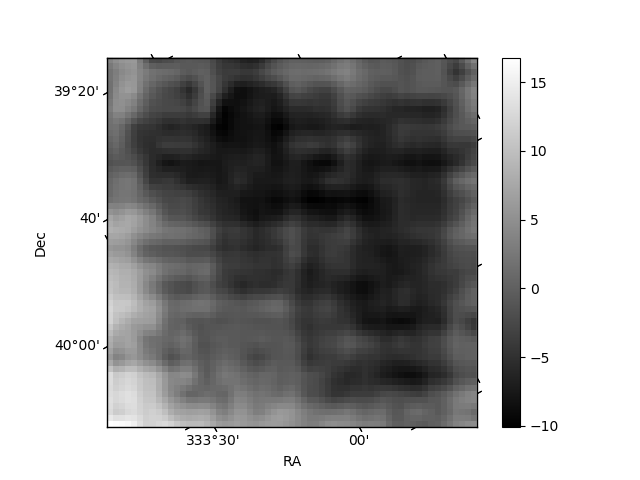
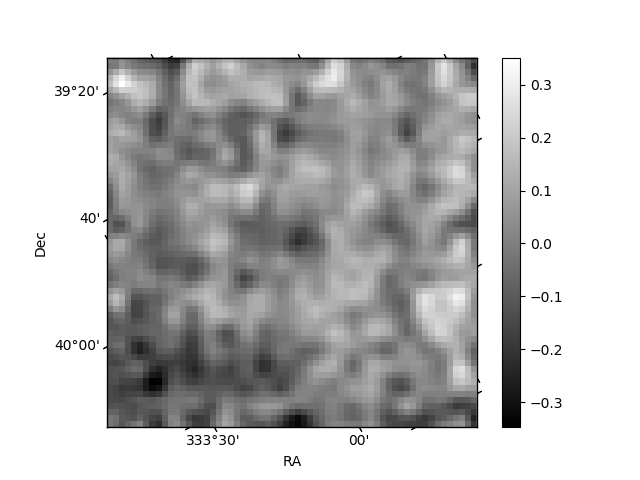
Histogram calculated using DETX and DETY for each event in the final _common_clean file
| Quadrant A | 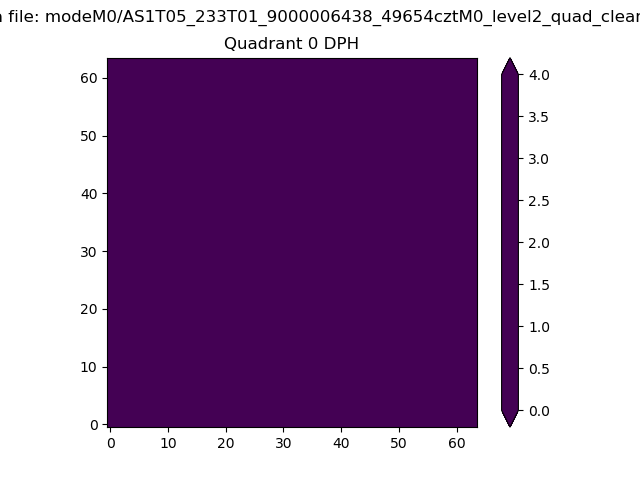 |
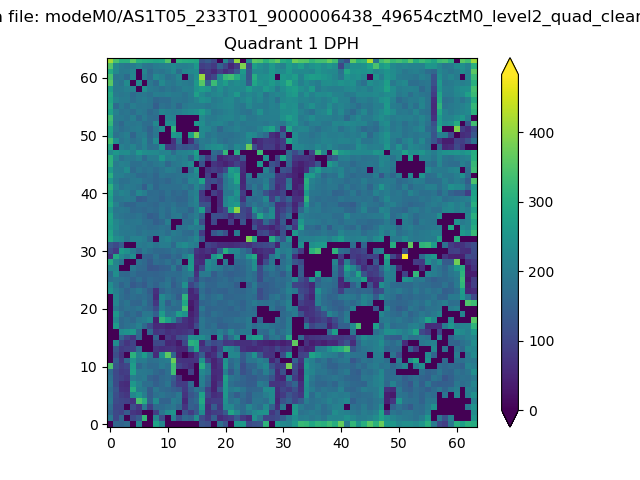 |
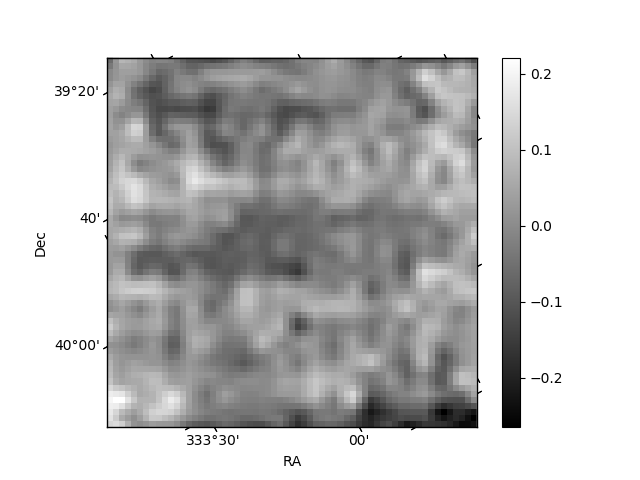
Quadrant B |
|---|---|---|---|
| Quadrant D | 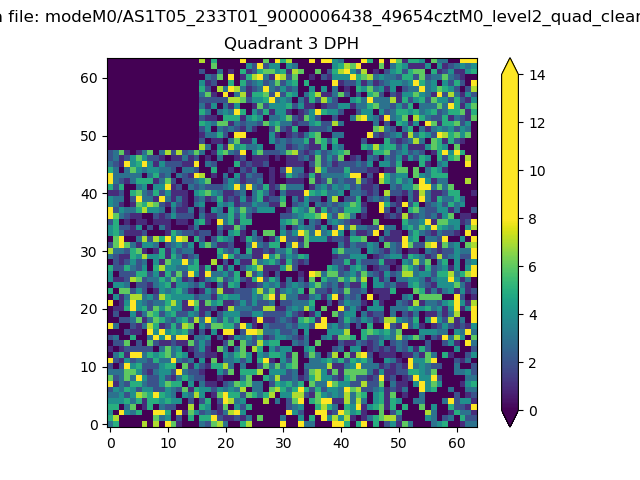 |
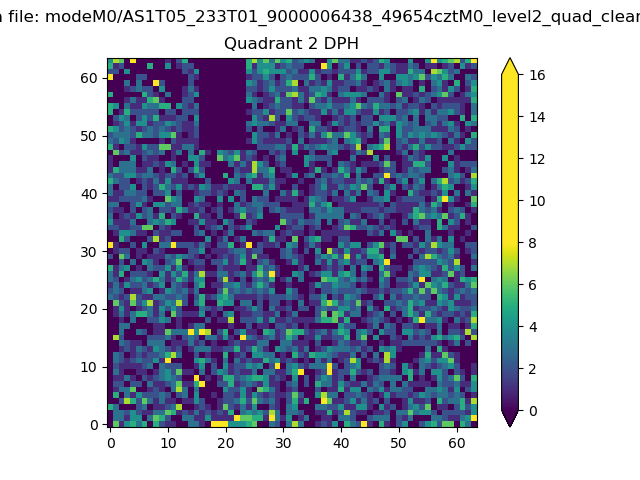 |
Quadrant C |
| Plot type | Count rate plots | Images |
|---|---|---|
| Comparison with Poisson distribution Blue bars denote a histogram of data divided into 1 sec bins. Red curve is a Poisson curve with rate = median count rate of data. |
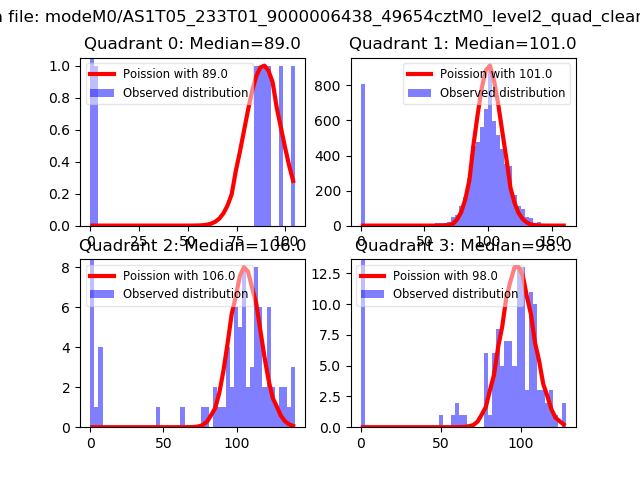 |
 |
| Quadrant-wise count rates Data is divided into 100 sec bins |
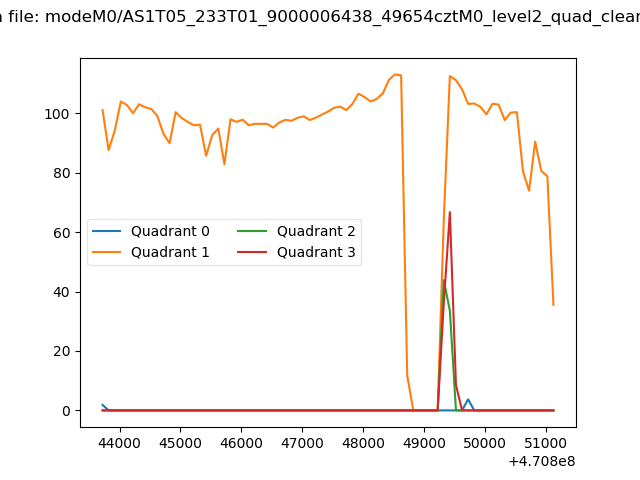 |
|
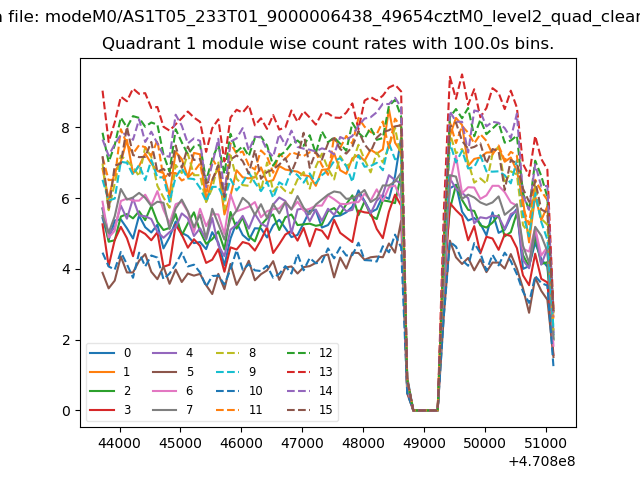
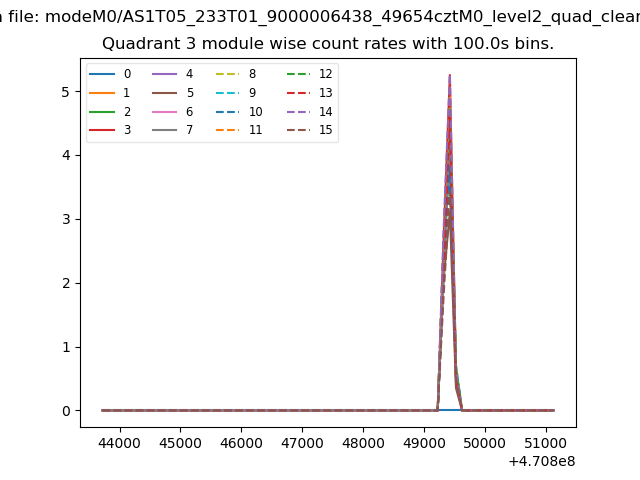
| Module-wise count rates for Quadrant A Data is divided into 100 sec bins |
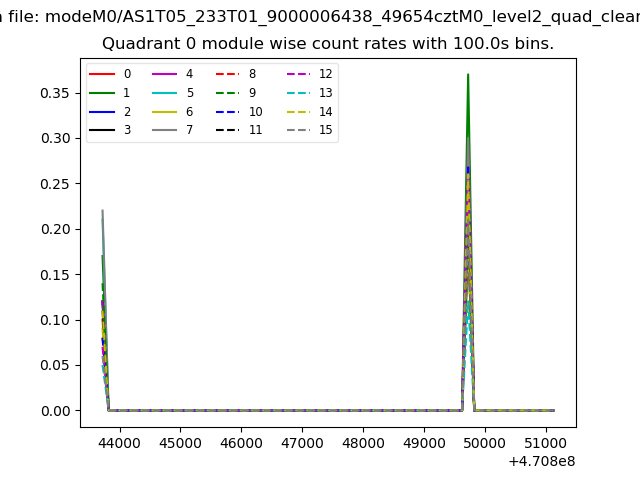 |
 |
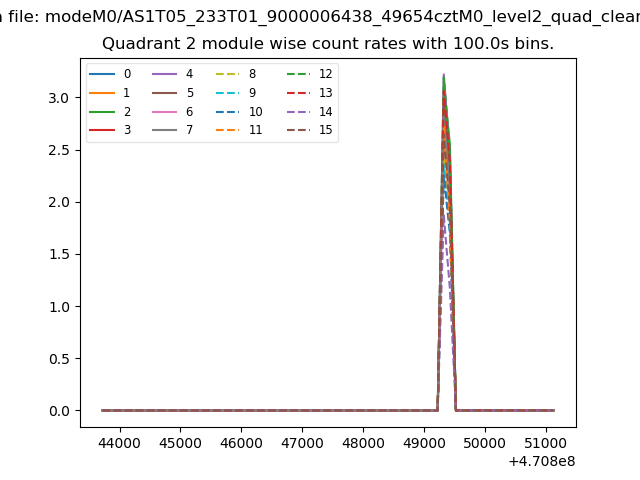
| Module-wise count rates for Quadrant B Data is divided into 100 sec bins |
 |
 |
| Module-wise count rates for Quadrant C Data is divided into 100 sec bins |
 |
 |
| Module-wise count rates for Quadrant D Data is divided into 100 sec bins |
 |
 |
| Parameter | Plot |
|---|---|
| CZT HV Monitor |  |
| D_VDD | 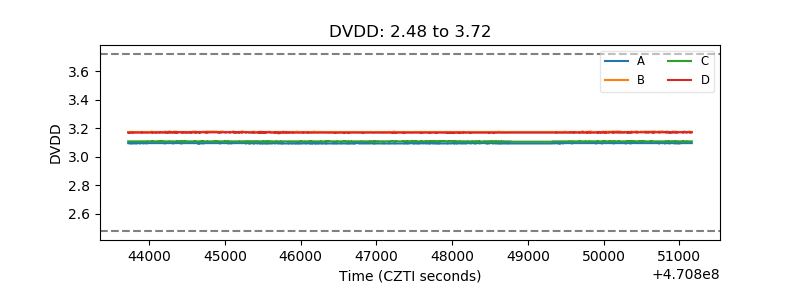 |
| Temperature 1 | 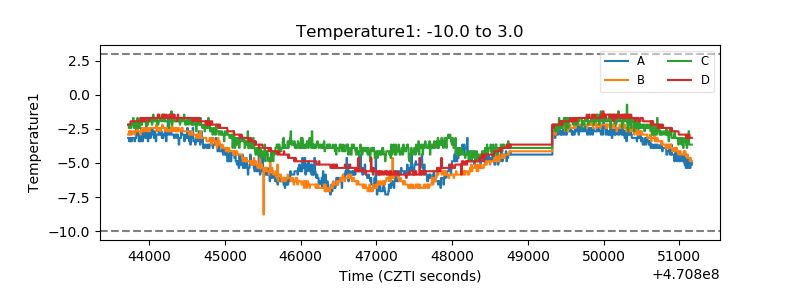 |
| Veto HV Monitor | 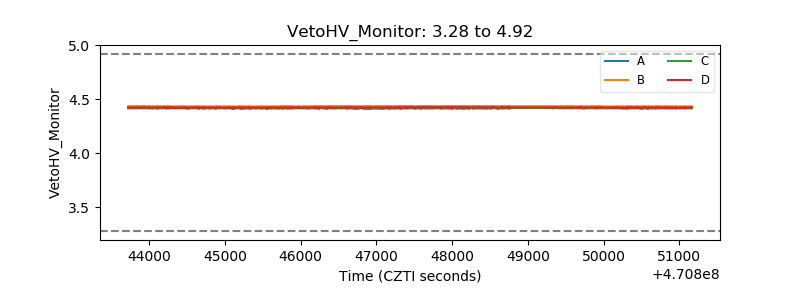 |
| Veto LLD | 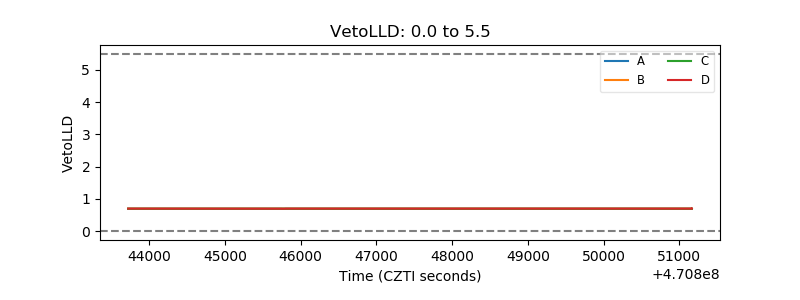 |
| Alpha Counter | 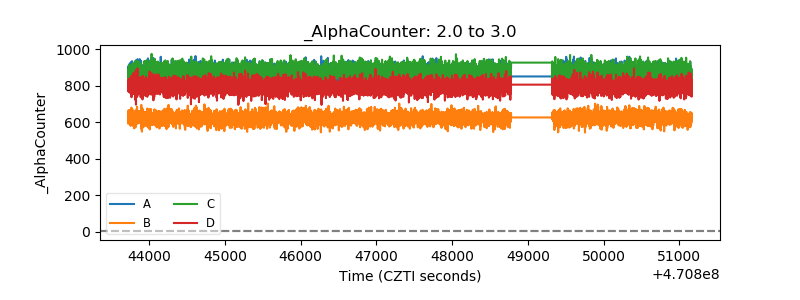 |
| _CPM_Rate | 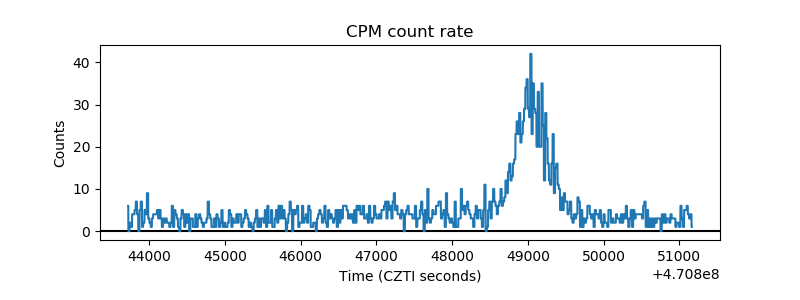 |
| CZT Counter | 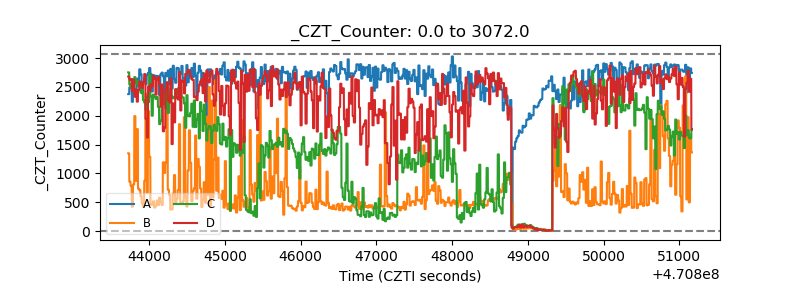 |
| +2.5 Volts monitor | 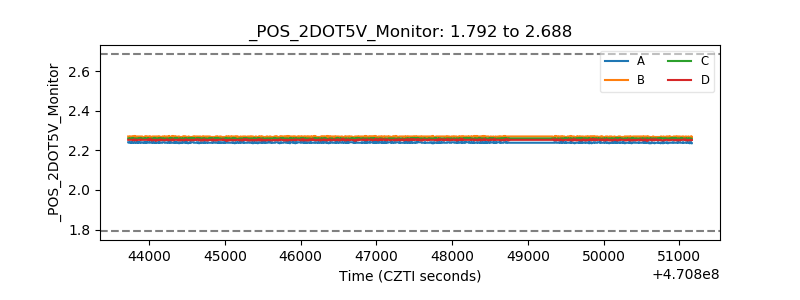 |
| +5 Volts monitor |  |
| _ROLL_ROT | 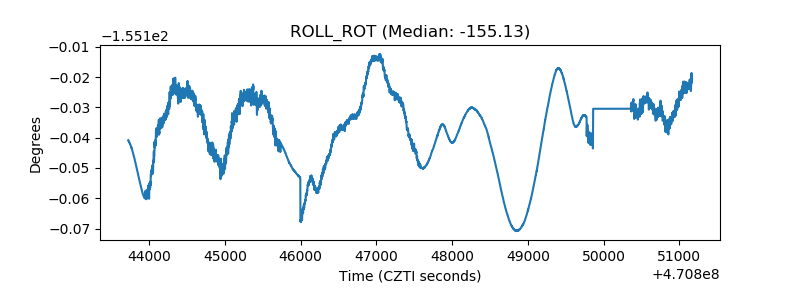 |
| _Roll_DEC | 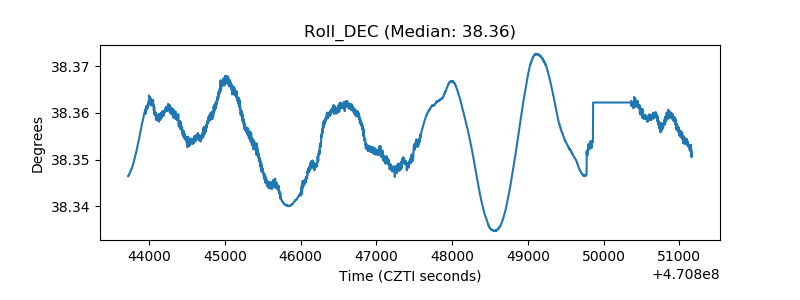 |
| _Roll_RA | 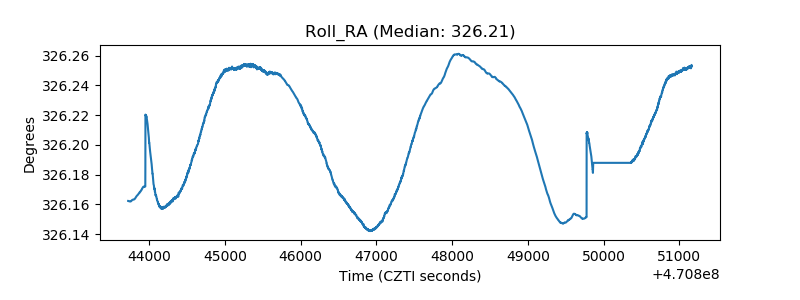 |
| Veto Counter | 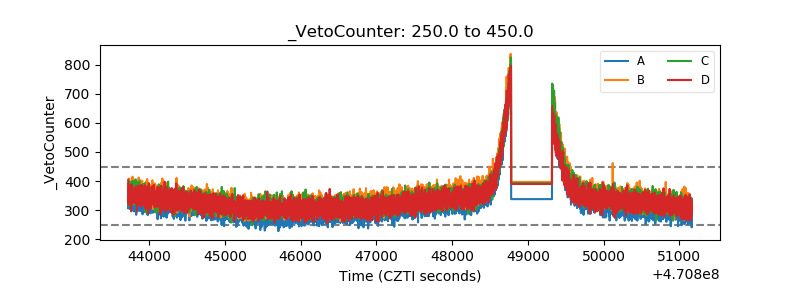 |