| Param | Original file | Final file |
|---|---|---|
| Filename | modeM0/AS1T05_233T01_9000006438_49655cztM0_level2.fits | modeM0/AS1T05_233T01_9000006438_49655cztM0_level2_quad_clean.evt |
| Size (bytes) | 1,337,791,680 | 41,448,960 |
| Size | 1.2 GB | 39.5 MB |
| Events in quadrant A | 17,590,502 | 75,116 |
| Events in quadrant B | 7,241,265 | 621,263 |
| Events in quadrant C | 8,312,575 | 4,711 |
| Events in quadrant D | 15,837,131 | 58,211 |
| Mode SS | |||
|---|---|---|---|
| Quadrant | BADHDUFLAG | Total packets | Discarded packets |
| A | 0 | 140 | 0 |
| B | 0 | 140 | 0 |
| C | 0 | 140 | 0 |
| D | 0 | 140 | 0 |
| Mode M0 | |||
|---|---|---|---|
| Quadrant | BADHDUFLAG | Total packets | Discarded packets |
| A | 0 | 56920 | 0 |
| B | 0 | 26367 | 0 |
| C | 0 | 29674 | 0 |
| D | 0 | 51809 | 0 |
| Quadrant | Total seconds | Saturated seconds | Saturation percentage |
|---|---|---|---|
| A | 6957 | 6957 | 100.000000% |
| B | 6958 | 1568 | 22.535211% |
| C | 6958 | 6958 | 100.000000% |
| D | 6957 | 6957 | 100.000000% |
Noise dominated data is calculated using 1-second bins in cleaned event files. If a bin has >2000 counts, and if more than 50% of those come from <1% of pixels, then it is considered to be noise-dominated and hence unusable.
| Quadrant | # 1 sec bins | Bins with >0 counts | Bins with >2000 counts | High rate bins dominated by noise | Noise dominated (total time) | Noise dominated (detector-on time) | Marked lightcurve |
|---|---|---|---|---|---|---|---|
| A | 6956 | 6956 | 6700 | 6700 | 96.32% | 96.32% | 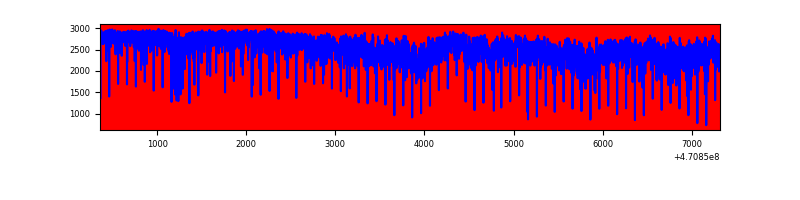 |
| B | 6957 | 6957 | 1436 | 1436 | 20.64% | 20.64% | 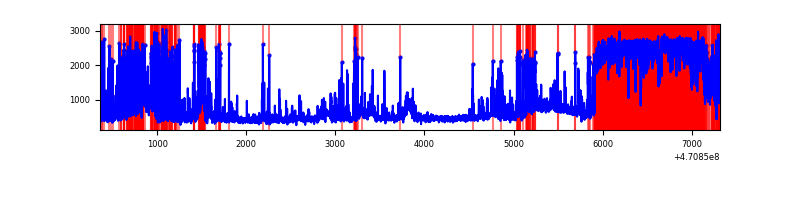 |
| C | 6957 | 6957 | 307 | 307 | 4.41% | 4.41% | 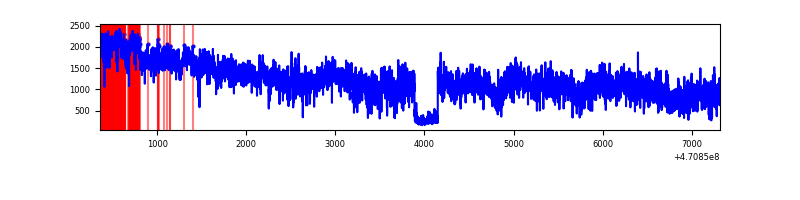 |
| D | 6956 | 6956 | 5451 | 5451 | 78.36% | 78.36% | 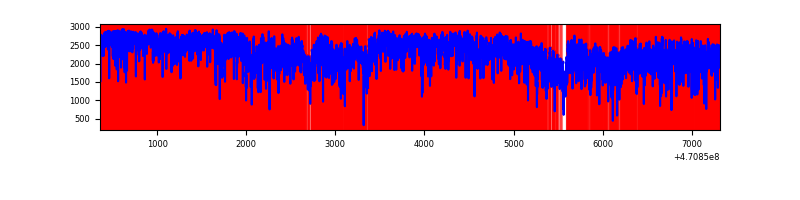 |
Top three noisy pixels from each quadrant. If the there are fewer than three noisy pixels in the level2.evt file, extra rows are filled as -1
| Pixel properties | Quadrant properties | ||||||
|---|---|---|---|---|---|---|---|
| Quadrant | DetID | PixID | Counts | Sigma | Mean | Median | Sigma |
| A | 0 | 99 | 7551954 | 149034.7 | 104 | 97 | 50.7 |
| A | 0 | 98 | 2064848 | 40747.53 | 104 | 97 | 50.7 |
| A | 10 | 83 | 1669521 | 32945.82 | 104 | 97 | 50.7 |
| B | 3 | 232 | 2962340 | 20603.52 | 668 | 645 | 143.7 |
| B | 4 | 206 | 355922 | 2471.54 | 668 | 645 | 143.7 |
| B | 10 | 44 | 234757 | 1628.64 | 668 | 645 | 143.7 |
| C | 15 | 180 | 1952593 | 116022.94 | 25 | 24 | 16.8 |
| C | 15 | 163 | 1317956 | 78312.39 | 25 | 24 | 16.8 |
| C | 15 | 197 | 886789 | 52692.16 | 25 | 24 | 16.8 |
| D | 15 | 40 | 2857547 | 56504.27 | 90 | 83 | 50.6 |
| D | 7 | 45 | 2797323 | 55313.38 | 90 | 83 | 50.6 |
| D | 15 | 184 | 1840758 | 36398.01 | 90 | 83 | 50.6 |
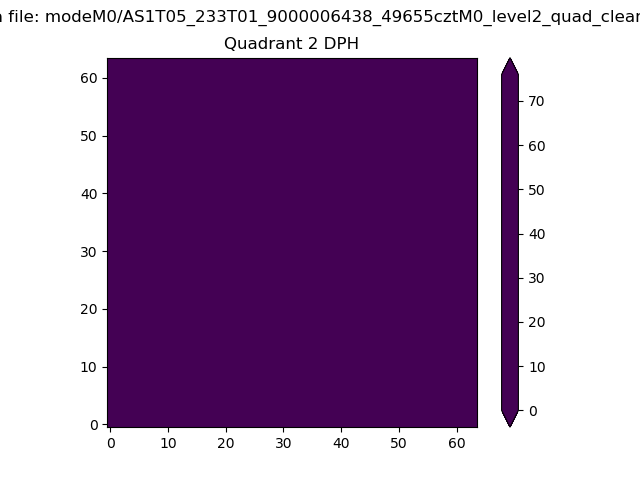
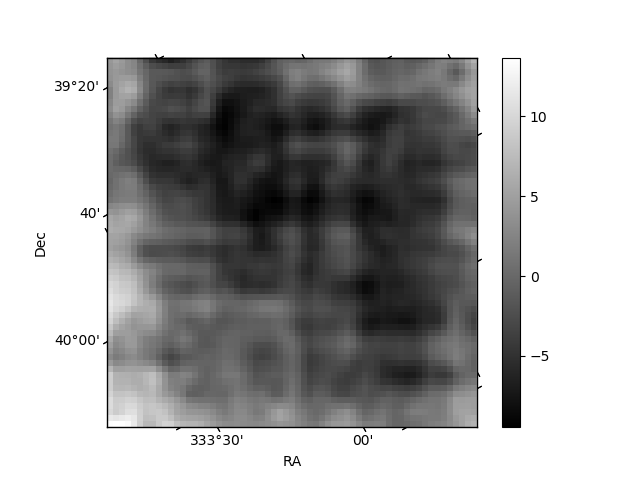
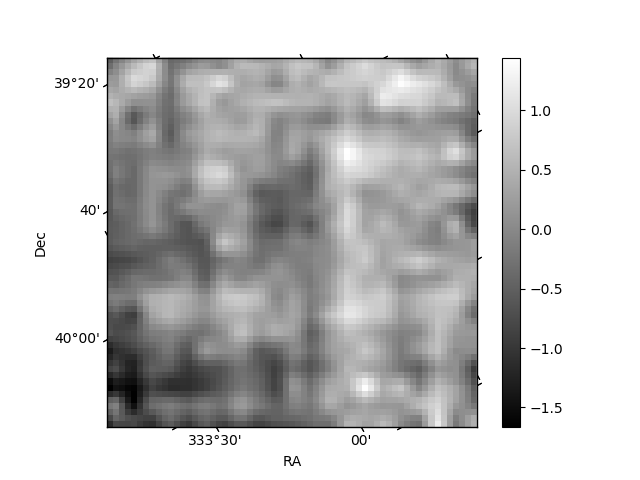
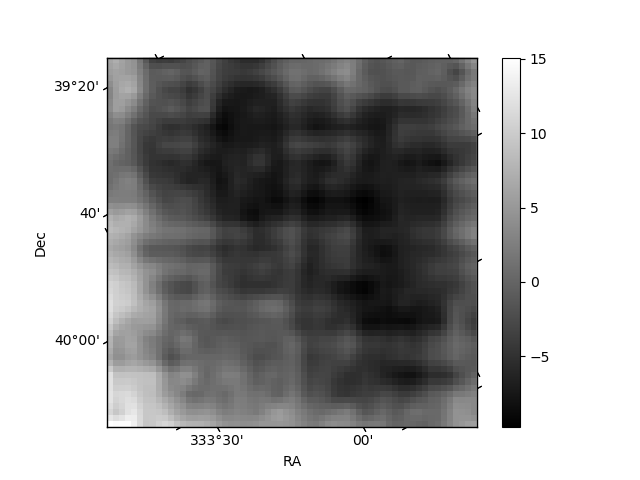
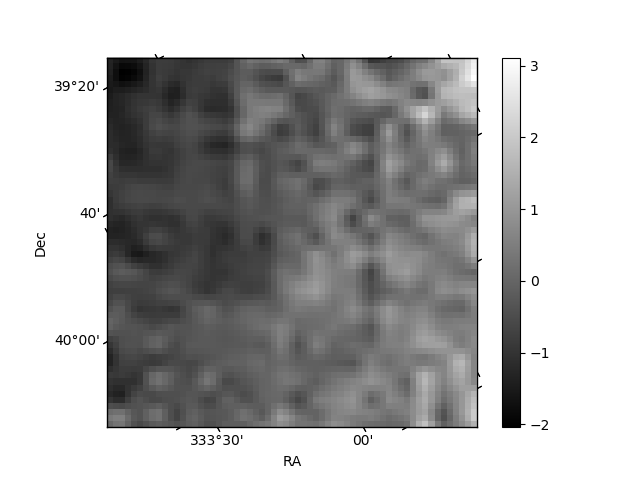
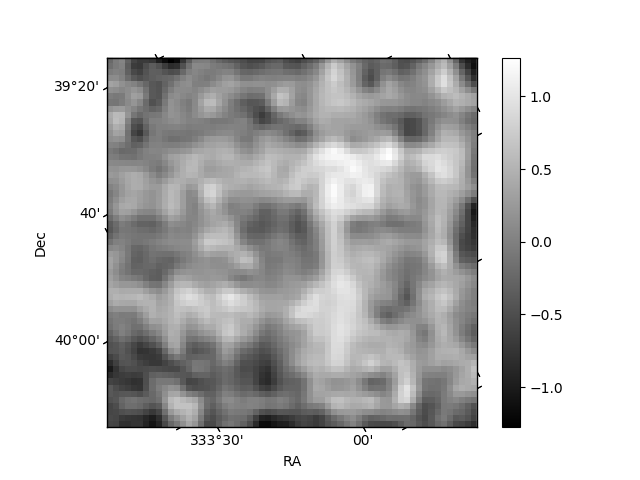
Histogram calculated using DETX and DETY for each event in the final _common_clean file
| Quadrant A | 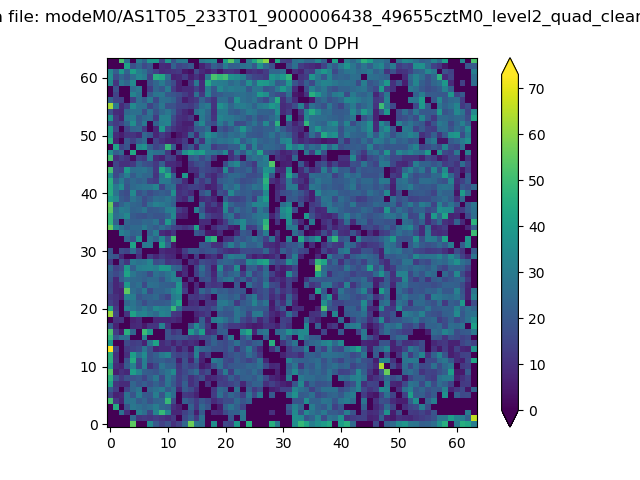 |
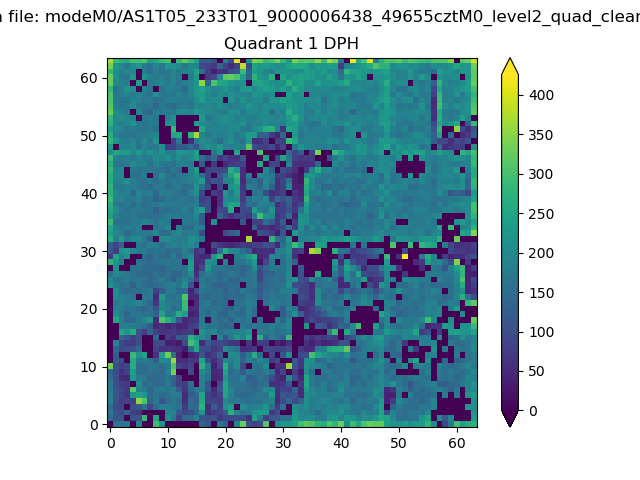 |
Quadrant B |
|---|---|---|---|
| Quadrant D | 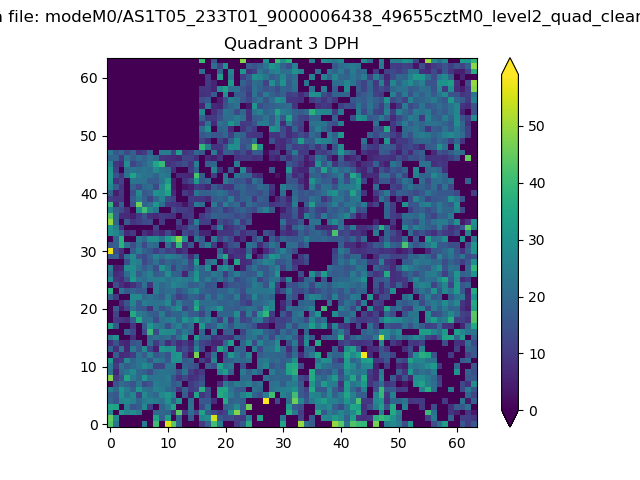 |
 |
Quadrant C |
| Plot type | Count rate plots | Images |
|---|---|---|
| Comparison with Poisson distribution Blue bars denote a histogram of data divided into 1 sec bins. Red curve is a Poisson curve with rate = median count rate of data. |
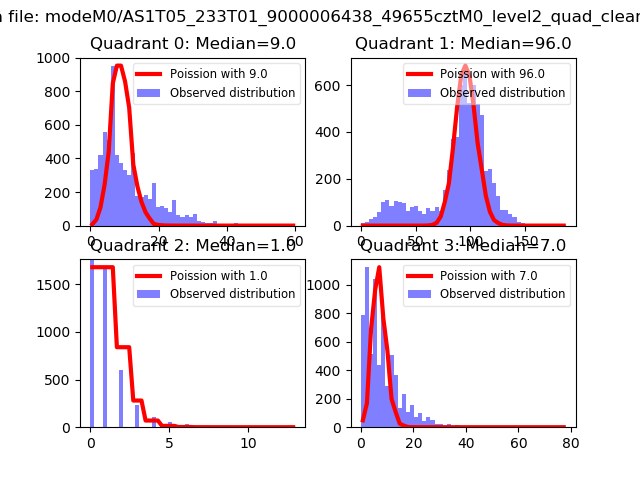 |
 |
| Quadrant-wise count rates Data is divided into 100 sec bins |
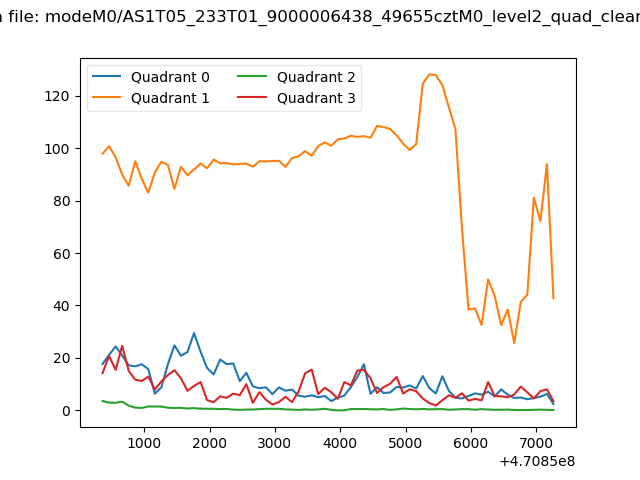 |
|
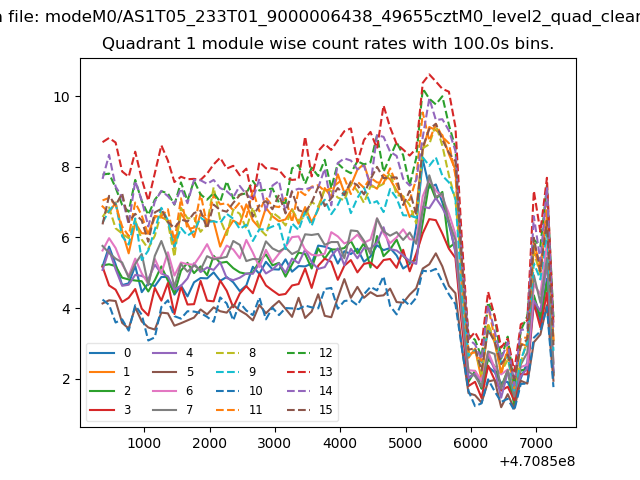
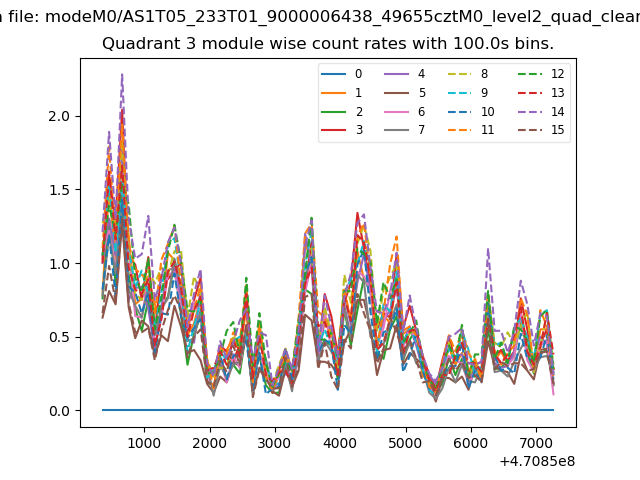
| Module-wise count rates for Quadrant A Data is divided into 100 sec bins |
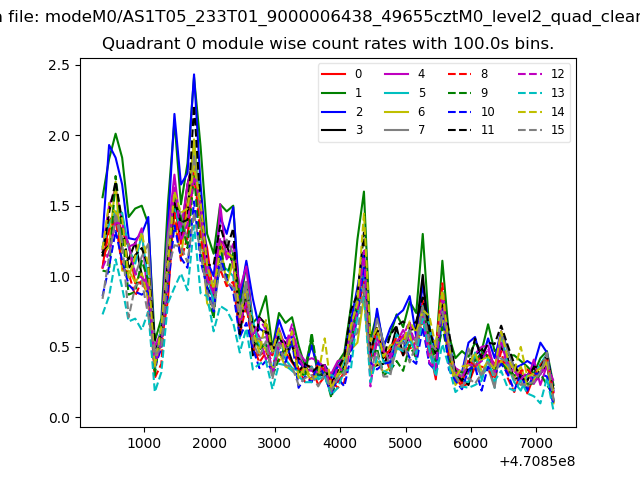 |
 |
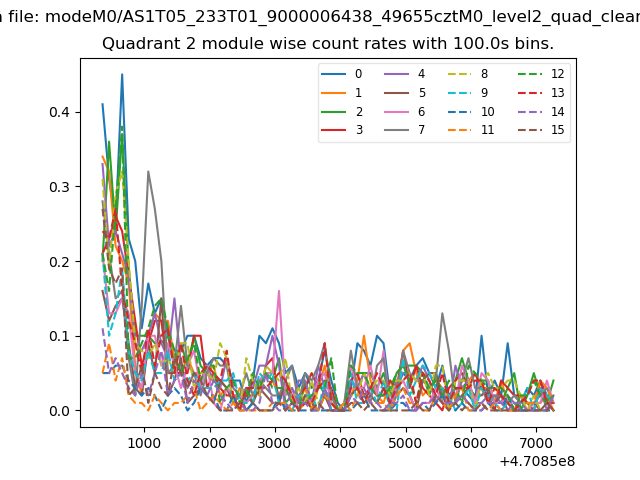
| Module-wise count rates for Quadrant B Data is divided into 100 sec bins |
 |
 |
| Module-wise count rates for Quadrant C Data is divided into 100 sec bins |
 |
 |
| Module-wise count rates for Quadrant D Data is divided into 100 sec bins |
 |
 |
| Parameter | Plot |
|---|---|
| CZT HV Monitor | 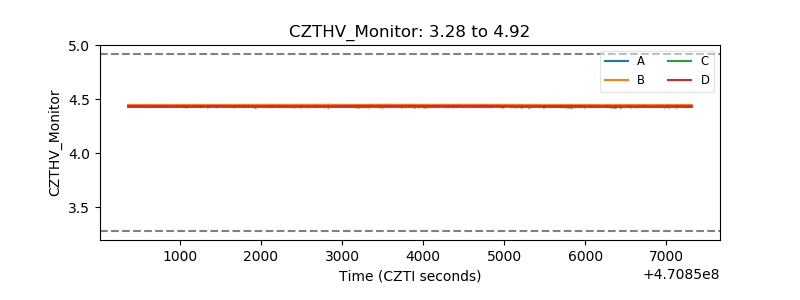 |
| D_VDD | 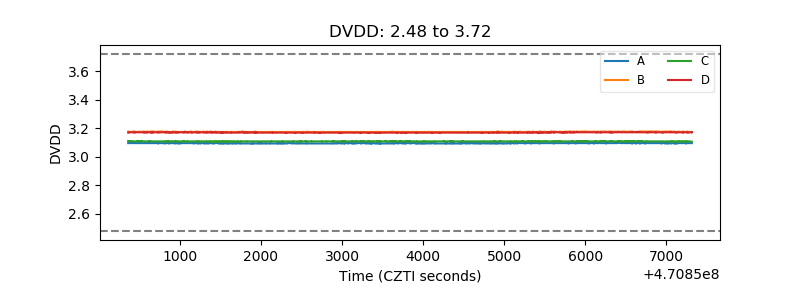 |
| Temperature 1 | 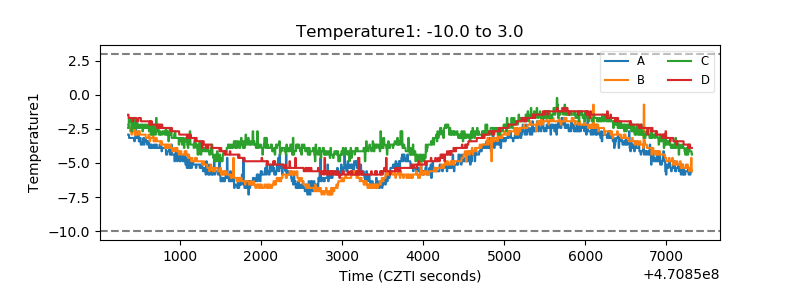 |
| Veto HV Monitor | 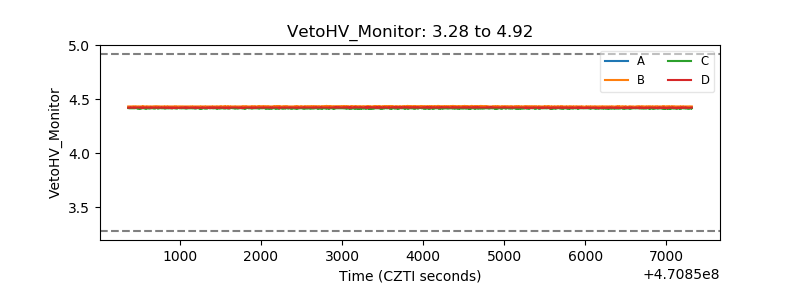 |
| Veto LLD | 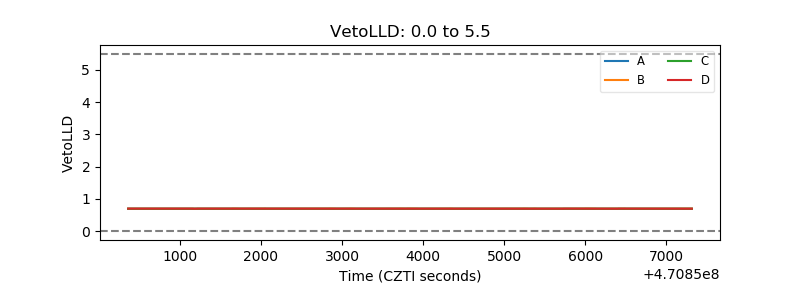 |
| Alpha Counter | 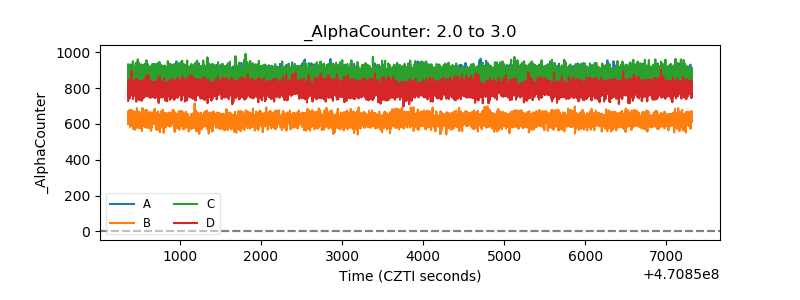 |
| _CPM_Rate | 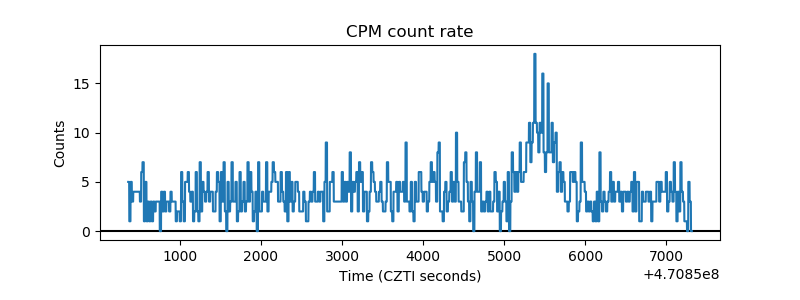 |
| CZT Counter | 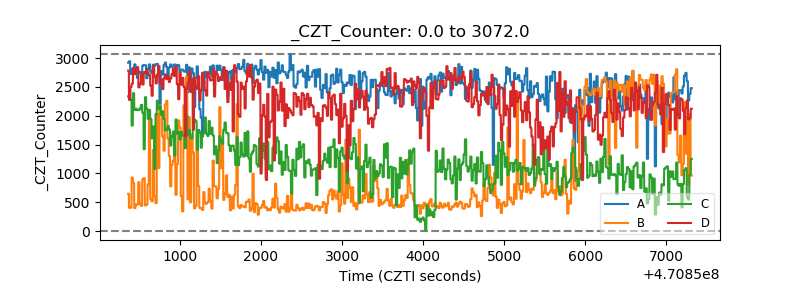 |
| +2.5 Volts monitor | 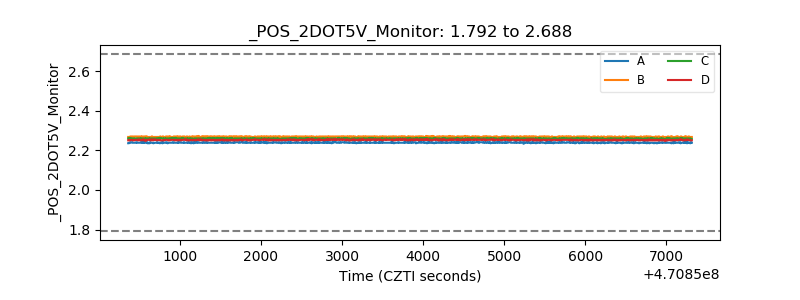 |
| +5 Volts monitor | 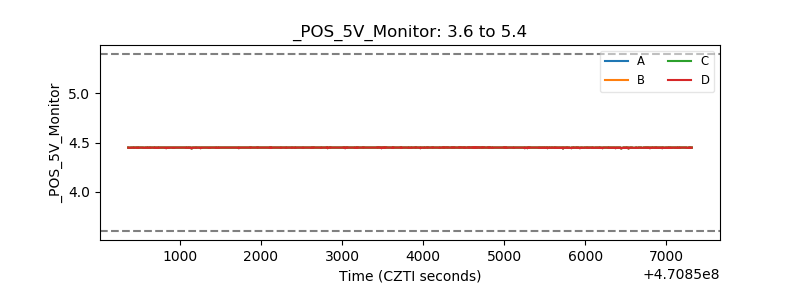 |
| _ROLL_ROT | 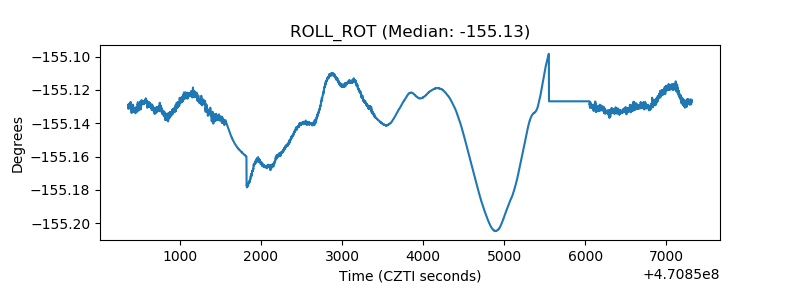 |
| _Roll_DEC | 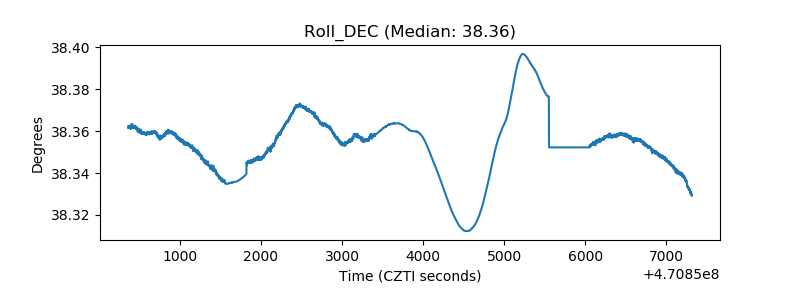 |
| _Roll_RA | 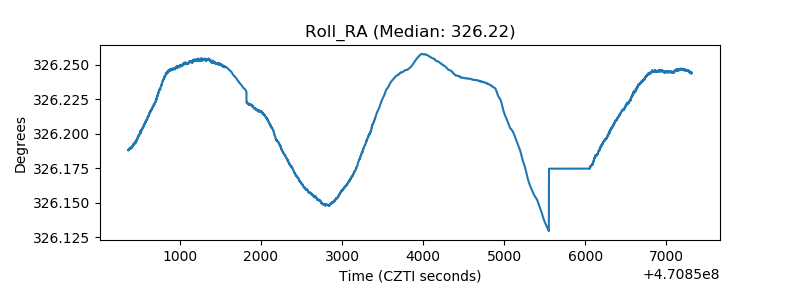 |
| Veto Counter | 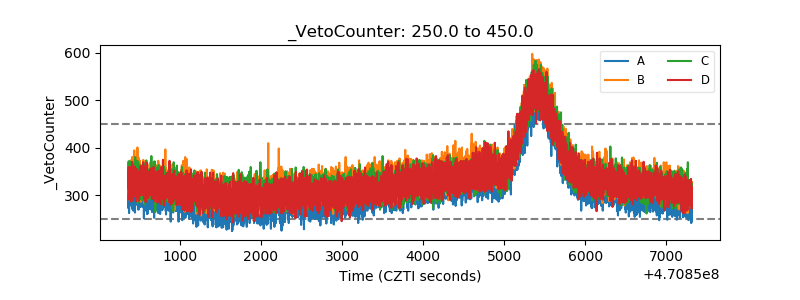 |