| Param | Original file | Final file |
|---|---|---|
| Filename | modeM0/AS1T05_233T01_9000006438_49656cztM0_level2.fits | modeM0/AS1T05_233T01_9000006438_49656cztM0_level2_quad_clean.evt |
| Size (bytes) | 1,301,503,680 | 39,617,280 |
| Size | 1.2 GB | 37.8 MB |
| Events in quadrant A | 16,485,017 | 29,790 |
| Events in quadrant B | 10,041,274 | 580,200 |
| Events in quadrant C | 4,919,985 | 3,049 |
| Events in quadrant D | 16,148,455 | 53,743 |
| Mode SS | |||
|---|---|---|---|
| Quadrant | BADHDUFLAG | Total packets | Discarded packets |
| A | 0 | 150 | 0 |
| B | 0 | 150 | 0 |
| C | 0 | 150 | 0 |
| D | 0 | 150 | 0 |
| Mode M0 | |||
|---|---|---|---|
| Quadrant | BADHDUFLAG | Total packets | Discarded packets |
| A | 0 | 54018 | 0 |
| B | 0 | 34932 | 0 |
| C | 0 | 19953 | 0 |
| D | 0 | 53046 | 0 |
| Quadrant | Total seconds | Saturated seconds | Saturation percentage |
|---|---|---|---|
| A | 7476 | 7476 | 100.000000% |
| B | 7476 | 2853 | 38.162119% |
| C | 7477 | 7477 | 100.000000% |
| D | 7477 | 7477 | 100.000000% |
Noise dominated data is calculated using 1-second bins in cleaned event files. If a bin has >2000 counts, and if more than 50% of those come from <1% of pixels, then it is considered to be noise-dominated and hence unusable.
| Quadrant | # 1 sec bins | Bins with >0 counts | Bins with >2000 counts | High rate bins dominated by noise | Noise dominated (total time) | Noise dominated (detector-on time) | Marked lightcurve |
|---|---|---|---|---|---|---|---|
| A | 7475 | 7475 | 5538 | 5538 | 74.09% | 74.09% | 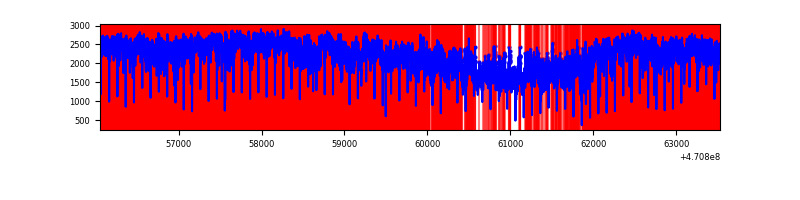 |
| B | 7477 | 7476 | 2687 | 2687 | 35.94% | 35.94% | 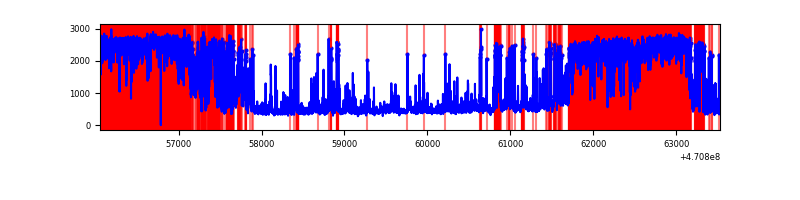 |
| C | 7476 | 7476 | 0 | 0 | 0.00% | 0.00% | 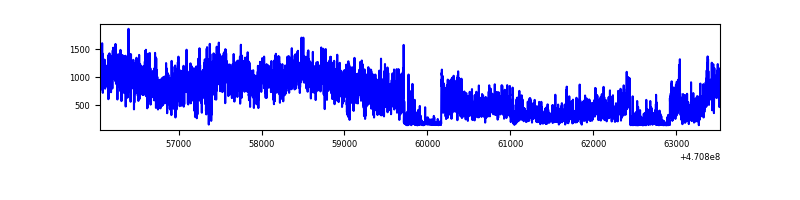 |
| D | 7476 | 7476 | 5396 | 5396 | 72.18% | 72.18% | 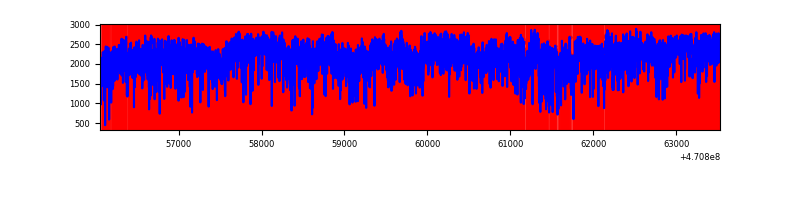 |
Top three noisy pixels from each quadrant. If the there are fewer than three noisy pixels in the level2.evt file, extra rows are filled as -1
| Pixel properties | Quadrant properties | ||||||
|---|---|---|---|---|---|---|---|
| Quadrant | DetID | PixID | Counts | Sigma | Mean | Median | Sigma |
| A | 0 | 99 | 9377233 | 209700.4 | 59 | 53 | 44.7 |
| A | 0 | 98 | 1143375 | 25567.93 | 59 | 53 | 44.7 |
| A | 10 | 83 | 1087576 | 24320.11 | 59 | 53 | 44.7 |
| B | 3 | 232 | 4632162 | 34586.6 | 619 | 600 | 133.9 |
| B | 3 | 216 | 631283 | 4709.68 | 619 | 600 | 133.9 |
| B | 4 | 206 | 626444 | 4673.55 | 619 | 600 | 133.9 |
| C | 4 | 210 | 909932 | 106162.26 | 9 | 8 | 8.6 |
| C | 15 | 163 | 627051 | 73158.09 | 9 | 8 | 8.6 |
| C | 15 | 180 | 558453 | 65154.66 | 9 | 8 | 8.6 |
| D | 15 | 40 | 2819437 | 42826.34 | 87 | 78 | 65.8 |
| D | 15 | 184 | 2577822 | 39156.19 | 87 | 78 | 65.8 |
| D | 7 | 45 | 2573400 | 39089.02 | 87 | 78 | 65.8 |
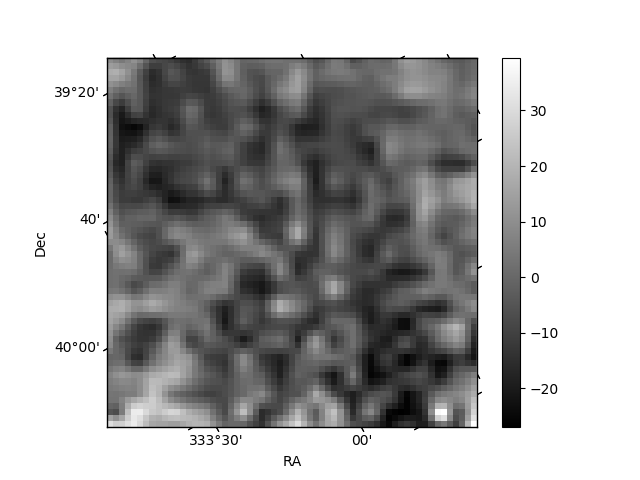
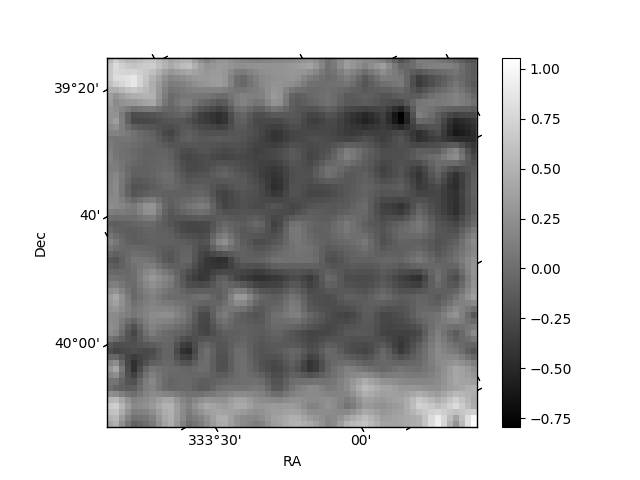
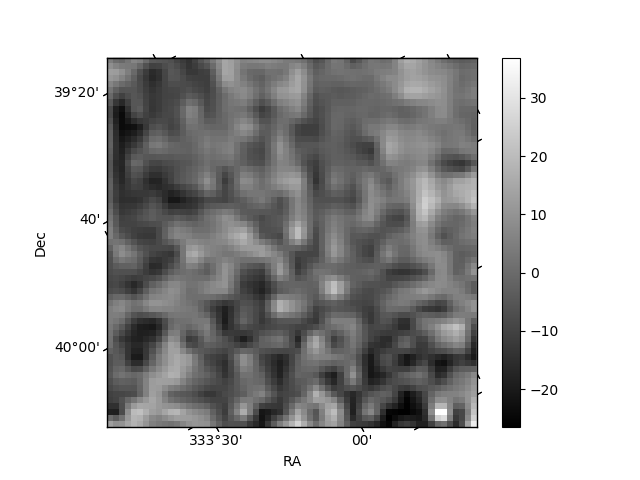
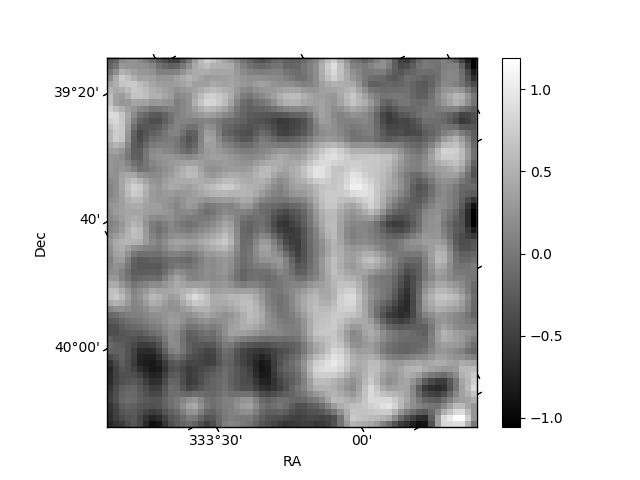
Histogram calculated using DETX and DETY for each event in the final _common_clean file
| Quadrant A | 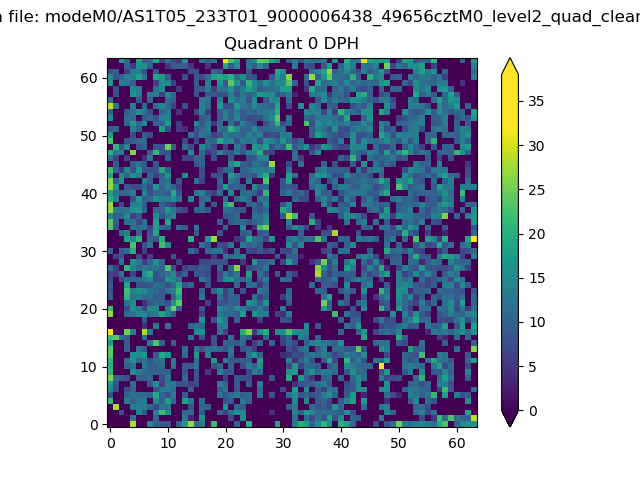 |
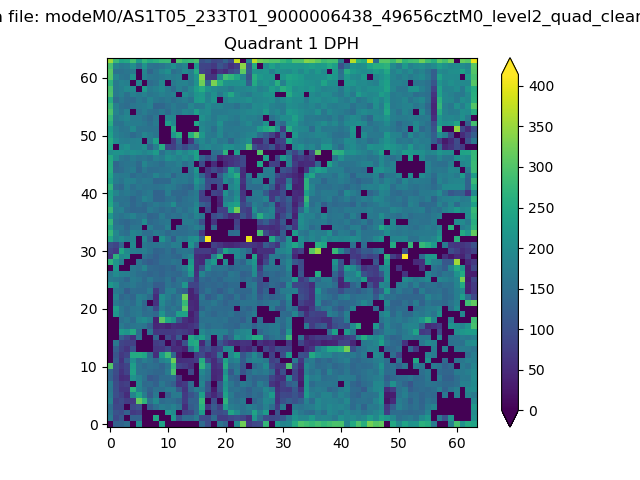 |
Quadrant B |
|---|---|---|---|
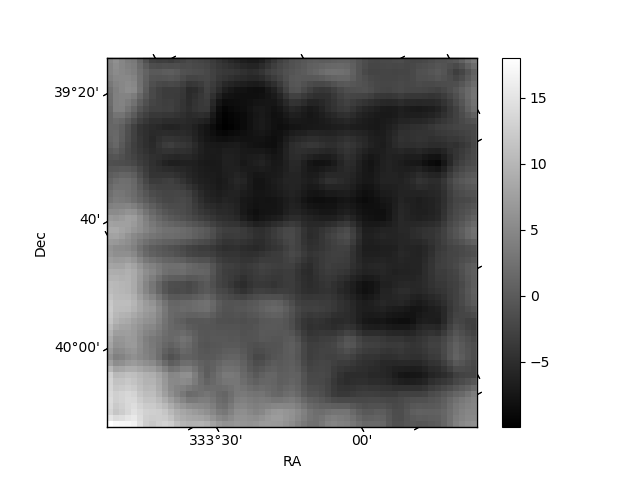
| Quadrant D | 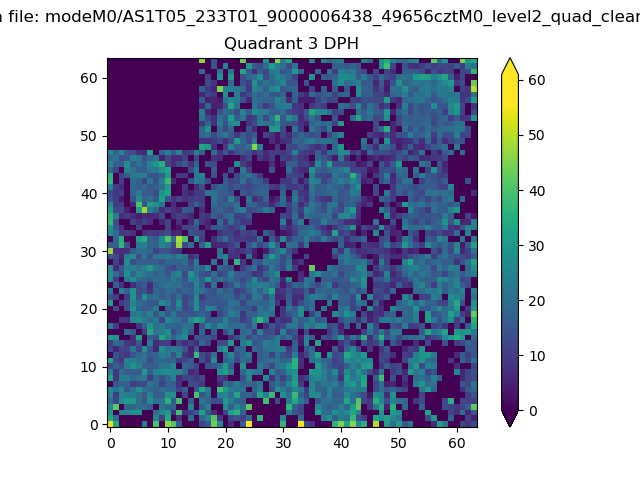 |
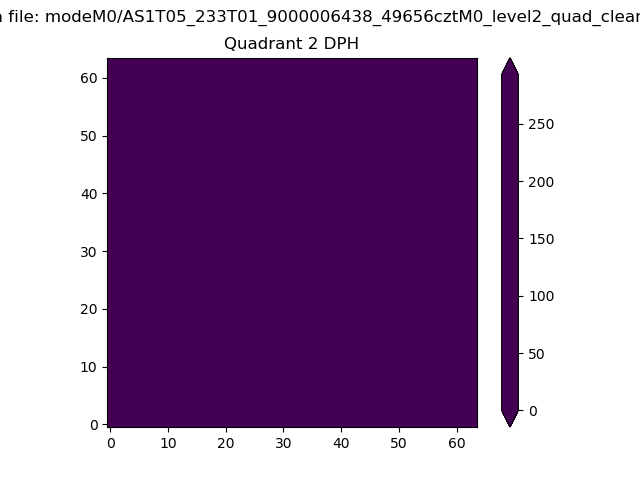 |
Quadrant C |
| Plot type | Count rate plots | Images |
|---|---|---|
| Comparison with Poisson distribution Blue bars denote a histogram of data divided into 1 sec bins. Red curve is a Poisson curve with rate = median count rate of data. |
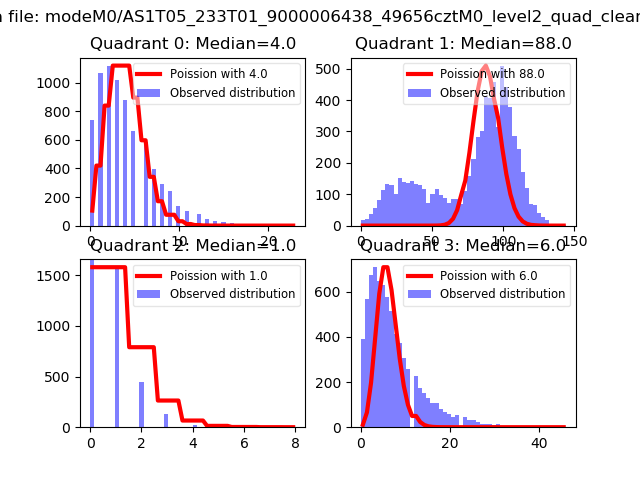 |
 |
| Quadrant-wise count rates Data is divided into 100 sec bins |
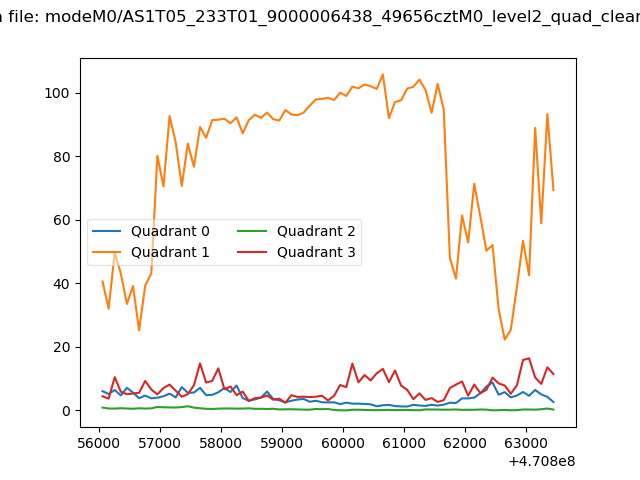 |
|
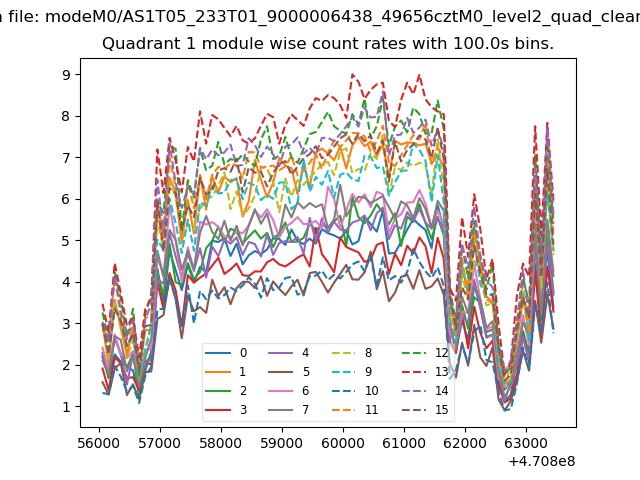
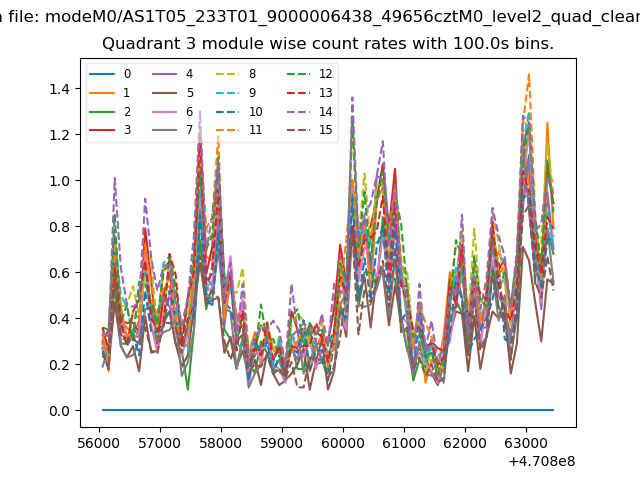
| Module-wise count rates for Quadrant A Data is divided into 100 sec bins |
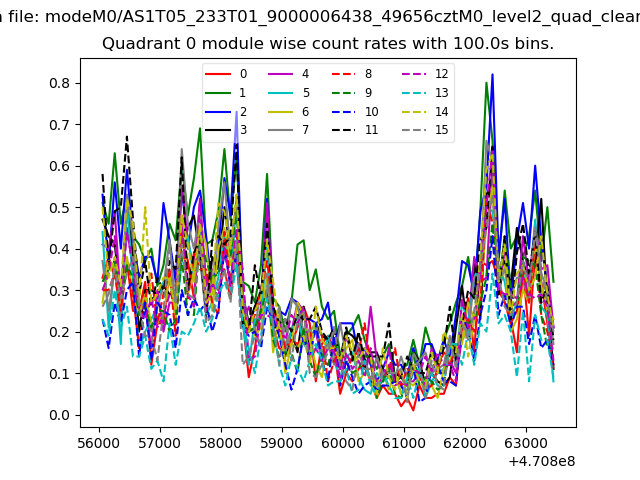 |
 |
| Module-wise count rates for Quadrant B Data is divided into 100 sec bins |
 |
 |
| Module-wise count rates for Quadrant C Data is divided into 100 sec bins |
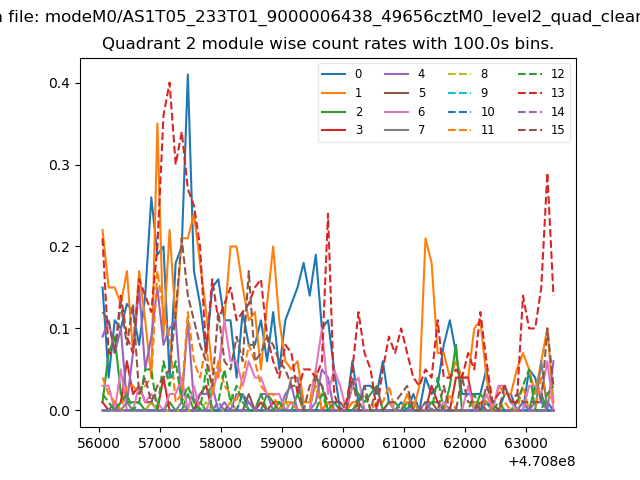 |
 |
| Module-wise count rates for Quadrant D Data is divided into 100 sec bins |
 |
 |
| Parameter | Plot |
|---|---|
| CZT HV Monitor | 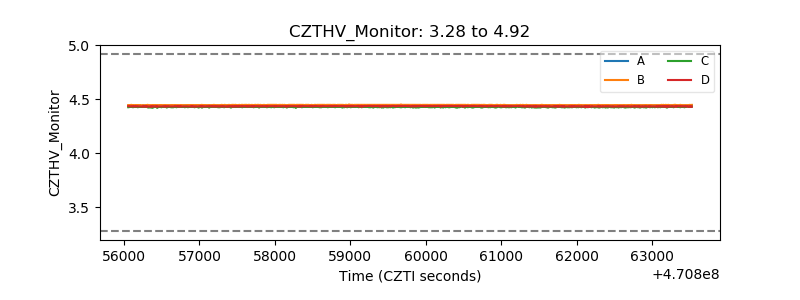 |
| D_VDD | 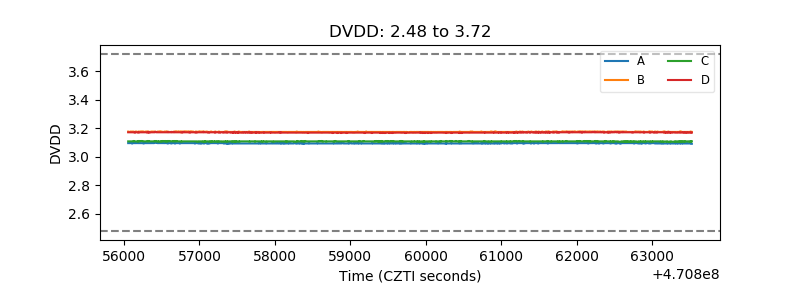 |
| Temperature 1 | 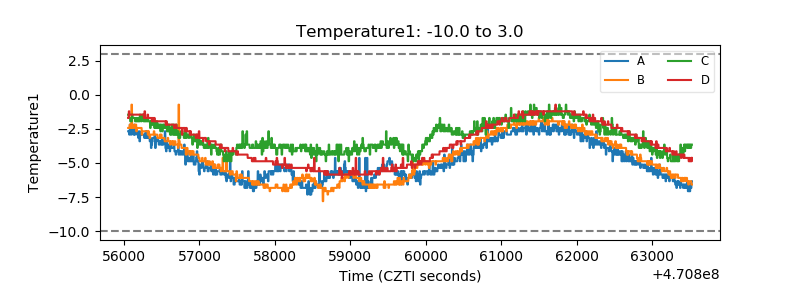 |
| Veto HV Monitor |  |
| Veto LLD | 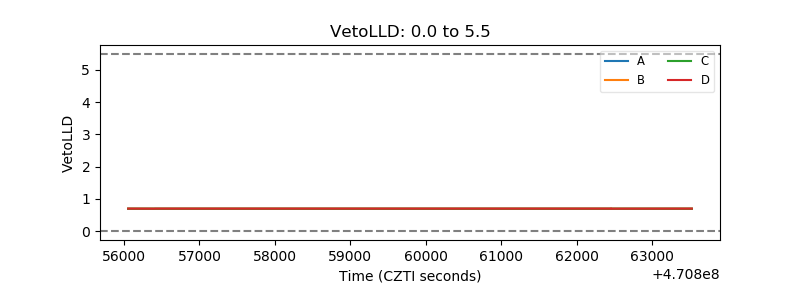 |
| Alpha Counter | 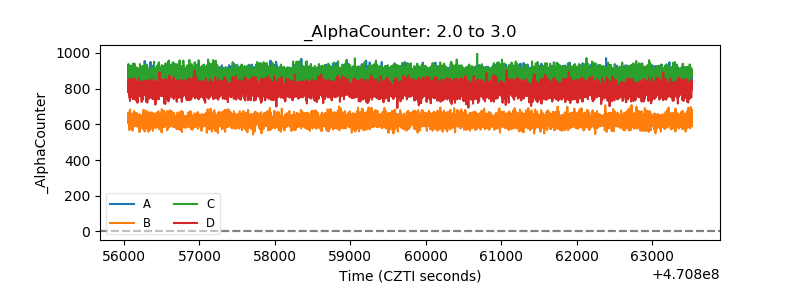 |
| _CPM_Rate | 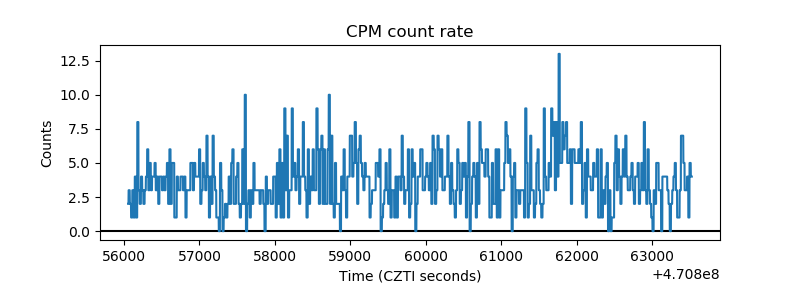 |
| CZT Counter | 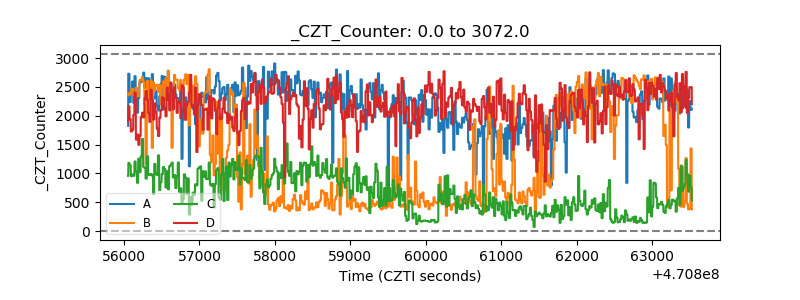 |
| +2.5 Volts monitor | 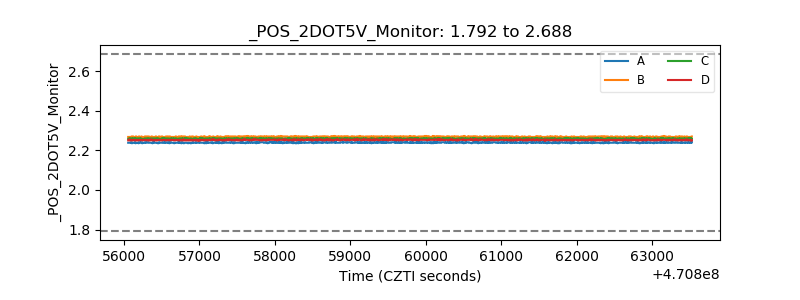 |
| +5 Volts monitor | 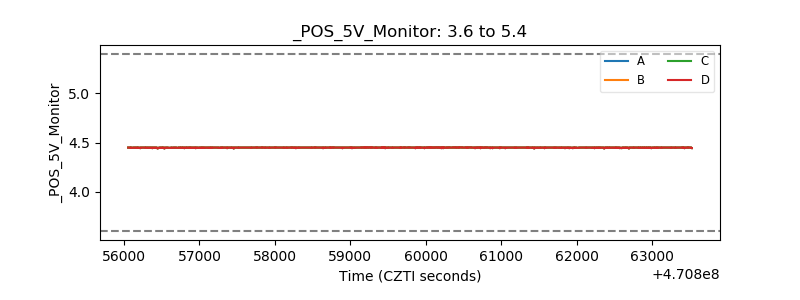 |
| _ROLL_ROT | 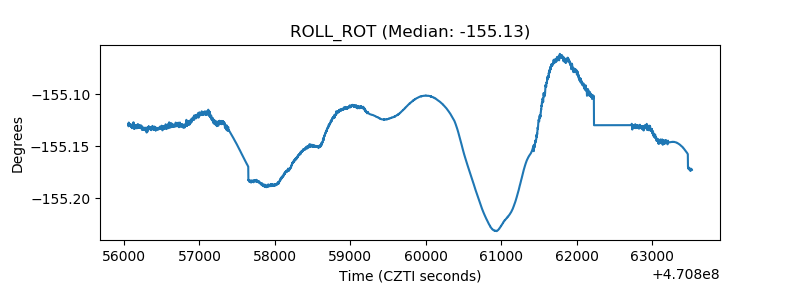 |
| _Roll_DEC | 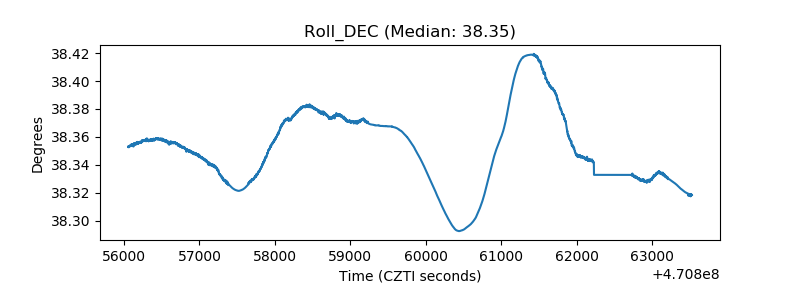 |
| _Roll_RA | 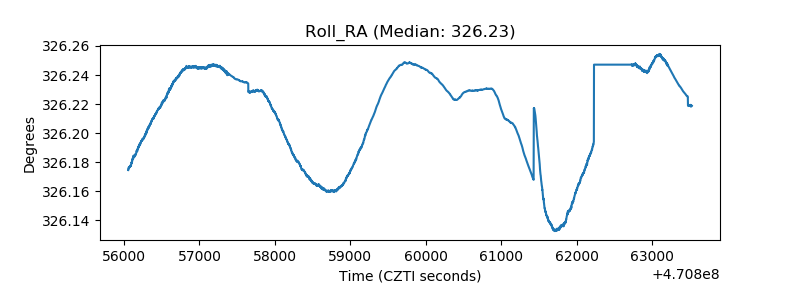 |
| Veto Counter | 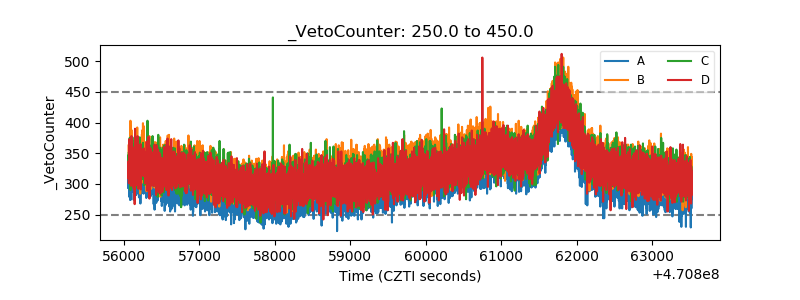 |