| Param | Original file | Final file |
|---|---|---|
| Filename | modeM0/AS1T05_233T01_9000006438_49657cztM0_level2.fits | modeM0/AS1T05_233T01_9000006438_49657cztM0_level2_quad_clean.evt |
| Size (bytes) | 1,058,639,040 | 38,157,120 |
| Size | 1009.6 MB | 36.4 MB |
| Events in quadrant A | 11,647,676 | 6,077 |
| Events in quadrant B | 7,506,380 | 595,812 |
| Events in quadrant C | 4,273,708 | 2,859 |
| Events in quadrant D | 15,209,310 | 49,548 |
| Mode SS | |||
|---|---|---|---|
| Quadrant | BADHDUFLAG | Total packets | Discarded packets |
| A | 0 | 144 | 0 |
| B | 0 | 142 | 0 |
| C | 0 | 144 | 0 |
| D | 0 | 144 | 0 |
| Mode M0 | |||
|---|---|---|---|
| Quadrant | BADHDUFLAG | Total packets | Discarded packets |
| A | 0 | 39483 | 0 |
| B | 0 | 27128 | 0 |
| C | 0 | 17723 | 0 |
| D | 0 | 49934 | 0 |
| Quadrant | Total seconds | Saturated seconds | Saturation percentage |
|---|---|---|---|
| A | 7010 | 7010 | 100.000000% |
| B | 7050 | 1892 | 26.836879% |
| C | 7077 | 7077 | 100.000000% |
| D | 6966 | 6966 | 100.000000% |
Noise dominated data is calculated using 1-second bins in cleaned event files. If a bin has >2000 counts, and if more than 50% of those come from <1% of pixels, then it is considered to be noise-dominated and hence unusable.
| Quadrant | # 1 sec bins | Bins with >0 counts | Bins with >2000 counts | High rate bins dominated by noise | Noise dominated (total time) | Noise dominated (detector-on time) | Marked lightcurve |
|---|---|---|---|---|---|---|---|
| A | 7155 | 7009 | 1554 | 1554 | 21.72% | 22.17% | 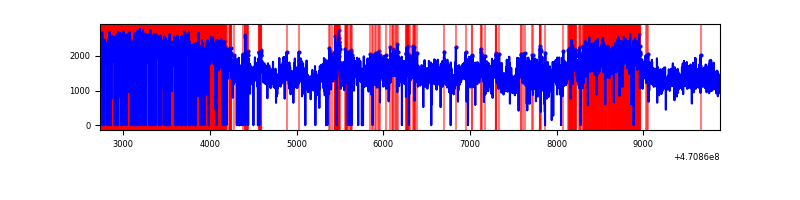 |
| B | 7157 | 7089 | 1689 | 1689 | 23.60% | 23.83% | 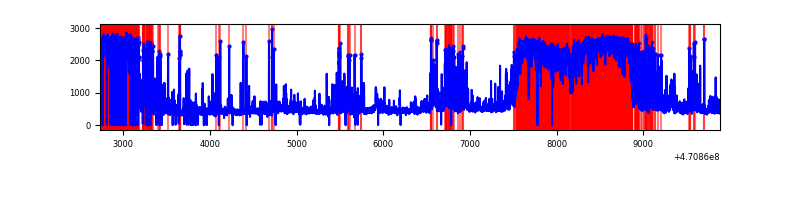 |
| C | 7155 | 7076 | 0 | 0 | 0.00% | 0.00% | 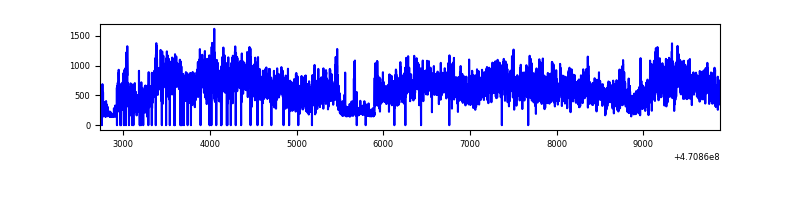 |
| D | 7154 | 6965 | 5105 | 5105 | 71.36% | 73.30% | 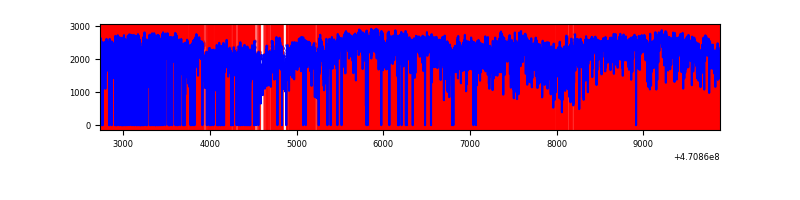 |
Top three noisy pixels from each quadrant. If the there are fewer than three noisy pixels in the level2.evt file, extra rows are filled as -1
| Pixel properties | Quadrant properties | ||||||
|---|---|---|---|---|---|---|---|
| Quadrant | DetID | PixID | Counts | Sigma | Mean | Median | Sigma |
| A | 0 | 99 | 8358835 | 289606.07 | 33 | 29 | 28.9 |
| A | 10 | 83 | 822488 | 28495.59 | 33 | 29 | 28.9 |
| A | 12 | 50 | 431715 | 14956.55 | 33 | 29 | 28.9 |
| B | 3 | 232 | 2724348 | 20108.94 | 633 | 612 | 135.4 |
| B | 3 | 216 | 719483 | 5307.32 | 633 | 612 | 135.4 |
| B | 4 | 206 | 552365 | 4073.51 | 633 | 612 | 135.4 |
| C | 4 | 210 | 1339469 | 123835.88 | 7 | 6 | 10.8 |
| C | 15 | 198 | 518836 | 47966.81 | 7 | 6 | 10.8 |
| C | 15 | 181 | 437902 | 40484.31 | 7 | 6 | 10.8 |
| D | 15 | 184 | 2957874 | 44915.59 | 82 | 73 | 65.9 |
| D | 15 | 40 | 2425177 | 36826.34 | 82 | 73 | 65.9 |
| D | 7 | 45 | 1266405 | 19229.84 | 82 | 73 | 65.9 |
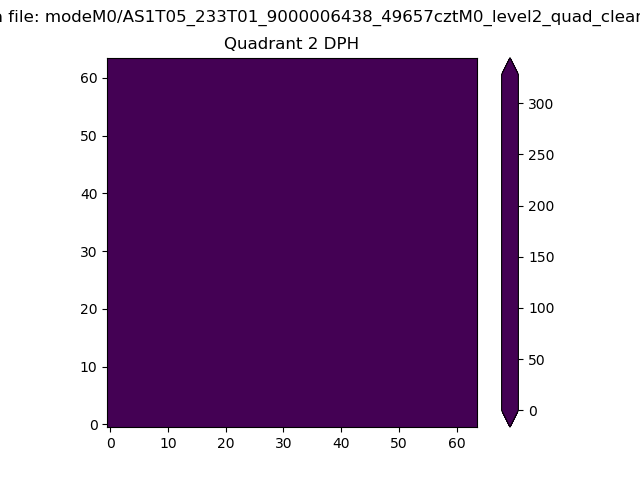
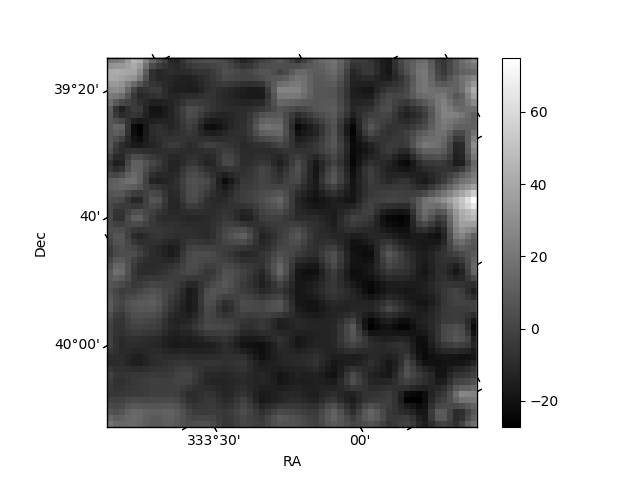
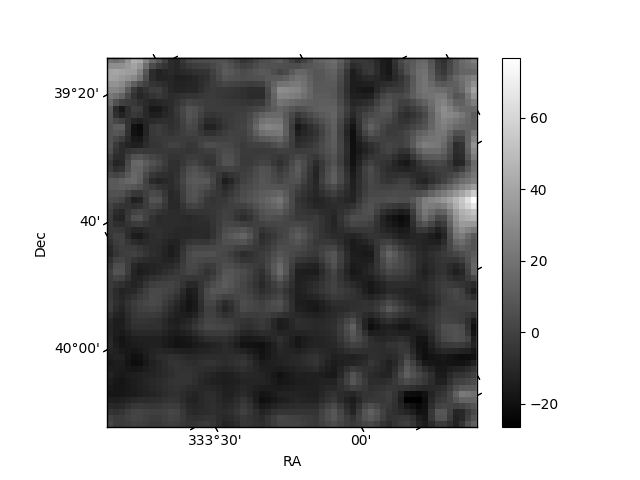
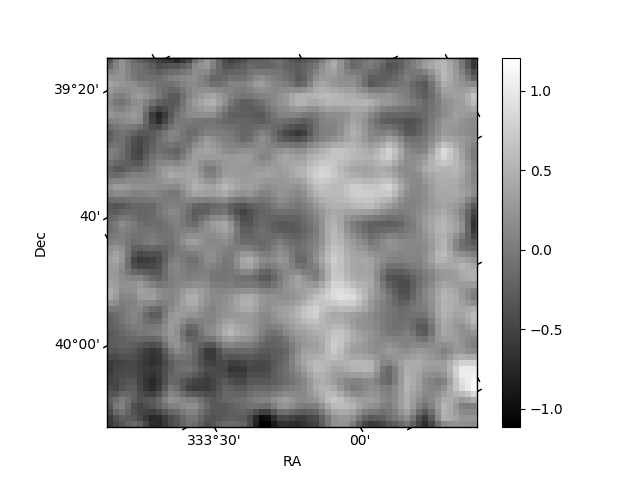
Histogram calculated using DETX and DETY for each event in the final _common_clean file
| Quadrant A | 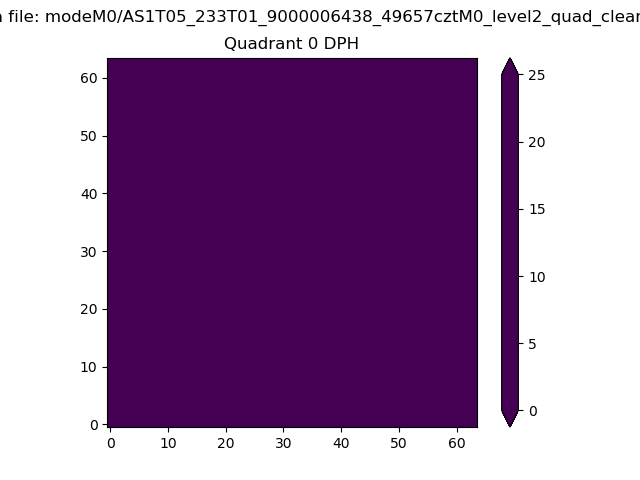 |
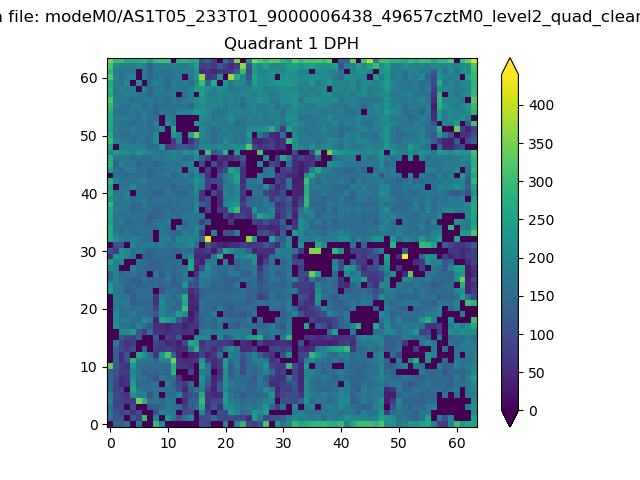 |
Quadrant B |
|---|---|---|---|
| Quadrant D | 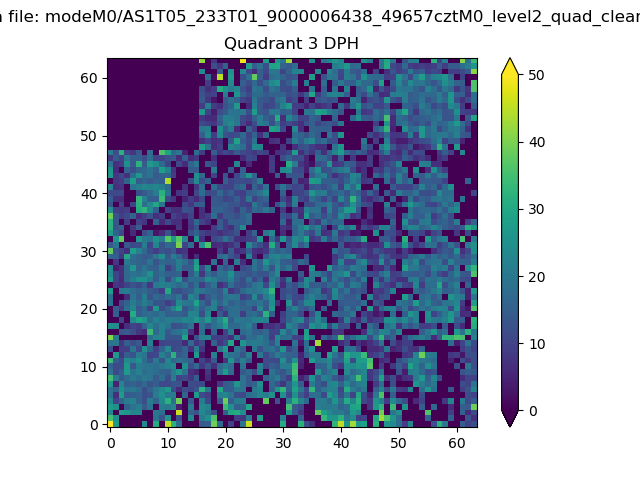 |
 |
Quadrant C |
| Plot type | Count rate plots | Images |
|---|---|---|
| Comparison with Poisson distribution Blue bars denote a histogram of data divided into 1 sec bins. Red curve is a Poisson curve with rate = median count rate of data. |
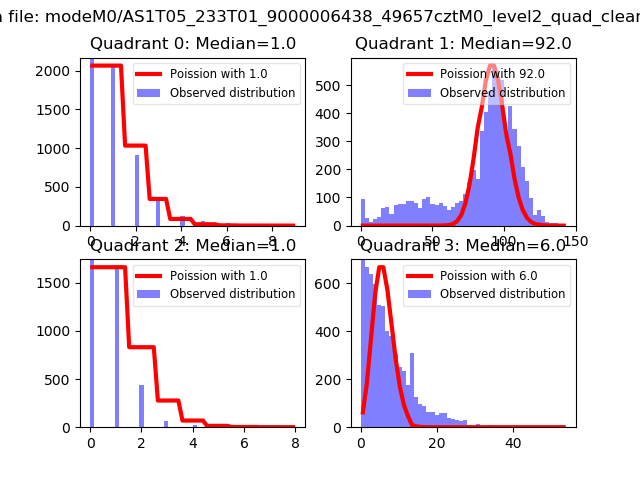 |
 |
| Quadrant-wise count rates Data is divided into 100 sec bins |
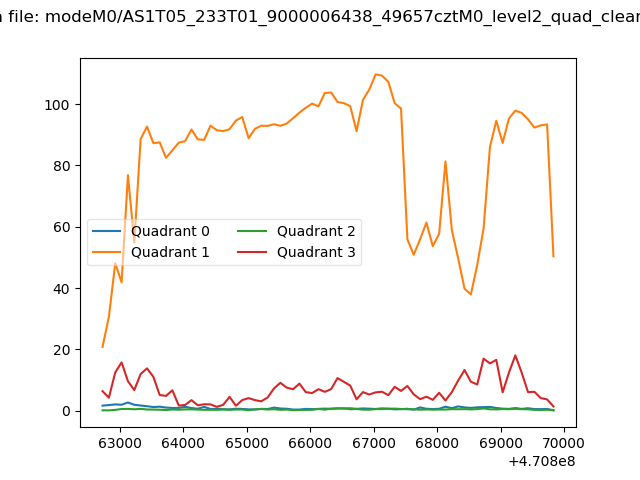 |
|
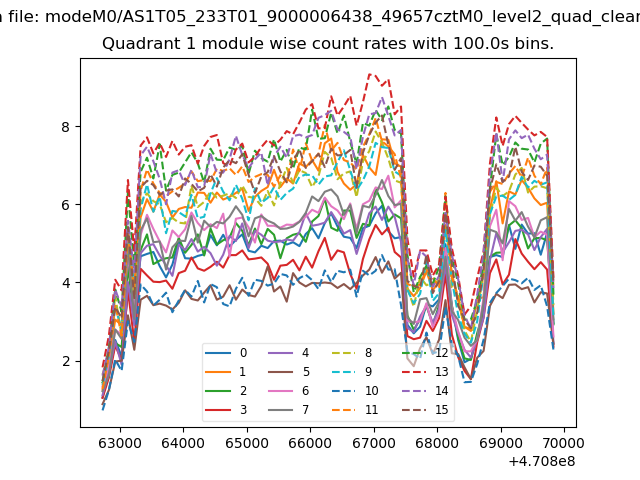
| Module-wise count rates for Quadrant A Data is divided into 100 sec bins |
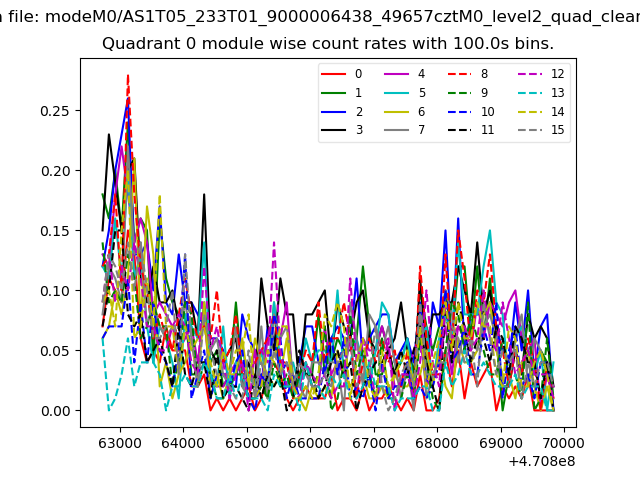 |
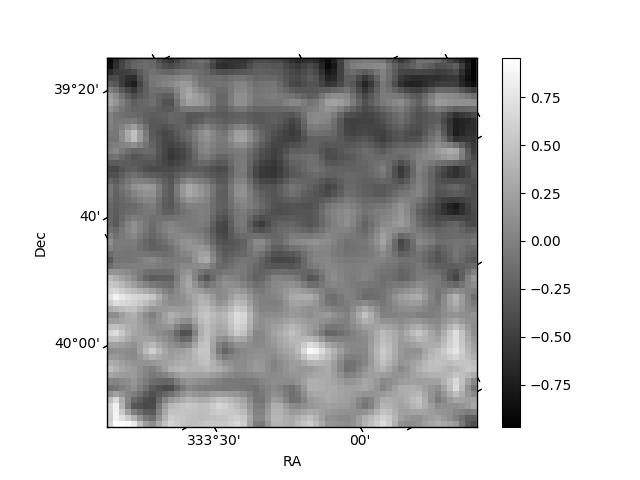 |
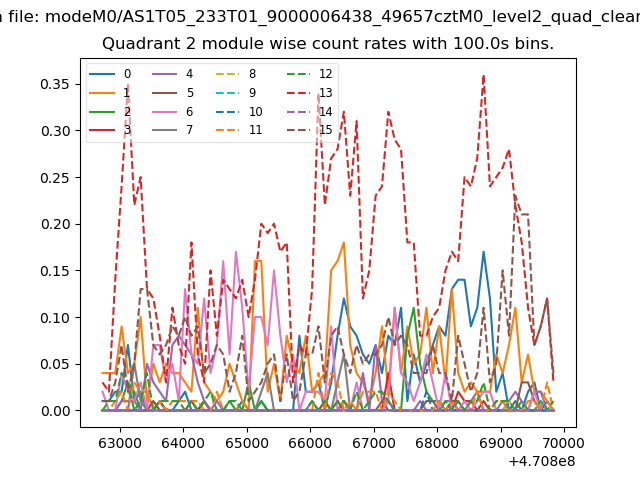
| Module-wise count rates for Quadrant B Data is divided into 100 sec bins |
 |
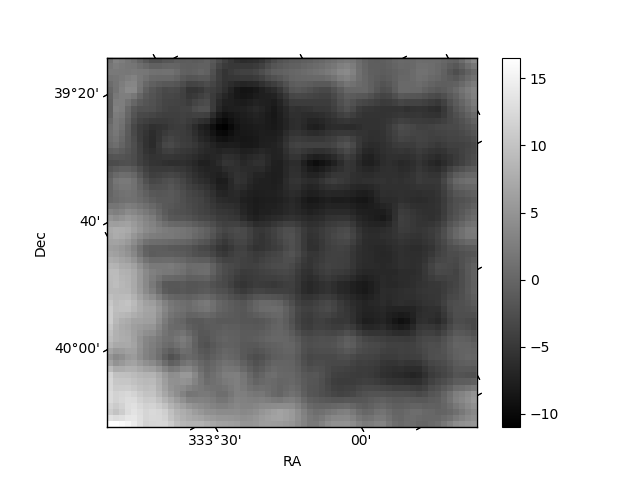 |
| Module-wise count rates for Quadrant C Data is divided into 100 sec bins |
 |
 |
| Module-wise count rates for Quadrant D Data is divided into 100 sec bins |
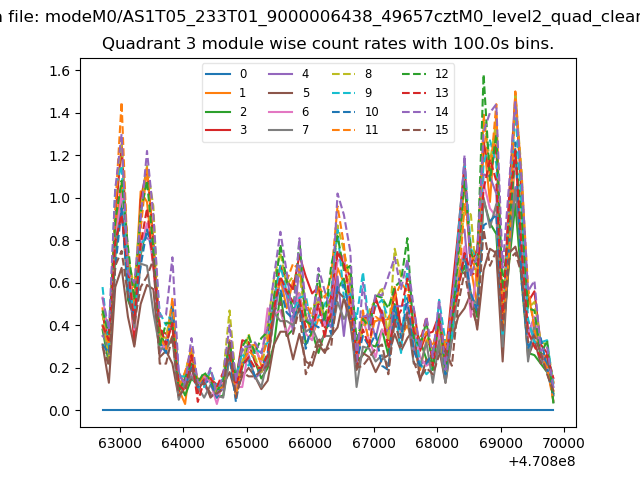 |
 |
| Parameter | Plot |
|---|---|
| CZT HV Monitor | 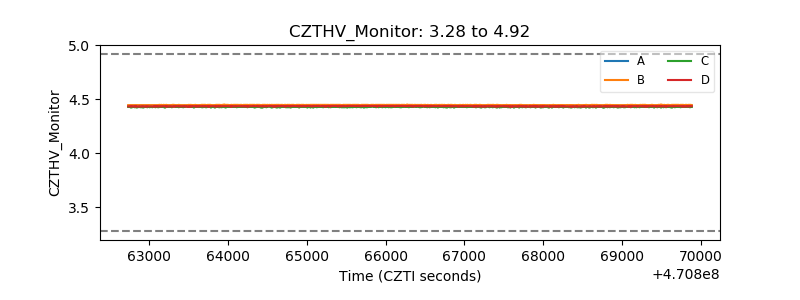 |
| D_VDD | 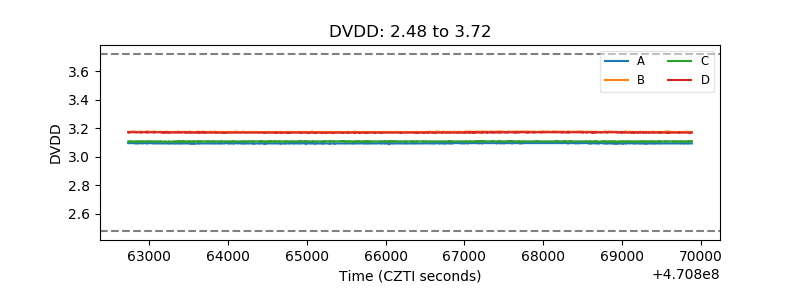 |
| Temperature 1 | 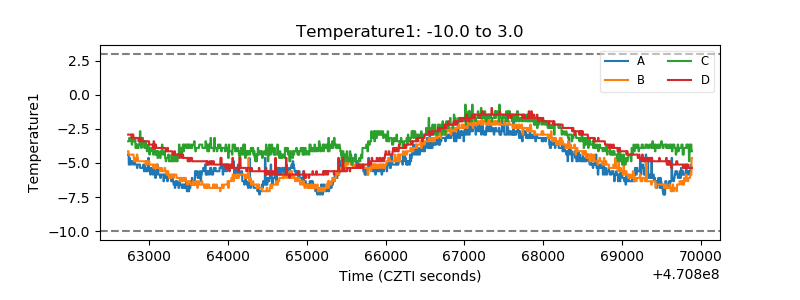 |
| Veto HV Monitor | 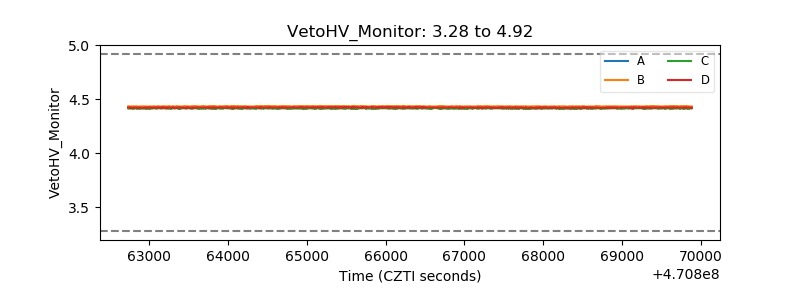 |
| Veto LLD | 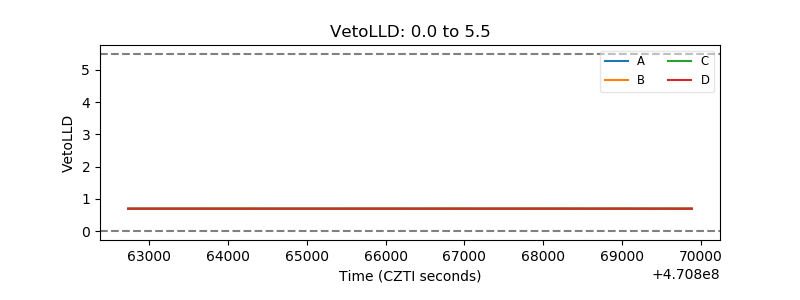 |
| Alpha Counter | 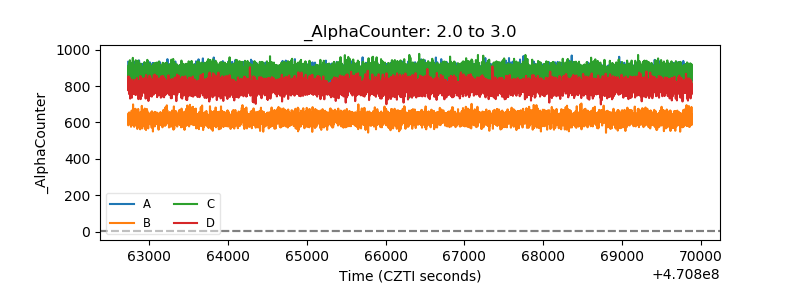 |
| _CPM_Rate | 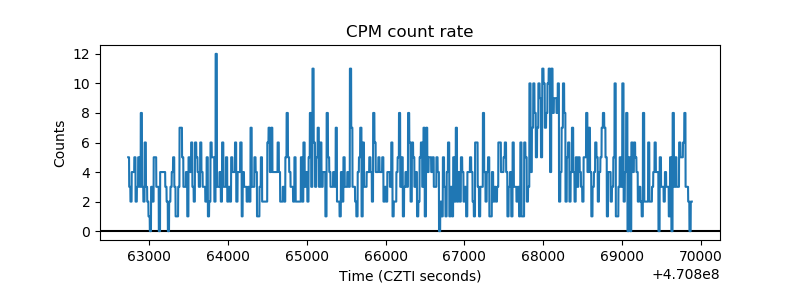 |
| CZT Counter | 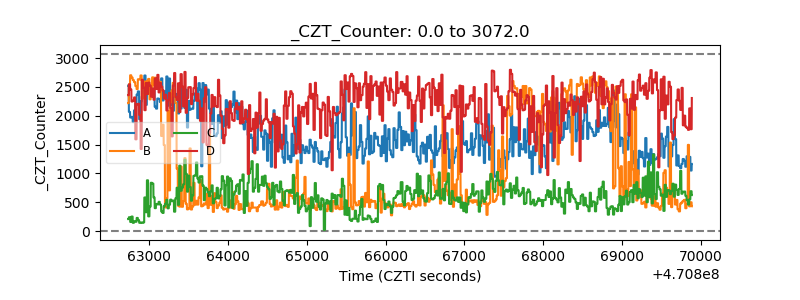 |
| +2.5 Volts monitor | 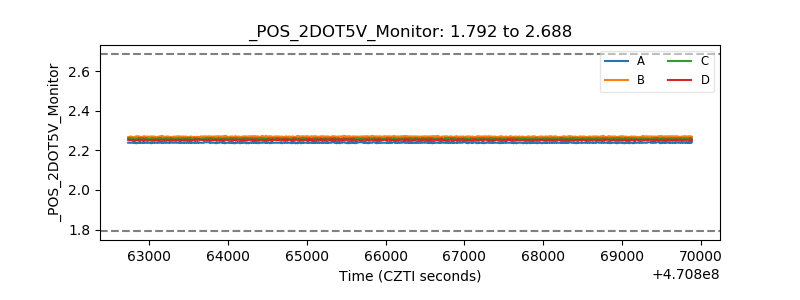 |
| +5 Volts monitor |  |
| _ROLL_ROT | 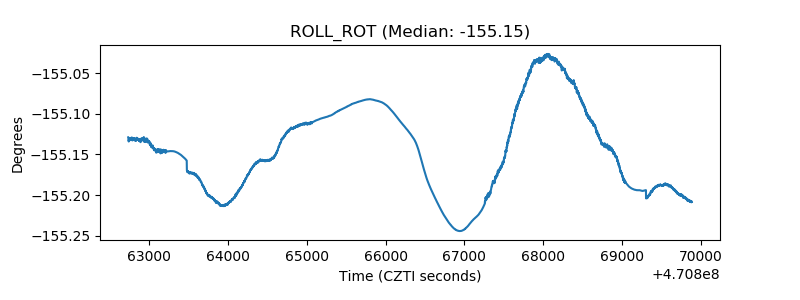 |
| _Roll_DEC | 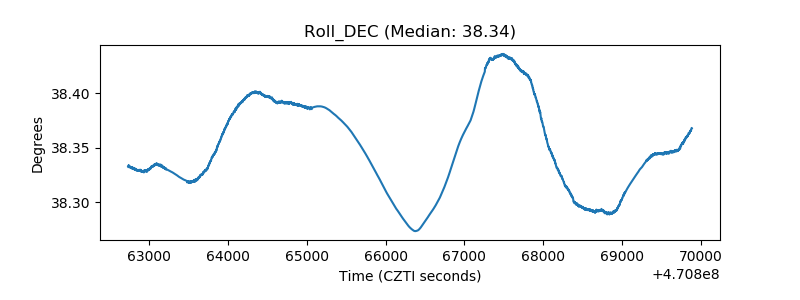 |
| _Roll_RA | 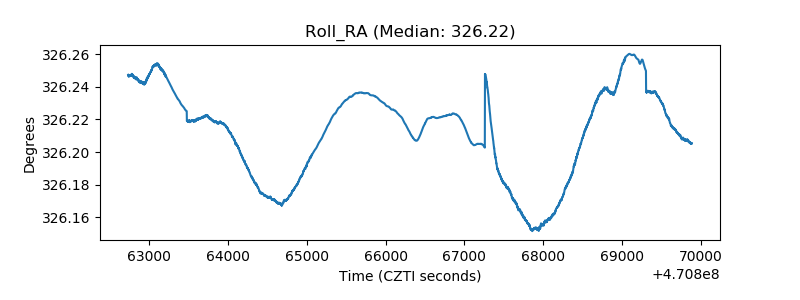 |
| Veto Counter | 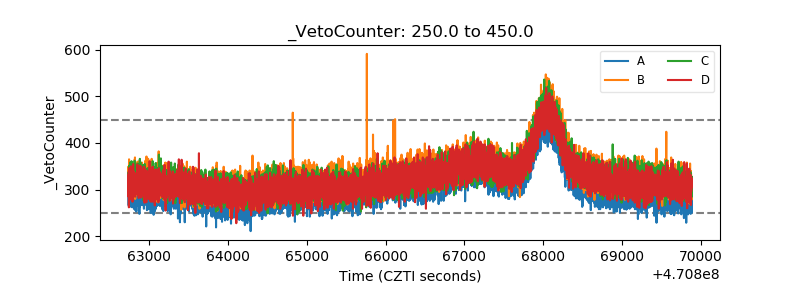 |