| Param | Original file | Final file |
|---|---|---|
| Filename | modeM0/AS1T05_233T01_9000006438_49661cztM0_level2.fits | modeM0/AS1T05_233T01_9000006438_49661cztM0_level2_quad_clean.evt |
| Size (bytes) | 1,207,811,520 | 48,767,040 |
| Size | 1.1 GB | 46.5 MB |
| Events in quadrant A | 15,084,801 | 288,779 |
| Events in quadrant B | 4,355,763 | 605,571 |
| Events in quadrant C | 9,369,756 | 28,985 |
| Events in quadrant D | 15,428,363 | 119,483 |
| Mode M9 | |||
|---|---|---|---|
| Quadrant | BADHDUFLAG | Total packets | Discarded packets |
| A | 0 | 9 | 0 |
| B | 0 | 9 | 0 |
| C | 0 | 9 | 0 |
| D | 0 | 9 | 0 |
| Mode SS | |||
|---|---|---|---|
| Quadrant | BADHDUFLAG | Total packets | Discarded packets |
| A | 0 | 124 | 0 |
| B | 0 | 124 | 0 |
| C | 0 | 124 | 0 |
| D | 0 | 124 | 0 |
| Mode M0 | |||
|---|---|---|---|
| Quadrant | BADHDUFLAG | Total packets | Discarded packets |
| A | 0 | 48944 | 0 |
| B | 0 | 17089 | 0 |
| C | 0 | 32097 | 0 |
| D | 0 | 50016 | 0 |
| Quadrant | Total seconds | Saturated seconds | Saturation percentage |
|---|---|---|---|
| A | 6083 | 5972 | 98.175242% |
| B | 6084 | 381 | 6.262327% |
| C | 6084 | 6084 | 100.000000% |
| D | 6083 | 6076 | 99.884925% |
Noise dominated data is calculated using 1-second bins in cleaned event files. If a bin has >2000 counts, and if more than 50% of those come from <1% of pixels, then it is considered to be noise-dominated and hence unusable.
| Quadrant | # 1 sec bins | Bins with >0 counts | Bins with >2000 counts | High rate bins dominated by noise | Noise dominated (total time) | Noise dominated (detector-on time) | Marked lightcurve |
|---|---|---|---|---|---|---|---|
| A | 7003 | 6084 | 5731 | 5731 | 81.84% | 94.20% |  |
| B | 7004 | 6085 | 259 | 259 | 3.70% | 4.26% |  |
| C | 7004 | 6084 | 1018 | 1018 | 14.53% | 16.73% | 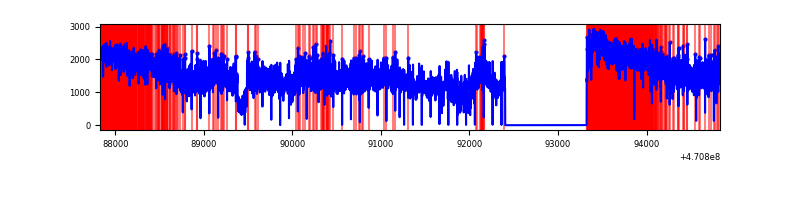 |
| D | 7003 | 6084 | 5587 | 5587 | 79.78% | 91.83% | 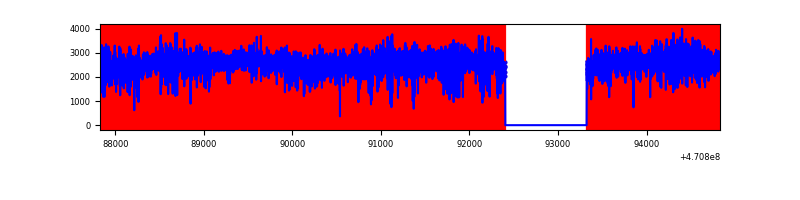 |
Top three noisy pixels from each quadrant. If the there are fewer than three noisy pixels in the level2.evt file, extra rows are filled as -1
| Pixel properties | Quadrant properties | ||||||
|---|---|---|---|---|---|---|---|
| Quadrant | DetID | PixID | Counts | Sigma | Mean | Median | Sigma |
| A | 10 | 83 | 5061352 | 51540.04 | 340 | 328 | 98.2 |
| A | 8 | 8 | 2905520 | 29585.65 | 340 | 328 | 98.2 |
| A | 12 | 50 | 996750 | 10147.28 | 340 | 328 | 98.2 |
| B | 7 | 0 | 745632 | 5532.0 | 634 | 614 | 134.7 |
| B | 4 | 206 | 264694 | 1960.88 | 634 | 614 | 134.7 |
| B | 10 | 44 | 215495 | 1595.56 | 634 | 614 | 134.7 |
| C | 15 | 180 | 3449774 | 157629.06 | 48 | 47 | 21.9 |
| C | 15 | 163 | 1119229 | 51139.01 | 48 | 47 | 21.9 |
| C | 15 | 181 | 820789 | 37502.33 | 48 | 47 | 21.9 |
| D | 15 | 40 | 4276736 | 51789.98 | 164 | 152 | 82.6 |
| D | 9 | 49 | 1275832 | 15448.65 | 164 | 152 | 82.6 |
| D | 7 | 45 | 1228732 | 14878.26 | 164 | 152 | 82.6 |
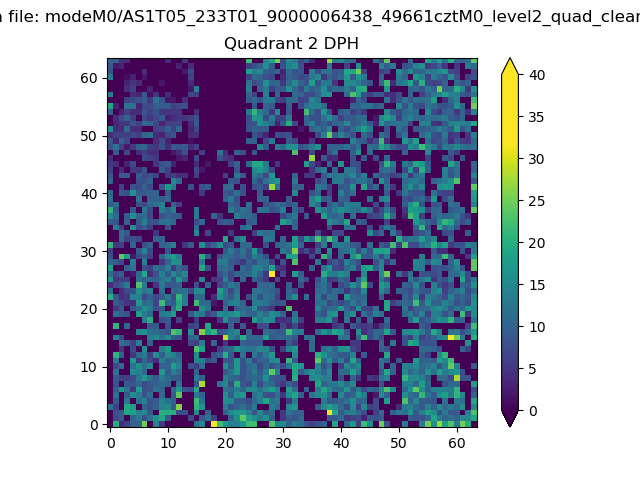
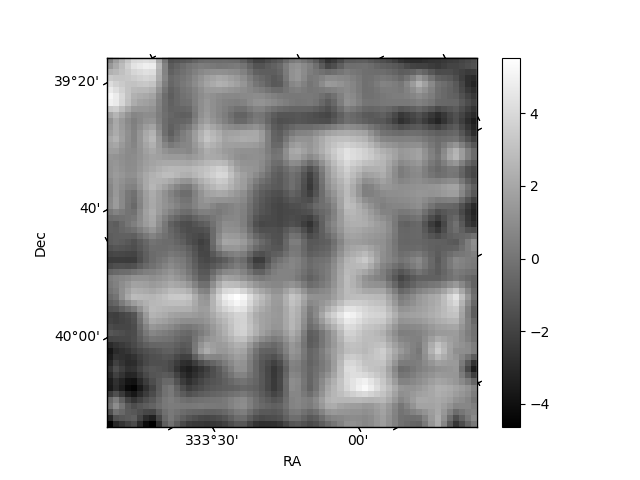
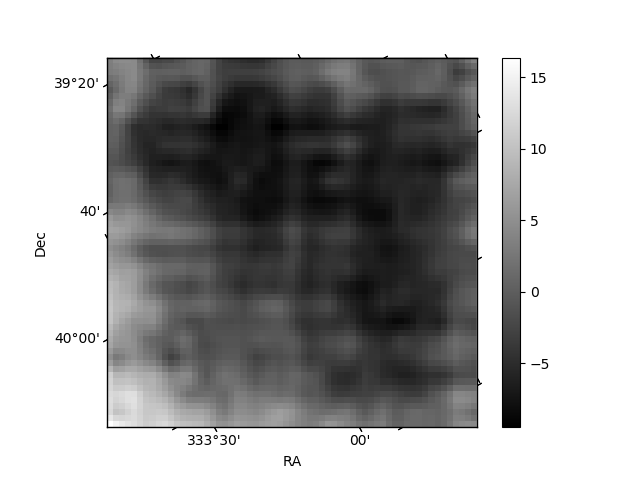
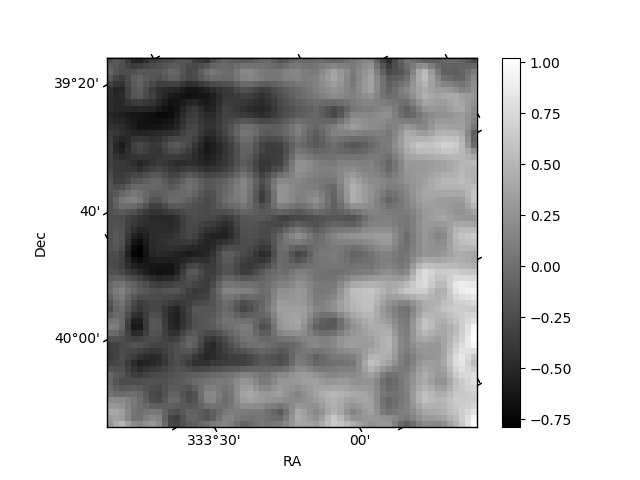
Histogram calculated using DETX and DETY for each event in the final _common_clean file
| Quadrant A | 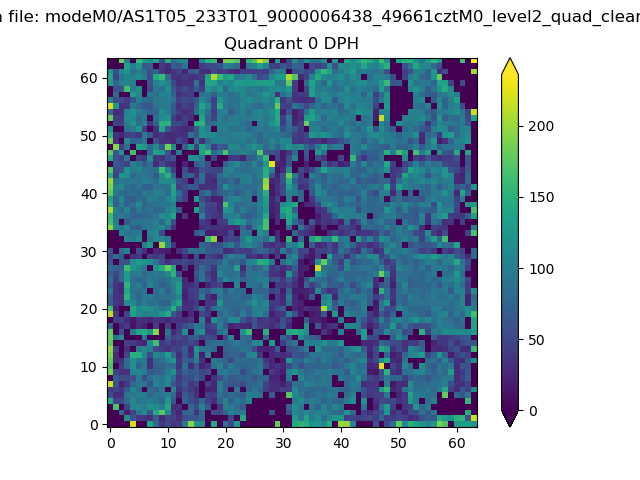 |
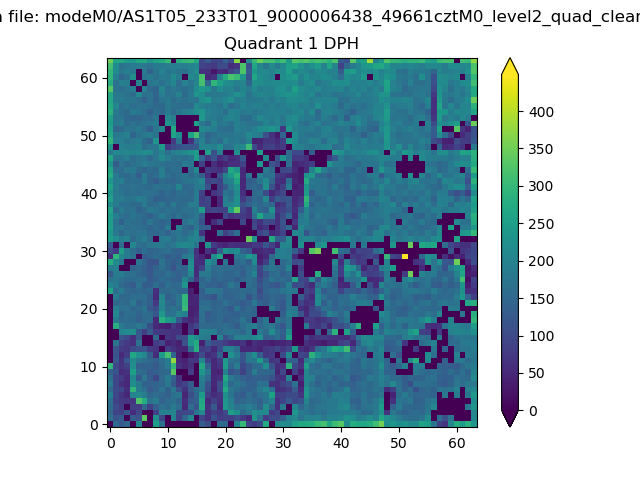 |
Quadrant B |
|---|---|---|---|
| Quadrant D | 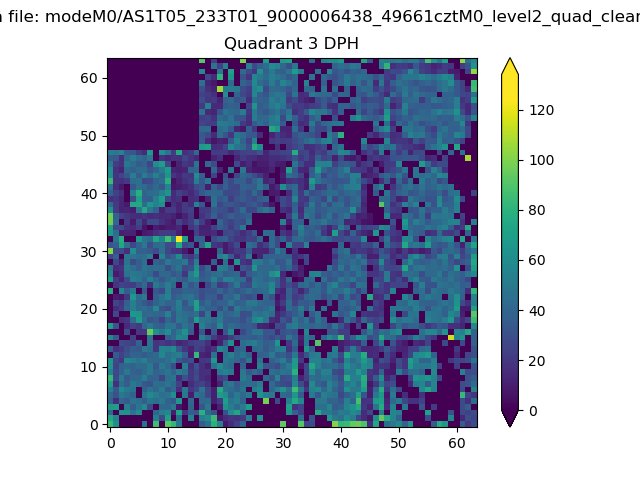 |
 |
Quadrant C |
| Plot type | Count rate plots | Images |
|---|---|---|
| Comparison with Poisson distribution Blue bars denote a histogram of data divided into 1 sec bins. Red curve is a Poisson curve with rate = median count rate of data. |
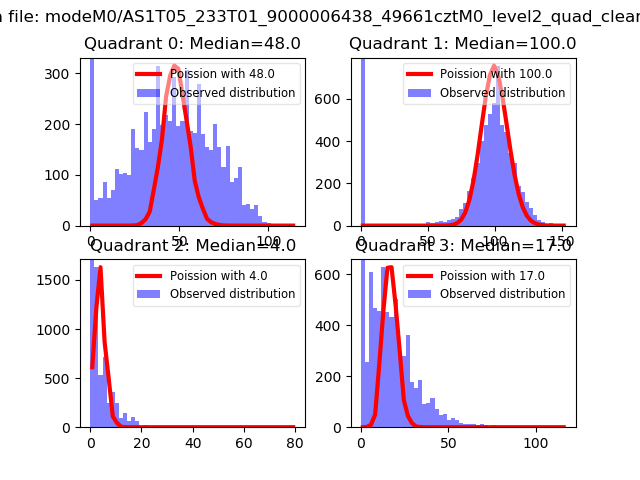 |
 |
| Quadrant-wise count rates Data is divided into 100 sec bins |
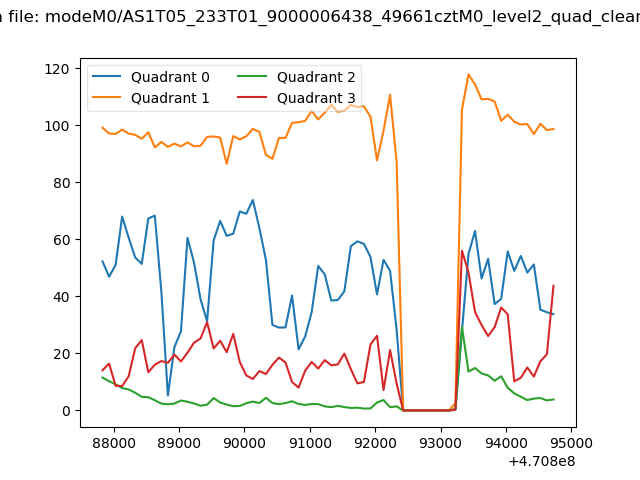 |
|
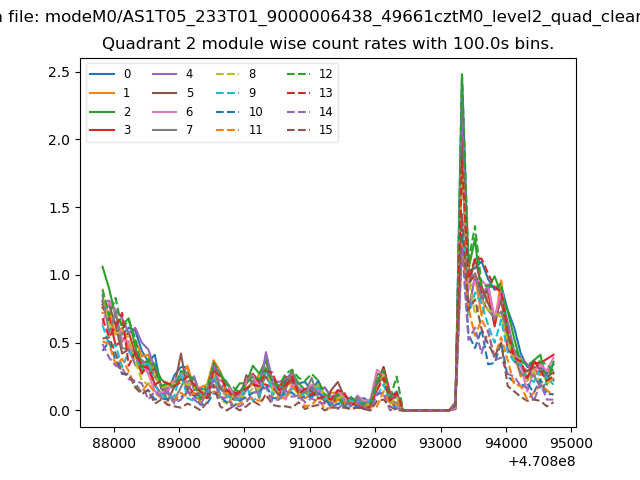
| Module-wise count rates for Quadrant A Data is divided into 100 sec bins |
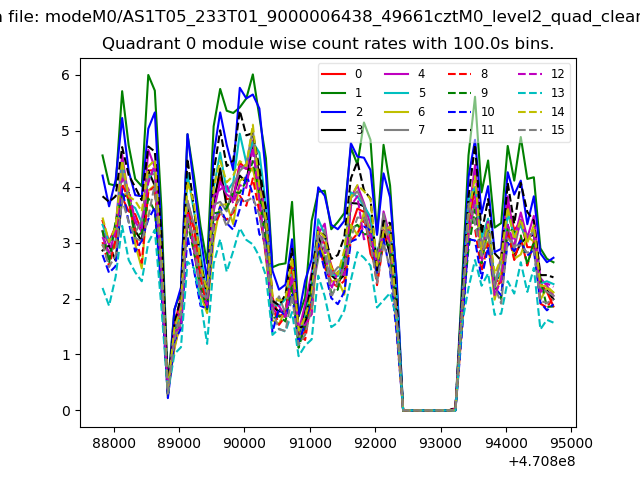 |
 |
| Module-wise count rates for Quadrant B Data is divided into 100 sec bins |
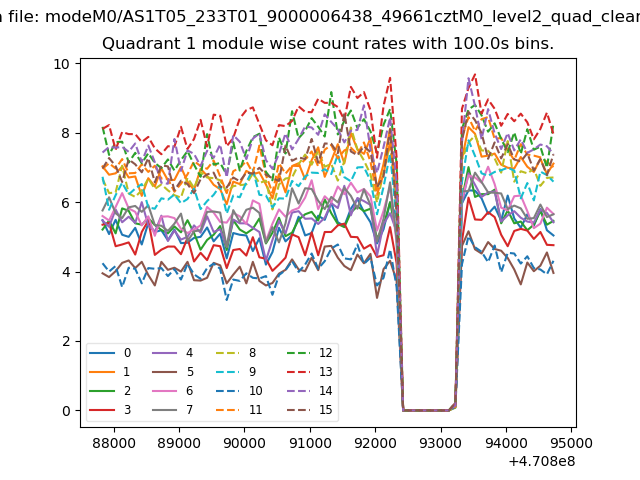 |
 |
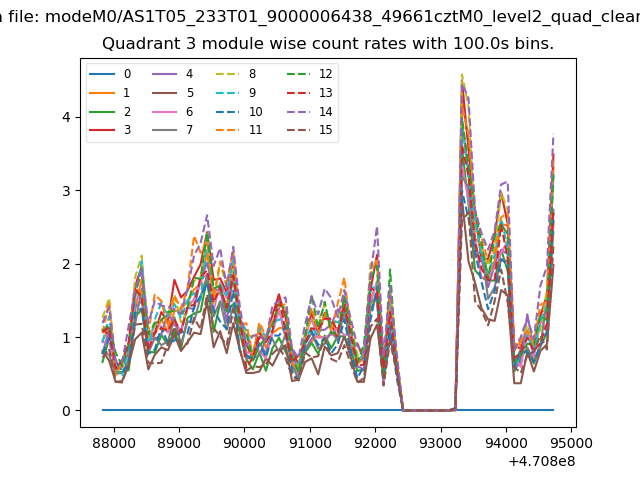
| Module-wise count rates for Quadrant C Data is divided into 100 sec bins |
 |
 |
| Module-wise count rates for Quadrant D Data is divided into 100 sec bins |
 |
 |
| Parameter | Plot |
|---|---|
| CZT HV Monitor | 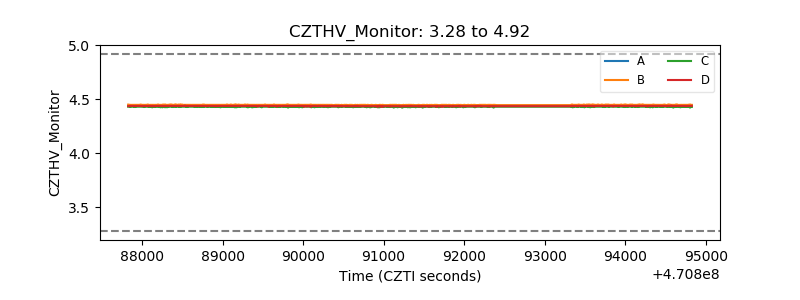 |
| D_VDD | 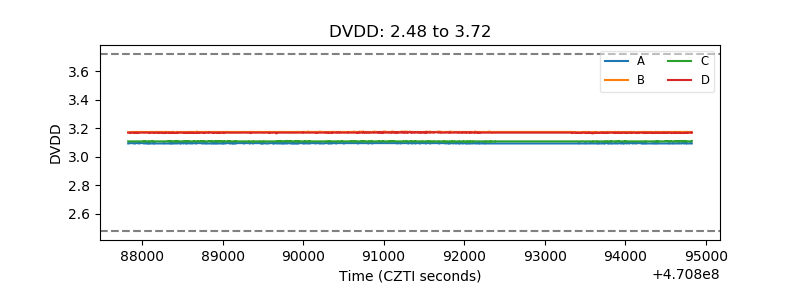 |
| Temperature 1 | 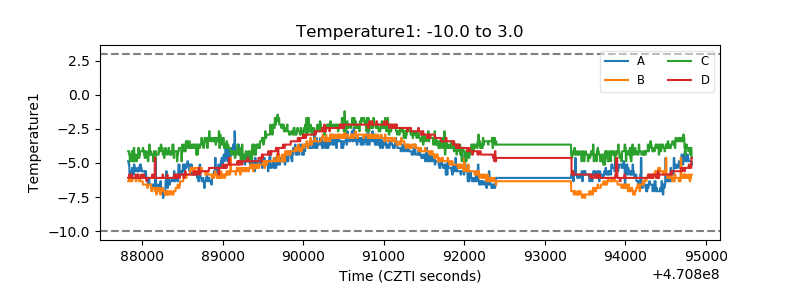 |
| Veto HV Monitor | 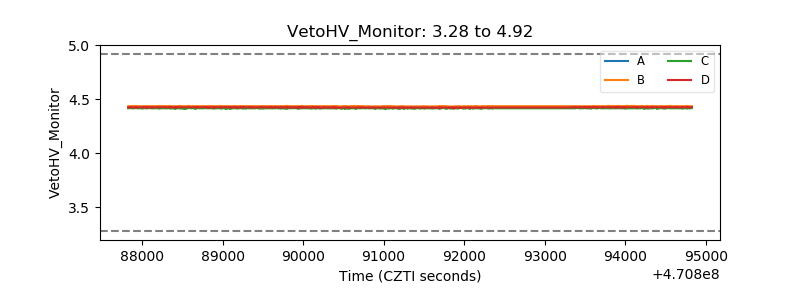 |
| Veto LLD | 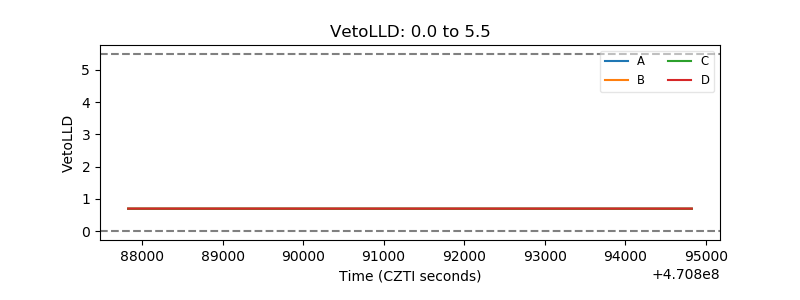 |
| Alpha Counter | 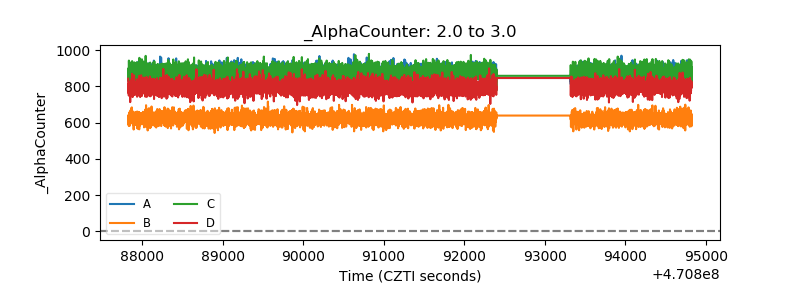 |
| _CPM_Rate | 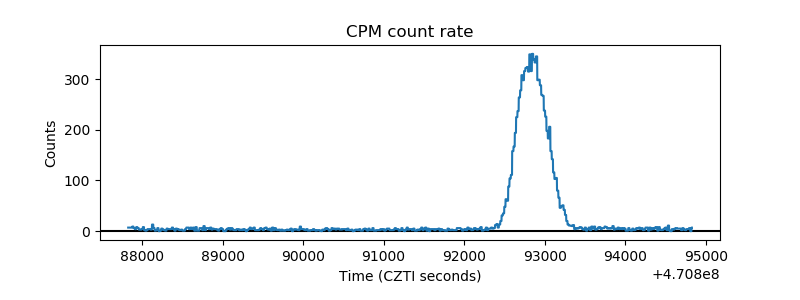 |
| CZT Counter | 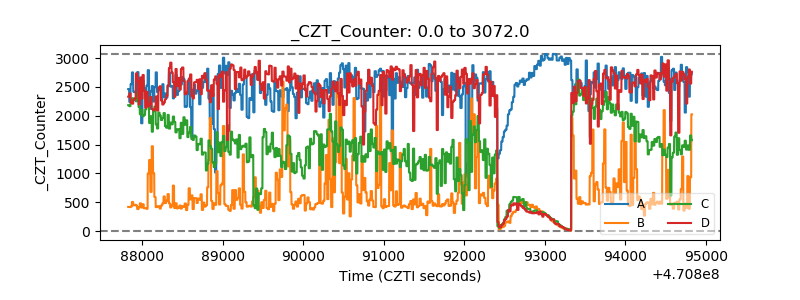 |
| +2.5 Volts monitor | 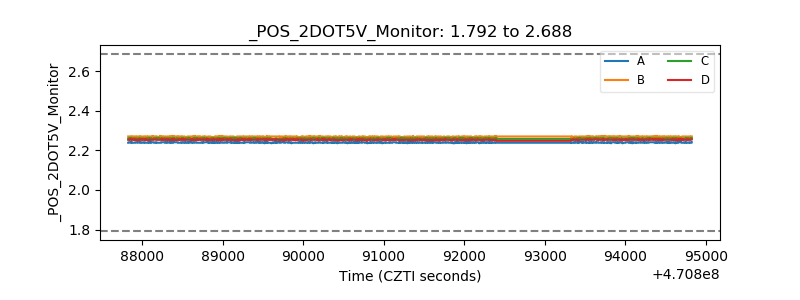 |
| +5 Volts monitor |  |
| _ROLL_ROT |  |
| _Roll_DEC | 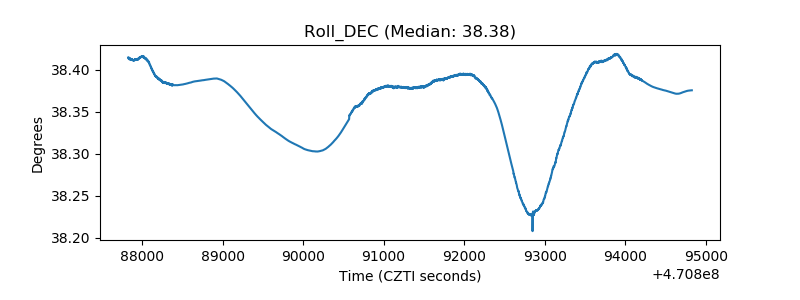 |
| _Roll_RA | 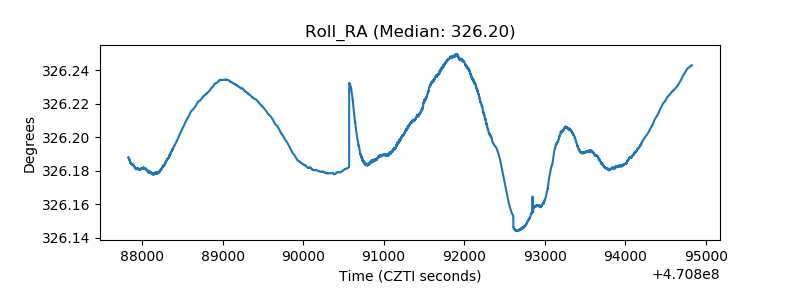 |
| Veto Counter | 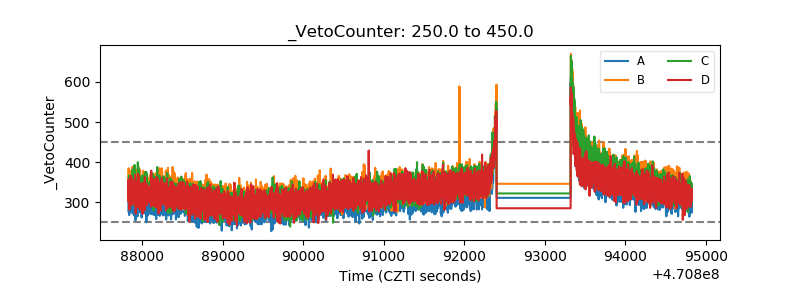 |