| Param | Original file | Final file |
|---|---|---|
| Filename | modeM0/AS1T05_233T01_9000006438_49663cztM0_level2.fits | modeM0/AS1T05_233T01_9000006438_49663cztM0_level2_quad_clean.evt |
| Size (bytes) | 1,201,651,200 | 50,901,120 |
| Size | 1.1 GB | 48.5 MB |
| Events in quadrant A | 15,080,758 | 307,172 |
| Events in quadrant B | 4,085,628 | 619,614 |
| Events in quadrant C | 9,687,985 | 42,877 |
| Events in quadrant D | 15,160,552 | 142,310 |
| Mode M9 | |||
|---|---|---|---|
| Quadrant | BADHDUFLAG | Total packets | Discarded packets |
| A | 0 | 11 | 0 |
| B | 0 | 11 | 0 |
| C | 0 | 11 | 0 |
| D | 0 | 11 | 0 |
| Mode SS | |||
|---|---|---|---|
| Quadrant | BADHDUFLAG | Total packets | Discarded packets |
| A | 0 | 120 | 0 |
| B | 0 | 120 | 0 |
| C | 0 | 120 | 0 |
| D | 0 | 120 | 0 |
| Mode M0 | |||
|---|---|---|---|
| Quadrant | BADHDUFLAG | Total packets | Discarded packets |
| A | 0 | 48931 | 0 |
| B | 0 | 16293 | 0 |
| C | 0 | 32975 | 0 |
| D | 0 | 49153 | 0 |
| Quadrant | Total seconds | Saturated seconds | Saturation percentage |
|---|---|---|---|
| A | 6030 | 5798 | 96.152570% |
| B | 6031 | 384 | 6.367103% |
| C | 6031 | 6021 | 99.834190% |
| D | 6031 | 5928 | 98.292157% |
Noise dominated data is calculated using 1-second bins in cleaned event files. If a bin has >2000 counts, and if more than 50% of those come from <1% of pixels, then it is considered to be noise-dominated and hence unusable.
| Quadrant | # 1 sec bins | Bins with >0 counts | Bins with >2000 counts | High rate bins dominated by noise | Noise dominated (total time) | Noise dominated (detector-on time) | Marked lightcurve |
|---|---|---|---|---|---|---|---|
| A | 7050 | 6031 | 5762 | 5762 | 81.73% | 95.54% | 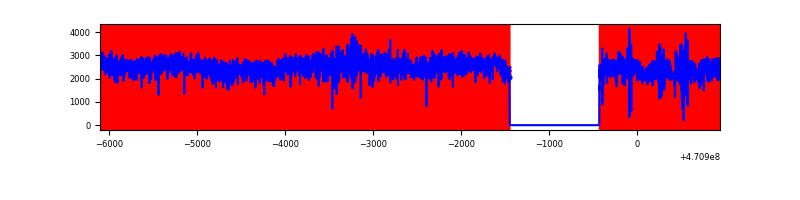 |
| B | 7051 | 6032 | 221 | 221 | 3.13% | 3.66% | 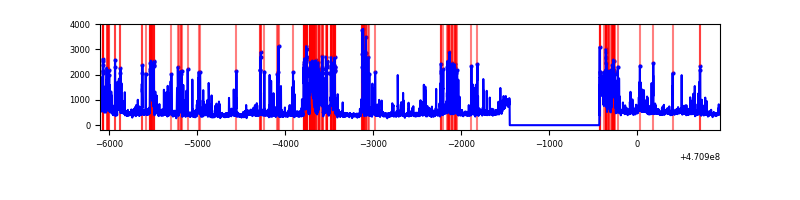 |
| C | 7051 | 6031 | 1230 | 1230 | 17.44% | 20.39% | 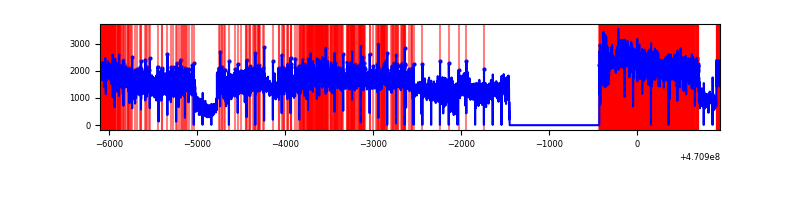 |
| D | 7051 | 6031 | 5362 | 5362 | 76.05% | 88.91% | 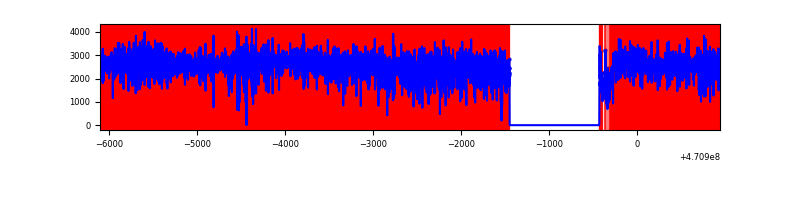 |
Top three noisy pixels from each quadrant. If the there are fewer than three noisy pixels in the level2.evt file, extra rows are filled as -1
| Pixel properties | Quadrant properties | ||||||
|---|---|---|---|---|---|---|---|
| Quadrant | DetID | PixID | Counts | Sigma | Mean | Median | Sigma |
| A | 10 | 83 | 5114844 | 47655.42 | 362 | 348 | 107.3 |
| A | 12 | 50 | 2301243 | 21439.09 | 362 | 348 | 107.3 |
| A | 0 | 99 | 861217 | 8021.33 | 362 | 348 | 107.3 |
| B | 7 | 0 | 668139 | 4883.9 | 639 | 617 | 136.7 |
| B | 4 | 206 | 379684 | 2773.43 | 639 | 617 | 136.7 |
| B | 5 | 172 | 116087 | 844.83 | 639 | 617 | 136.7 |
| C | 15 | 180 | 3632469 | 118177.32 | 62 | 60 | 30.7 |
| C | 15 | 163 | 1052750 | 34248.37 | 62 | 60 | 30.7 |
| C | 15 | 181 | 989129 | 32178.51 | 62 | 60 | 30.7 |
| D | 15 | 40 | 3254541 | 41971.87 | 187 | 176 | 77.5 |
| D | 9 | 49 | 2024565 | 26108.75 | 187 | 176 | 77.5 |
| D | 12 | 191 | 1409340 | 18174.13 | 187 | 176 | 77.5 |
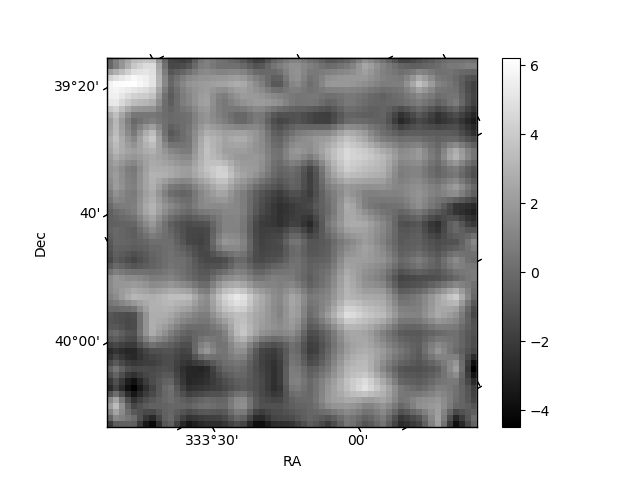
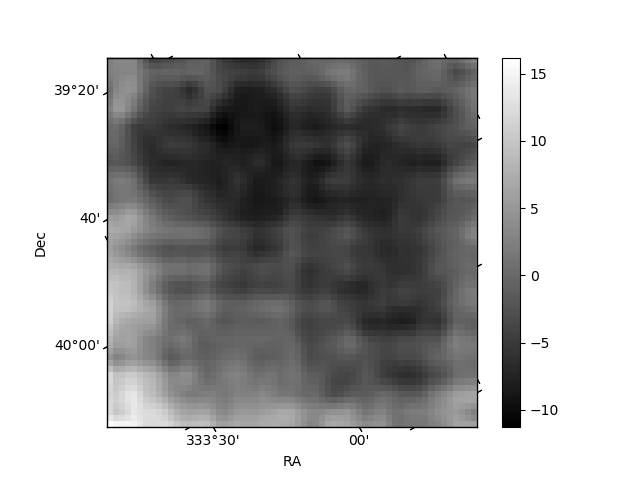
Histogram calculated using DETX and DETY for each event in the final _common_clean file
| Quadrant A | 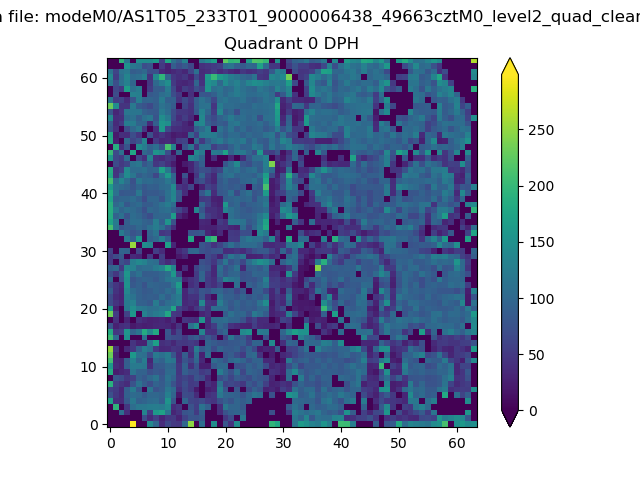 |
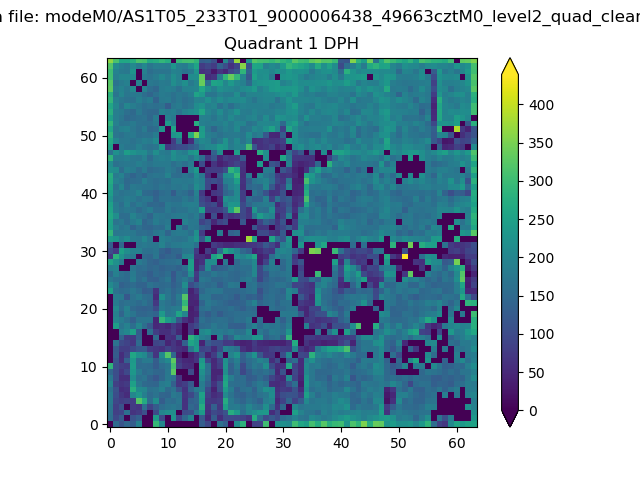 |
Quadrant B |
|---|---|---|---|
| Quadrant D | 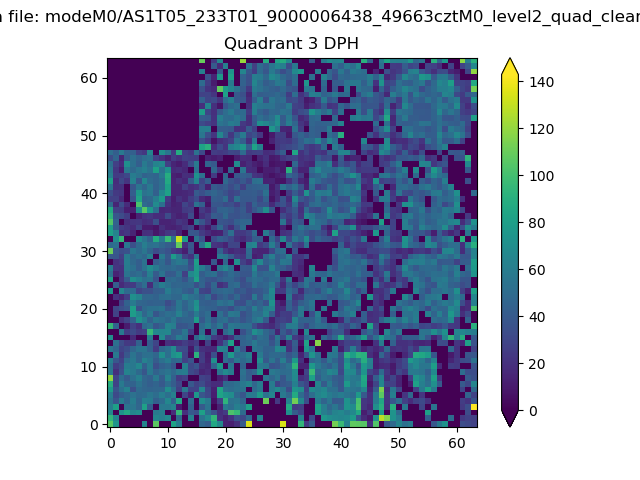 |
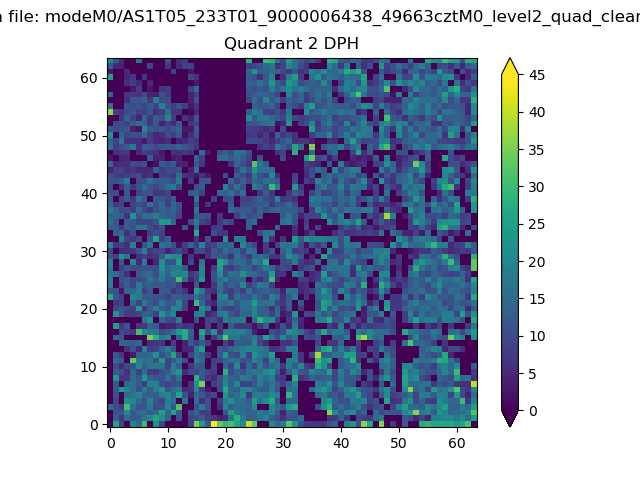 |
Quadrant C |
| Plot type | Count rate plots | Images |
|---|---|---|
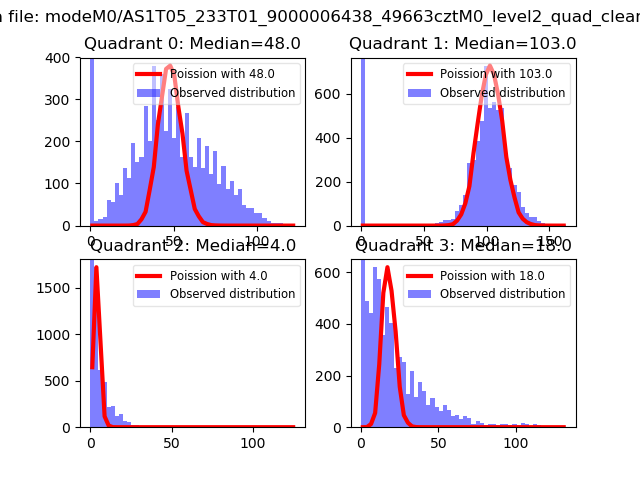
| Comparison with Poisson distribution Blue bars denote a histogram of data divided into 1 sec bins. Red curve is a Poisson curve with rate = median count rate of data. |
 |
 |
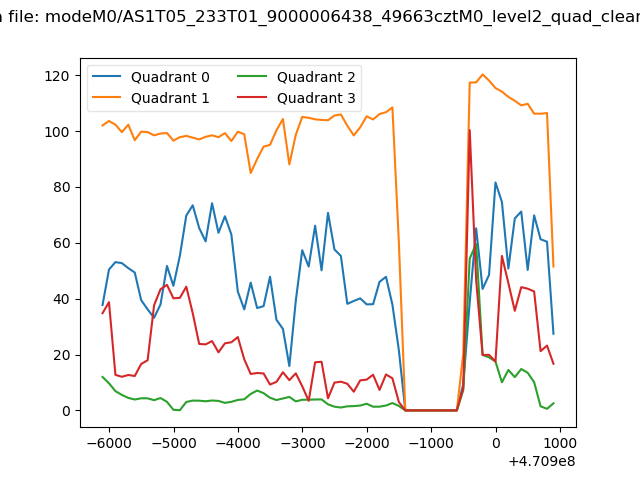
| Quadrant-wise count rates Data is divided into 100 sec bins |
 |
|
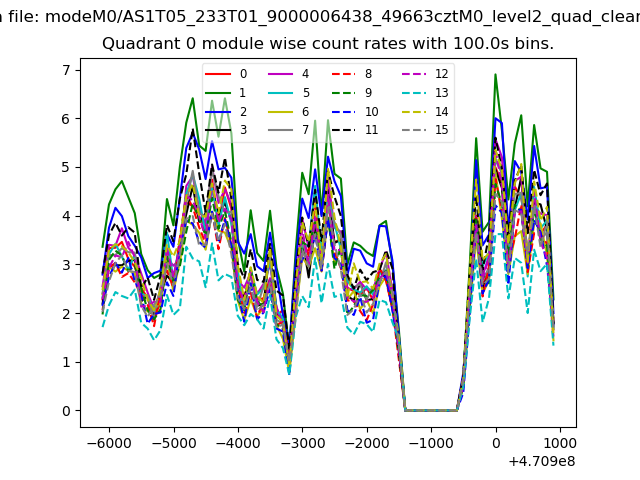
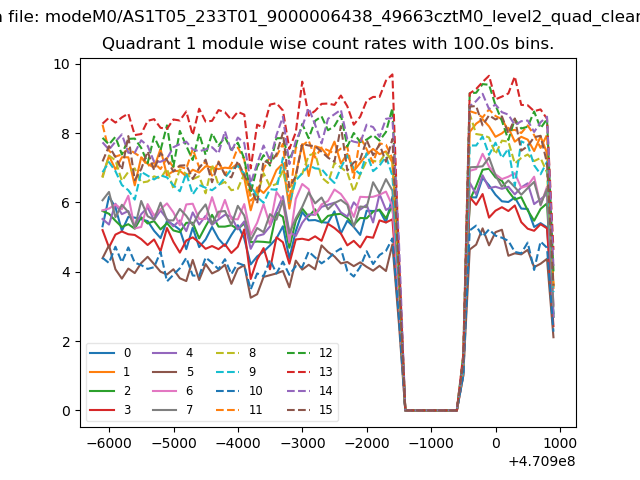
| Module-wise count rates for Quadrant A Data is divided into 100 sec bins |
 |
 |
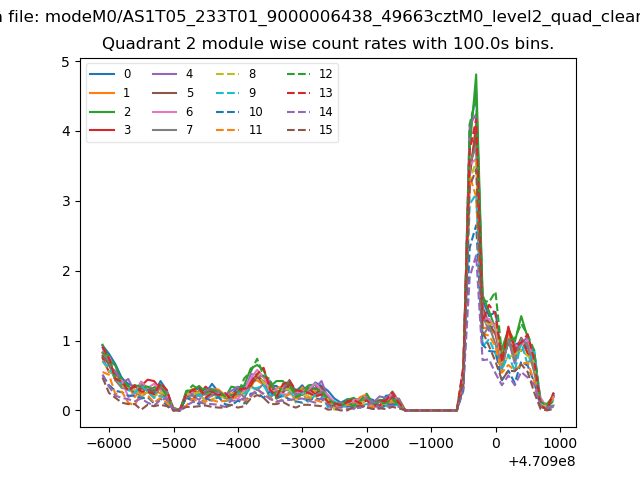
| Module-wise count rates for Quadrant B Data is divided into 100 sec bins |
 |
 |
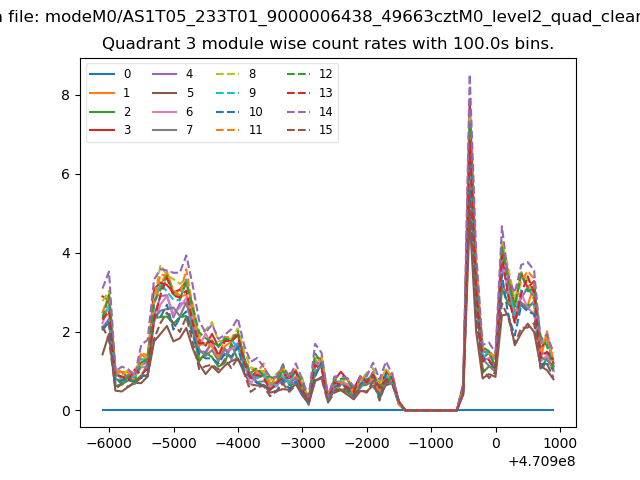
| Module-wise count rates for Quadrant C Data is divided into 100 sec bins |
 |
 |
| Module-wise count rates for Quadrant D Data is divided into 100 sec bins |
 |
 |
| Parameter | Plot |
|---|---|
| CZT HV Monitor | 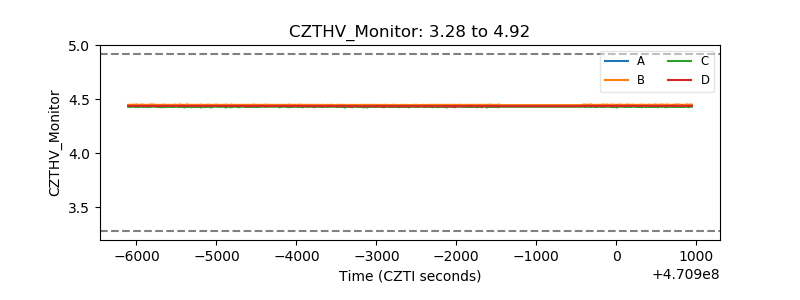 |
| D_VDD | 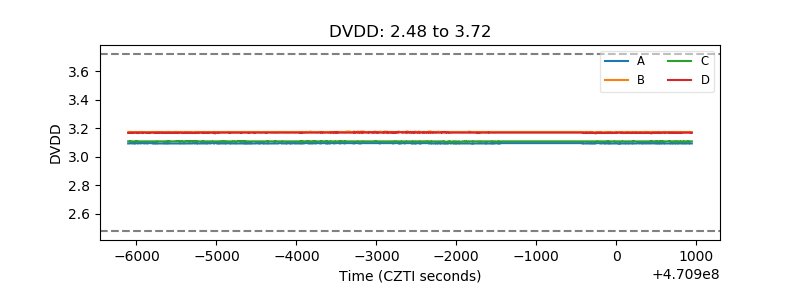 |
| Temperature 1 | 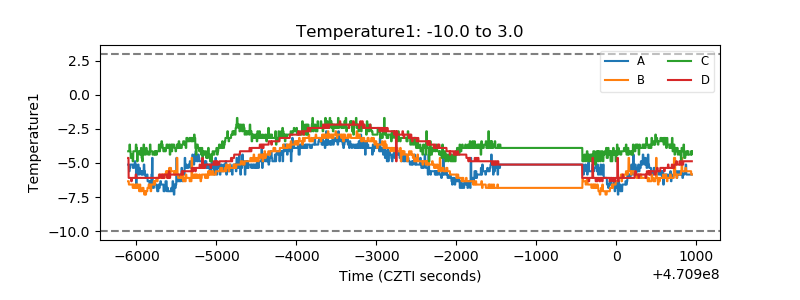 |
| Veto HV Monitor | 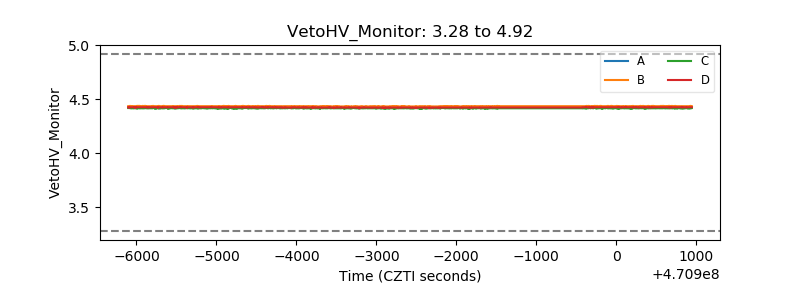 |
| Veto LLD | 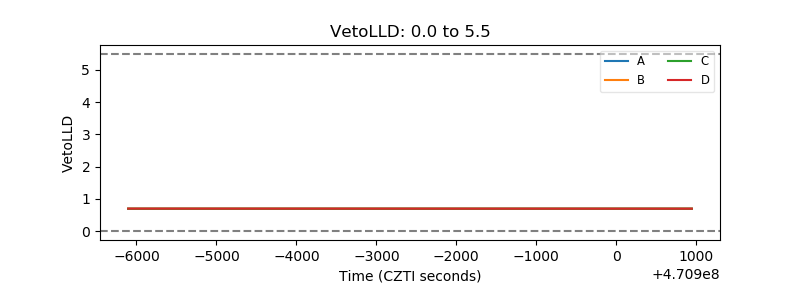 |
| Alpha Counter | 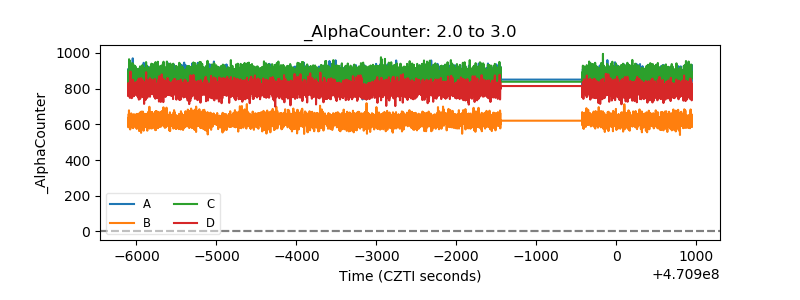 |
| _CPM_Rate | 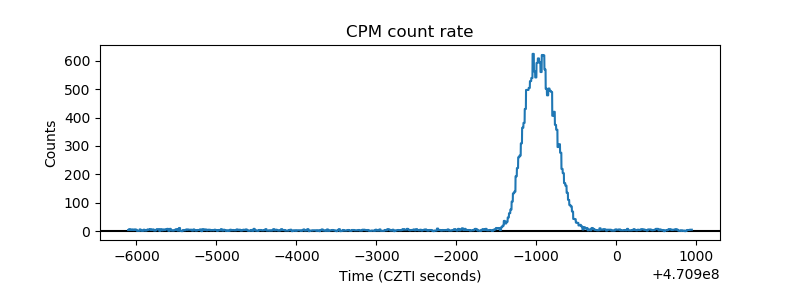 |
| CZT Counter | 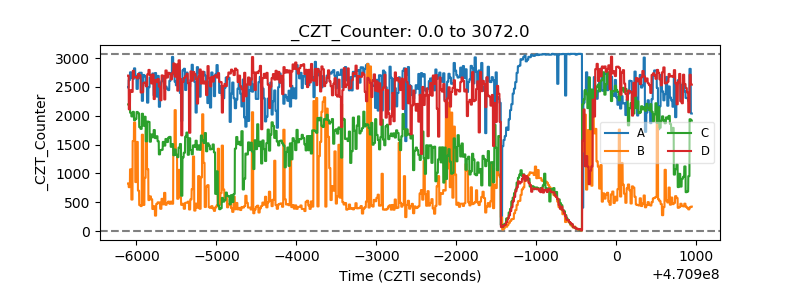 |
| +2.5 Volts monitor |  |
| +5 Volts monitor | 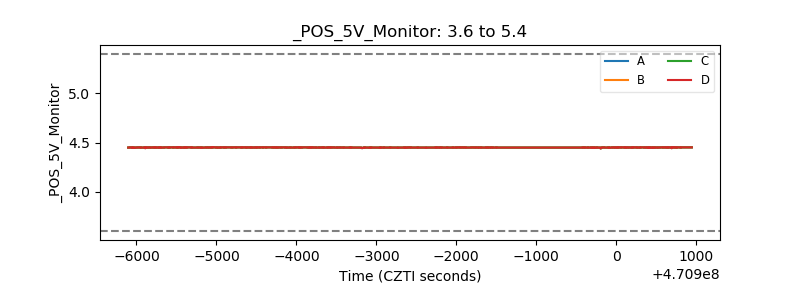 |
| _ROLL_ROT | 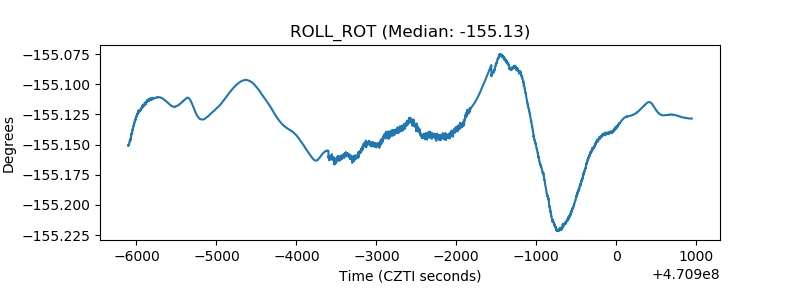 |
| _Roll_DEC | 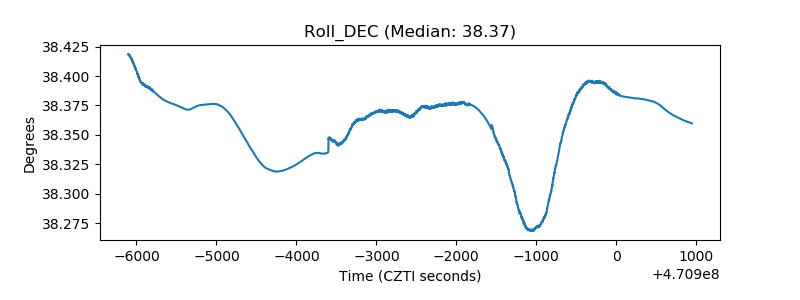 |
| _Roll_RA | 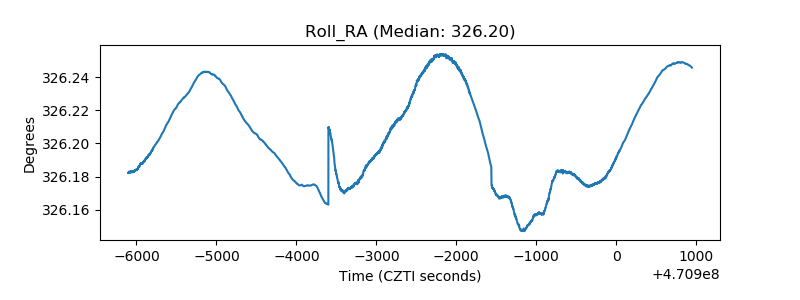 |
| Veto Counter | 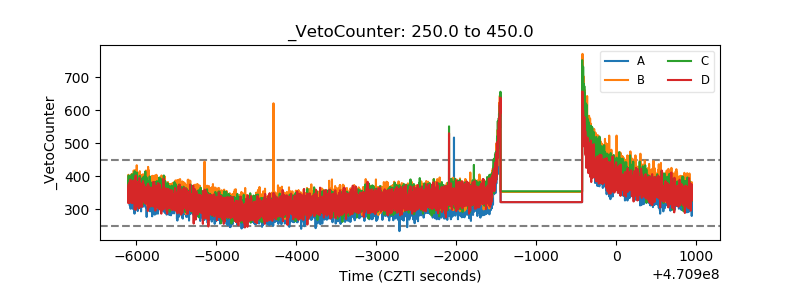 |