| Param | Original file | Final file |
|---|---|---|
| Filename | modeM0/AS1T05_233T01_9000006438_49664cztM0_level2.fits | modeM0/AS1T05_233T01_9000006438_49664cztM0_level2_quad_clean.evt |
| Size (bytes) | 1,199,511,360 | 36,040,320 |
| Size | 1.1 GB | 34.4 MB |
| Events in quadrant A | 14,955,816 | 58,679 |
| Events in quadrant B | 4,970,779 | 588,857 |
| Events in quadrant C | 8,741,092 | 361 |
| Events in quadrant D | 15,258,896 | 14,295 |
| Mode M9 | |||
|---|---|---|---|
| Quadrant | BADHDUFLAG | Total packets | Discarded packets |
| A | 0 | 11 | 0 |
| B | 0 | 11 | 0 |
| C | 0 | 11 | 0 |
| D | 0 | 11 | 0 |
| Mode SS | |||
|---|---|---|---|
| Quadrant | BADHDUFLAG | Total packets | Discarded packets |
| A | 0 | 124 | 0 |
| B | 0 | 124 | 0 |
| C | 0 | 124 | 0 |
| D | 0 | 124 | 0 |
| Mode M0 | |||
|---|---|---|---|
| Quadrant | BADHDUFLAG | Total packets | Discarded packets |
| A | 0 | 48608 | 5 |
| B | 0 | 19071 | 1 |
| C | 0 | 30251 | 1 |
| D | 0 | 49555 | 1 |
| Quadrant | Total seconds | Saturated seconds | Saturation percentage |
|---|---|---|---|
| A | 6143 | 5747 | 93.553638% |
| B | 6144 | 797 | 12.972005% |
| C | 6144 | 6142 | 99.967448% |
| D | 6144 | 6036 | 98.242188% |
Noise dominated data is calculated using 1-second bins in cleaned event files. If a bin has >2000 counts, and if more than 50% of those come from <1% of pixels, then it is considered to be noise-dominated and hence unusable.
| Quadrant | # 1 sec bins | Bins with >0 counts | Bins with >2000 counts | High rate bins dominated by noise | Noise dominated (total time) | Noise dominated (detector-on time) | Marked lightcurve |
|---|---|---|---|---|---|---|---|
| A | 7233 | 6144 | 5669 | 5669 | 78.38% | 92.27% | 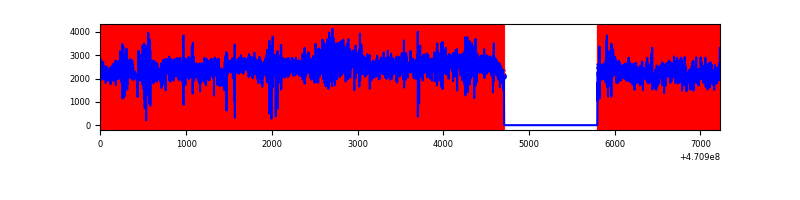 |
| B | 7234 | 6145 | 602 | 602 | 8.32% | 9.80% | 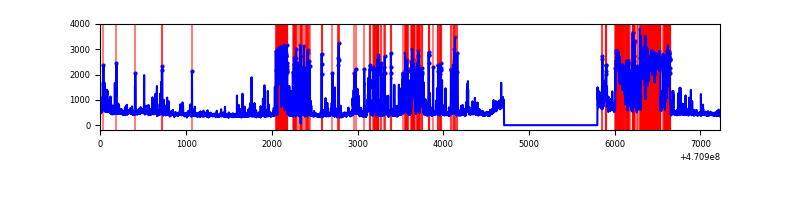 |
| C | 7233 | 6143 | 957 | 957 | 13.23% | 15.58% | 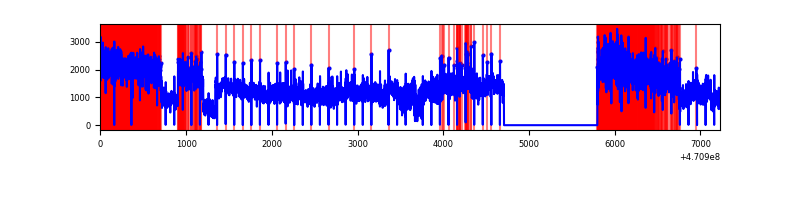 |
| D | 7234 | 6144 | 5441 | 5441 | 75.21% | 88.56% | 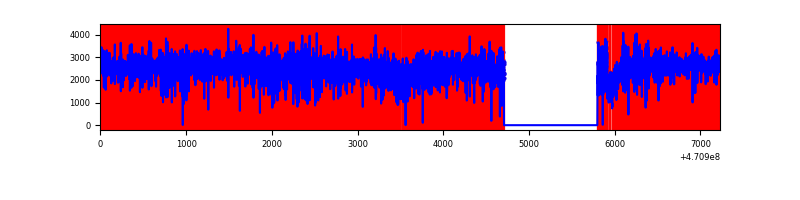 |
Top three noisy pixels from each quadrant. If the there are fewer than three noisy pixels in the level2.evt file, extra rows are filled as -1
| Pixel properties | Quadrant properties | ||||||
|---|---|---|---|---|---|---|---|
| Quadrant | DetID | PixID | Counts | Sigma | Mean | Median | Sigma |
| A | 10 | 83 | 5748163 | 48993.03 | 420 | 407 | 117.3 |
| A | 12 | 50 | 1823964 | 15543.73 | 420 | 407 | 117.3 |
| A | 3 | 130 | 971691 | 8279.08 | 420 | 407 | 117.3 |
| B | 5 | 49 | 906543 | 6765.47 | 633 | 615 | 133.9 |
| B | 7 | 0 | 600546 | 4480.28 | 633 | 615 | 133.9 |
| B | 4 | 206 | 585337 | 4366.7 | 633 | 615 | 133.9 |
| C | 15 | 180 | 3690374 | 132601.08 | 52 | 49 | 27.8 |
| C | 15 | 181 | 1160433 | 41695.02 | 52 | 49 | 27.8 |
| C | 15 | 219 | 523114 | 18794.82 | 52 | 49 | 27.8 |
| D | 15 | 40 | 3065157 | 36058.07 | 220 | 208 | 85.0 |
| D | 15 | 184 | 2125347 | 25001.53 | 220 | 208 | 85.0 |
| D | 7 | 60 | 1527007 | 17962.26 | 220 | 208 | 85.0 |
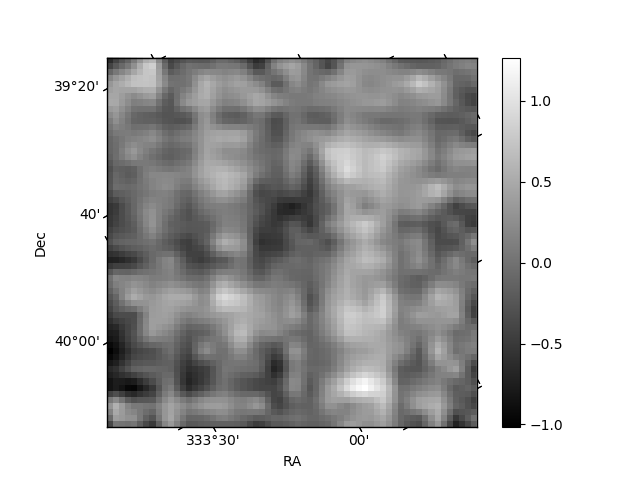
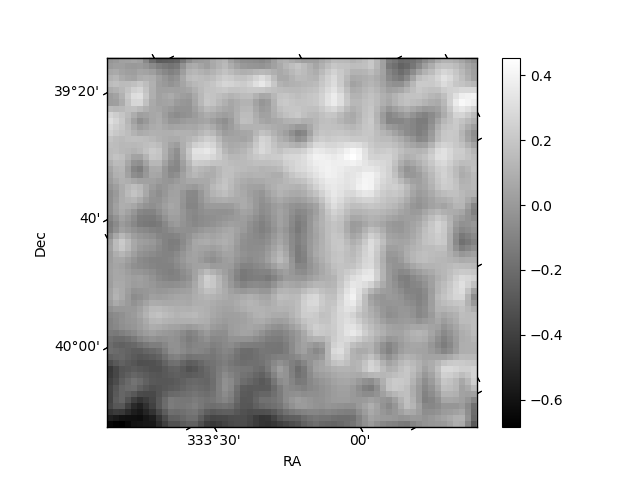
Histogram calculated using DETX and DETY for each event in the final _common_clean file
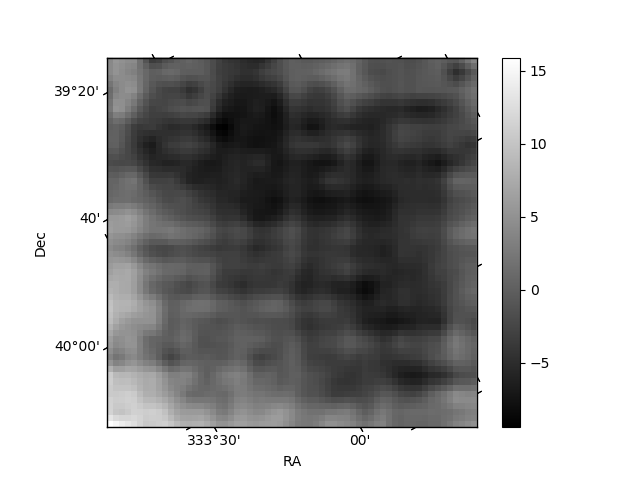
| Quadrant A | 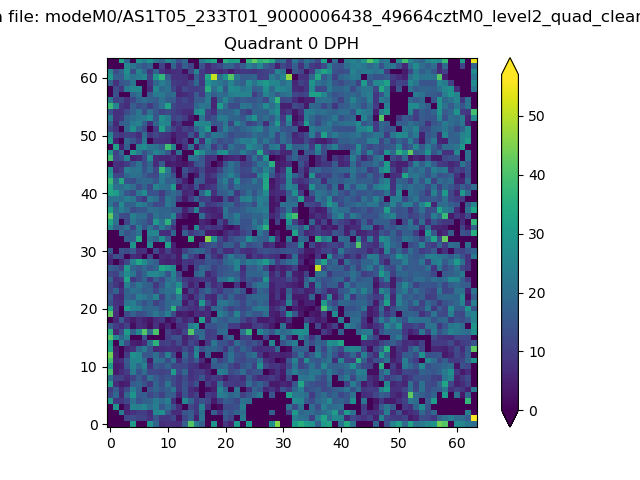 |
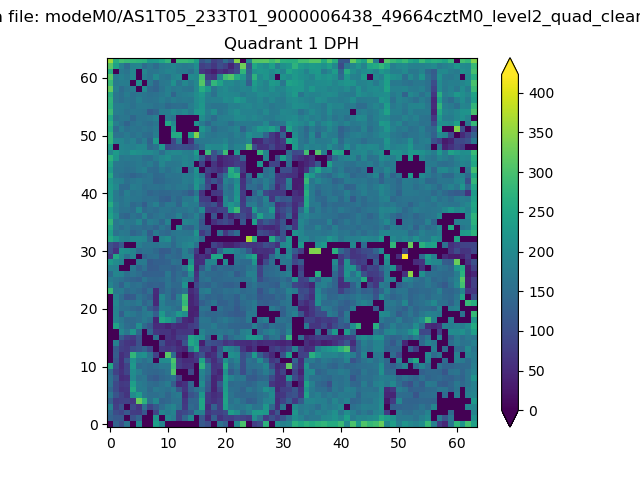 |
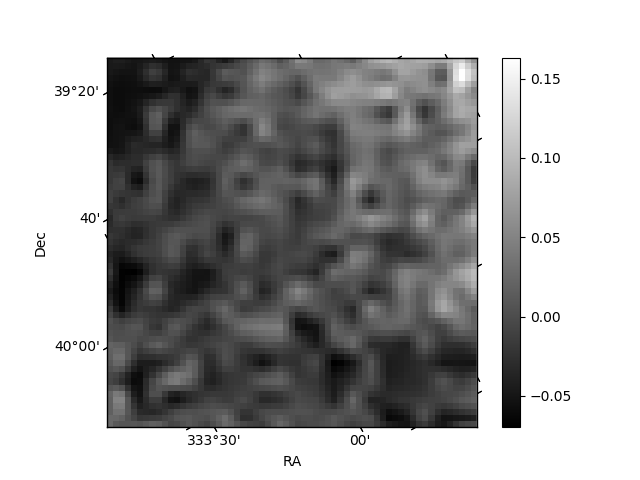
Quadrant B |
|---|---|---|---|
| Quadrant D | 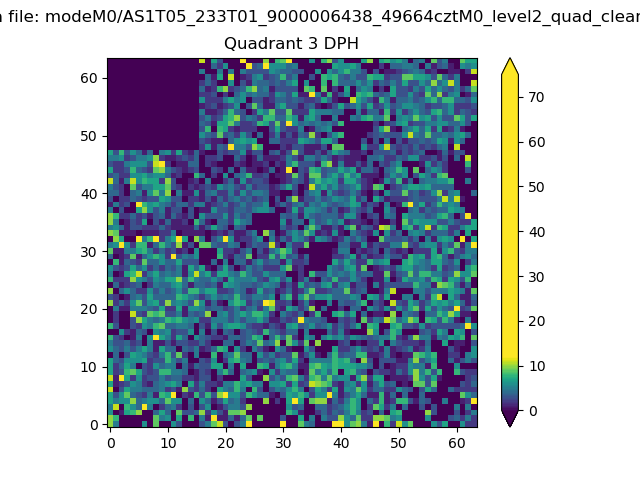 |
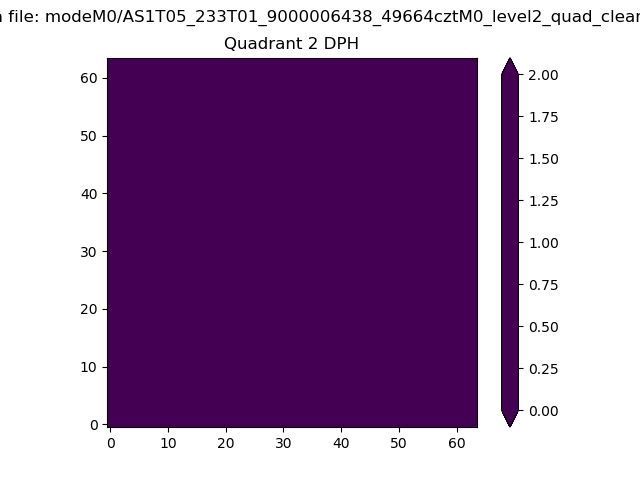 |
Quadrant C |
| Plot type | Count rate plots | Images |
|---|---|---|
| Comparison with Poisson distribution Blue bars denote a histogram of data divided into 1 sec bins. Red curve is a Poisson curve with rate = median count rate of data. |
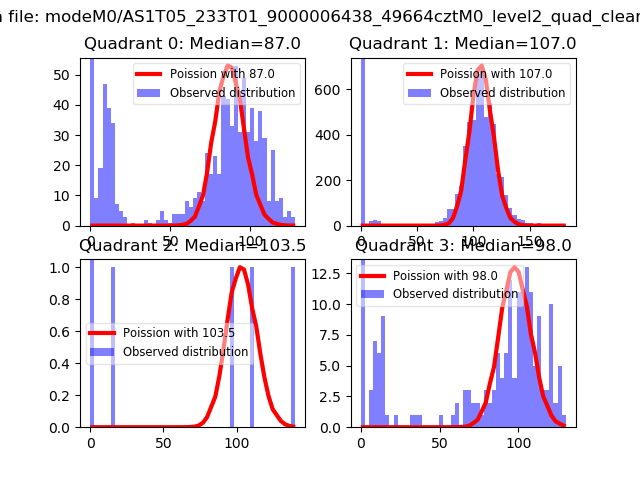 |
 |
| Quadrant-wise count rates Data is divided into 100 sec bins |
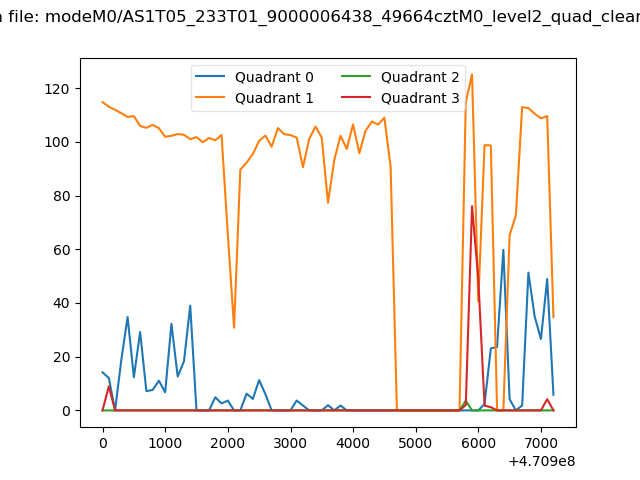 |
|
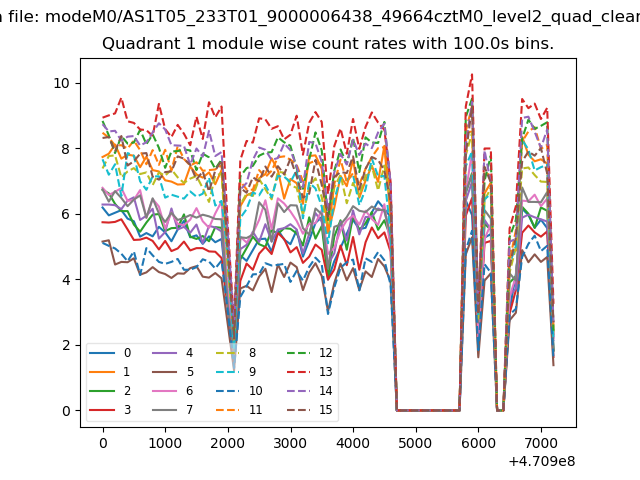
| Module-wise count rates for Quadrant A Data is divided into 100 sec bins |
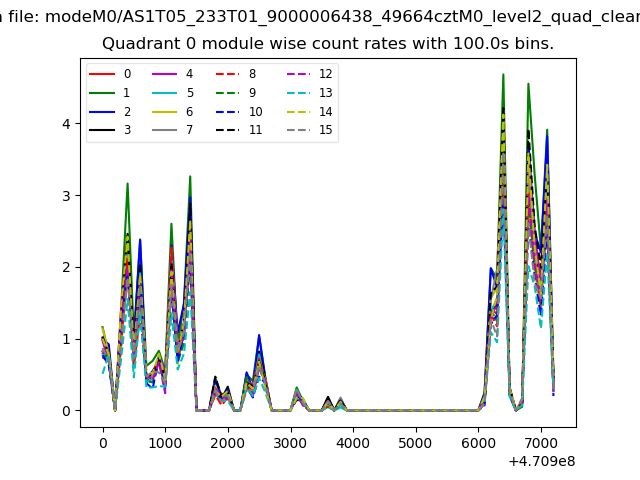 |
 |
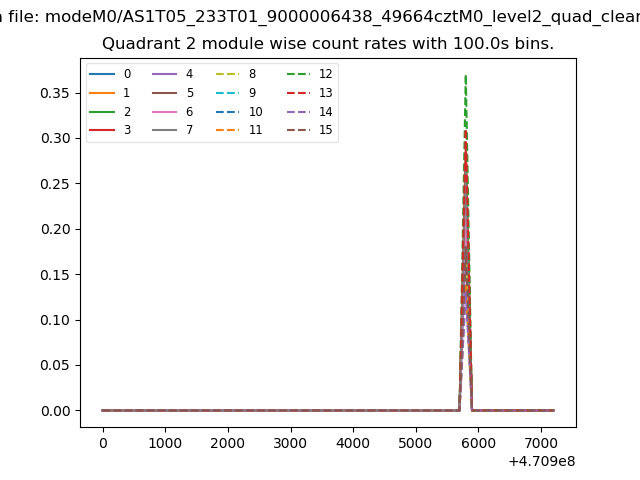
| Module-wise count rates for Quadrant B Data is divided into 100 sec bins |
 |
 |
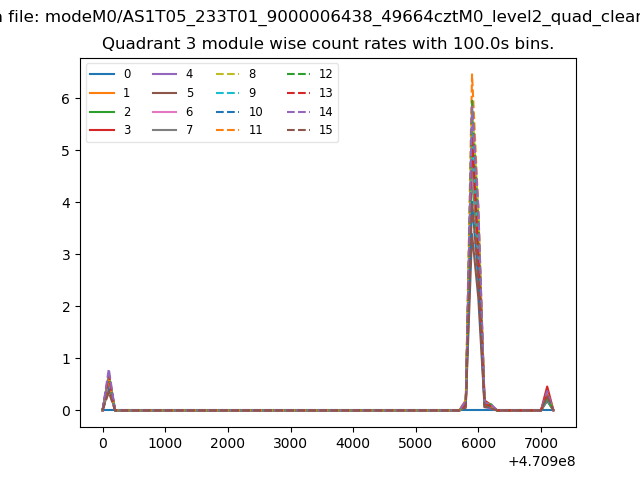
| Module-wise count rates for Quadrant C Data is divided into 100 sec bins |
 |
 |
| Module-wise count rates for Quadrant D Data is divided into 100 sec bins |
 |
 |
| Parameter | Plot |
|---|---|
| CZT HV Monitor | 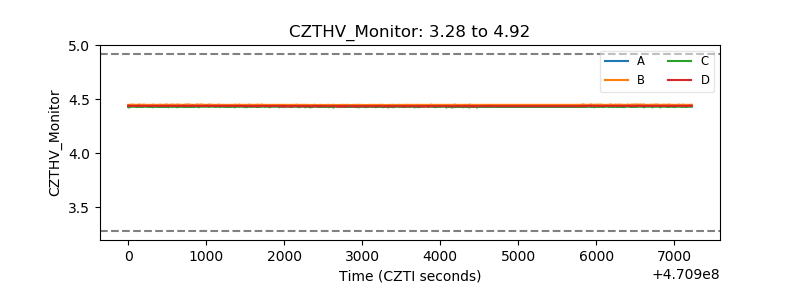 |
| D_VDD | 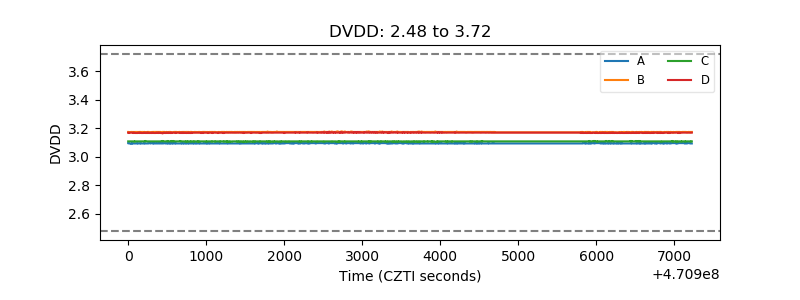 |
| Temperature 1 | 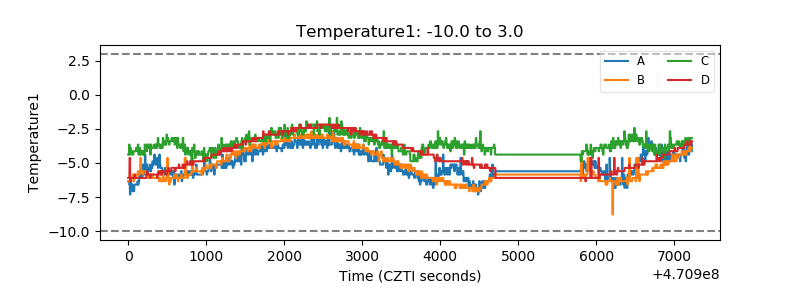 |
| Veto HV Monitor | 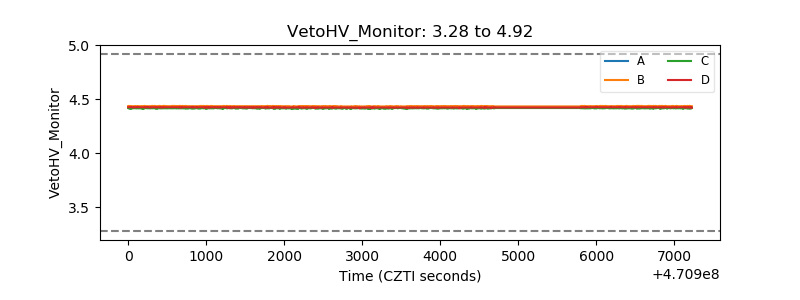 |
| Veto LLD | 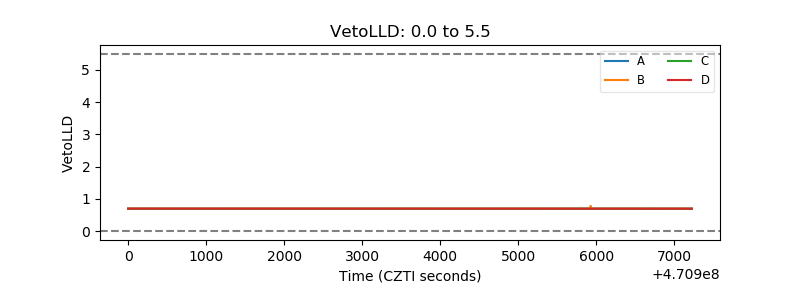 |
| Alpha Counter | 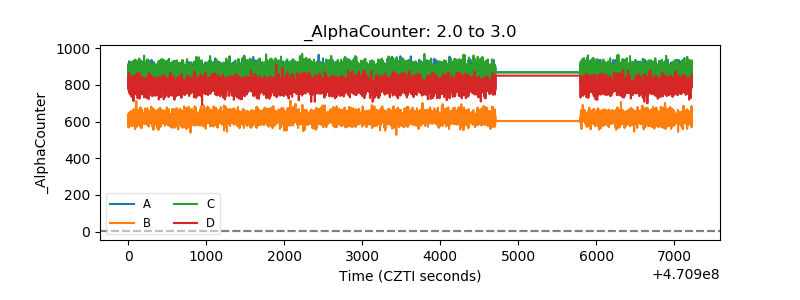 |
| _CPM_Rate | 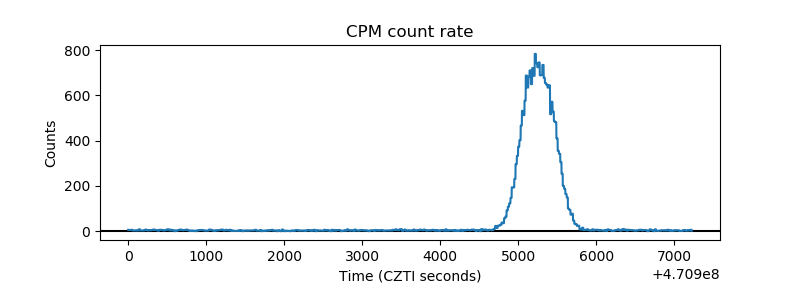 |
| CZT Counter | 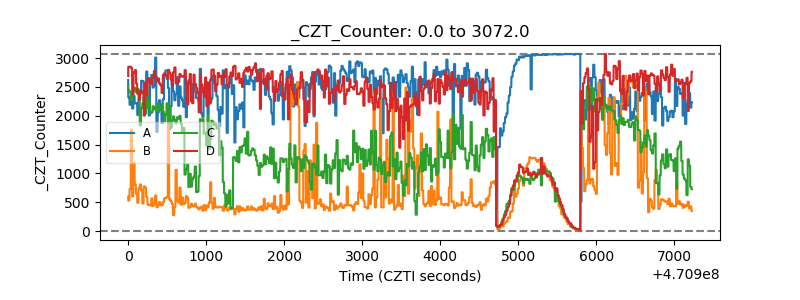 |
| +2.5 Volts monitor | 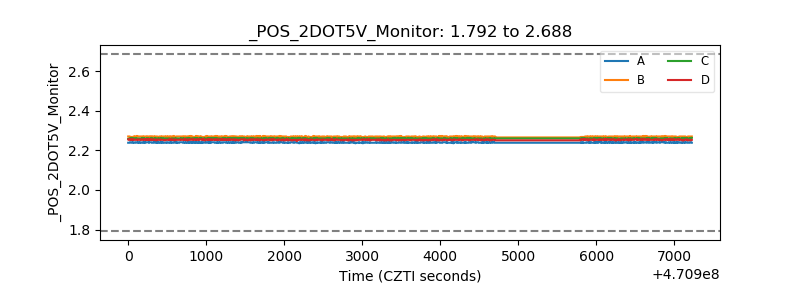 |
| +5 Volts monitor | 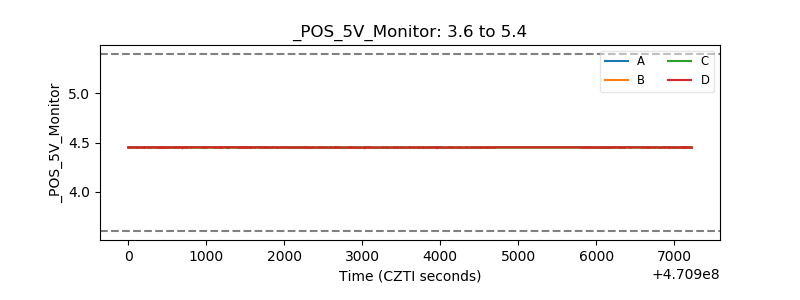 |
| _ROLL_ROT | 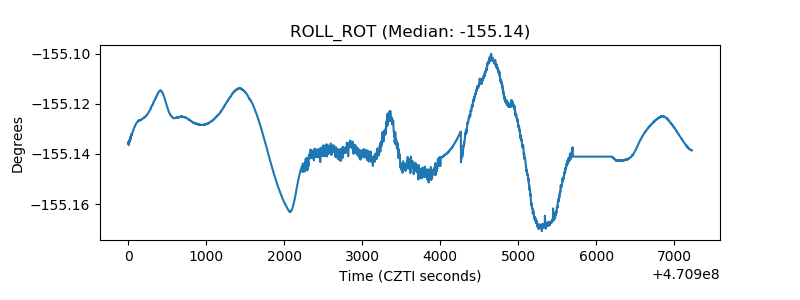 |
| _Roll_DEC | 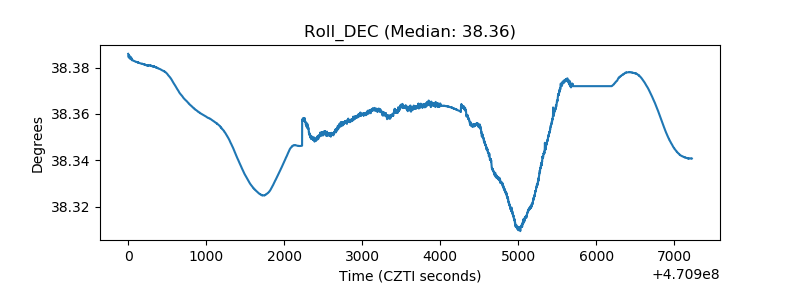 |
| _Roll_RA | 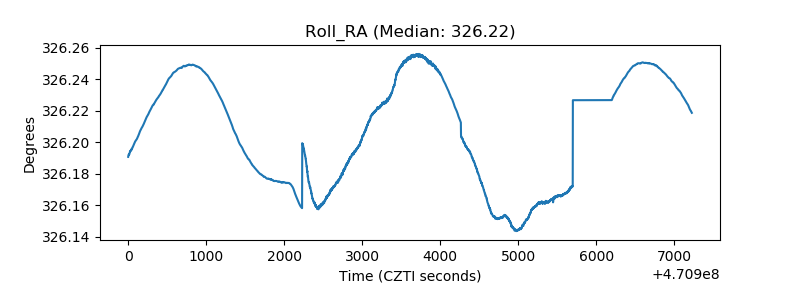 |
| Veto Counter | 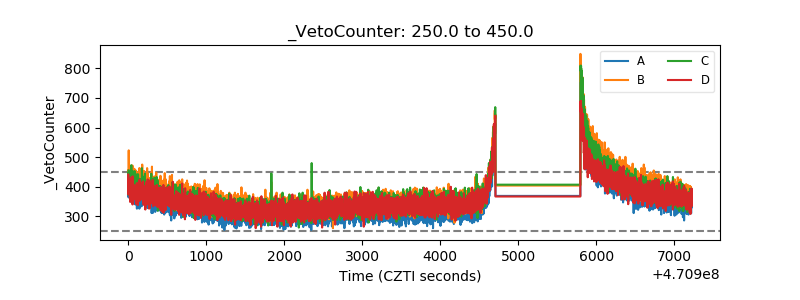 |