| Param | Original file | Final file |
|---|---|---|
| Filename | modeM0/AS1T05_233T01_9000006438_49665cztM0_level2.fits | modeM0/AS1T05_233T01_9000006438_49665cztM0_level2_quad_clean.evt |
| Size (bytes) | 1,202,515,200 | 37,785,600 |
| Size | 1.1 GB | 36.0 MB |
| Events in quadrant A | 14,840,629 | 91,939 |
| Events in quadrant B | 4,917,524 | 605,032 |
| Events in quadrant C | 8,527,872 | 6,269 |
| Events in quadrant D | 15,756,741 | 15,657 |
| Mode M9 | |||
|---|---|---|---|
| Quadrant | BADHDUFLAG | Total packets | Discarded packets |
| A | 0 | 11 | 0 |
| B | 0 | 11 | 0 |
| C | 0 | 11 | 0 |
| D | 0 | 11 | 0 |
| Mode SS | |||
|---|---|---|---|
| Quadrant | BADHDUFLAG | Total packets | Discarded packets |
| A | 0 | 124 | 0 |
| B | 0 | 124 | 0 |
| C | 0 | 124 | 0 |
| D | 0 | 124 | 0 |
| Mode M0 | |||
|---|---|---|---|
| Quadrant | BADHDUFLAG | Total packets | Discarded packets |
| A | 0 | 48179 | 1 |
| B | 0 | 18810 | 3 |
| C | 0 | 29610 | 1 |
| D | 0 | 51040 | 1 |
| Quadrant | Total seconds | Saturated seconds | Saturation percentage |
|---|---|---|---|
| A | 6084 | 5462 | 89.776463% |
| B | 6083 | 707 | 11.622555% |
| C | 6084 | 6040 | 99.276792% |
| D | 6084 | 5967 | 98.076923% |
Noise dominated data is calculated using 1-second bins in cleaned event files. If a bin has >2000 counts, and if more than 50% of those come from <1% of pixels, then it is considered to be noise-dominated and hence unusable.
| Quadrant | # 1 sec bins | Bins with >0 counts | Bins with >2000 counts | High rate bins dominated by noise | Noise dominated (total time) | Noise dominated (detector-on time) | Marked lightcurve |
|---|---|---|---|---|---|---|---|
| A | 7229 | 6085 | 5422 | 5422 | 75.00% | 89.10% | 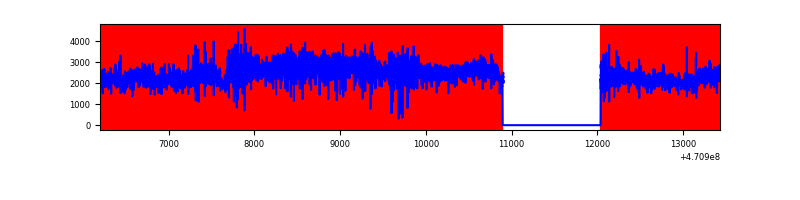 |
| B | 7228 | 6084 | 488 | 488 | 6.75% | 8.02% | 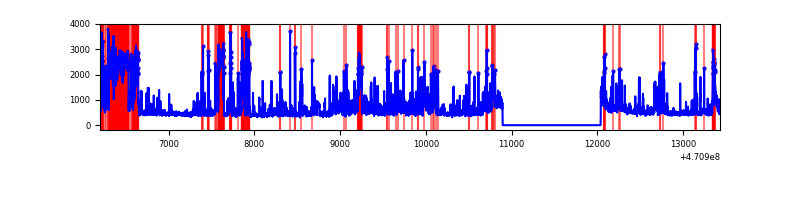 |
| C | 7228 | 6083 | 524 | 524 | 7.25% | 8.61% | 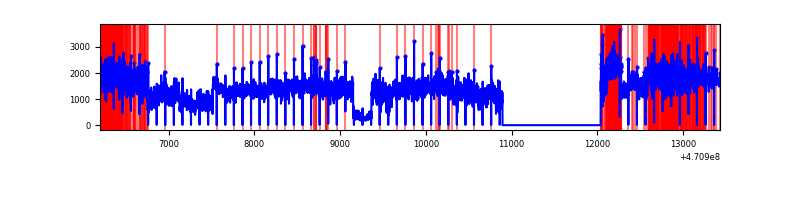 |
| D | 7229 | 6085 | 5582 | 5582 | 77.22% | 91.73% | 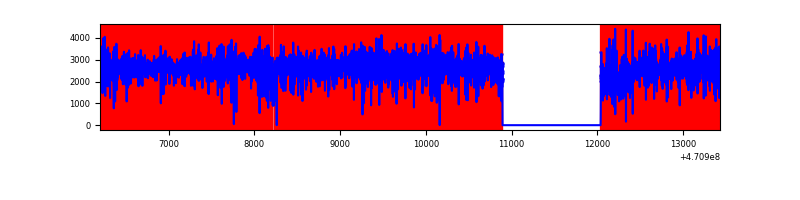 |
Top three noisy pixels from each quadrant. If the there are fewer than three noisy pixels in the level2.evt file, extra rows are filled as -1
| Pixel properties | Quadrant properties | ||||||
|---|---|---|---|---|---|---|---|
| Quadrant | DetID | PixID | Counts | Sigma | Mean | Median | Sigma |
| A | 10 | 83 | 5760312 | 50624.92 | 414 | 403 | 113.8 |
| A | 3 | 130 | 2510407 | 22060.89 | 414 | 403 | 113.8 |
| A | 12 | 50 | 946635 | 8316.61 | 414 | 403 | 113.8 |
| B | 5 | 49 | 838652 | 6107.9 | 640 | 621 | 137.2 |
| B | 4 | 206 | 462957 | 3369.69 | 640 | 621 | 137.2 |
| B | 7 | 0 | 347711 | 2529.73 | 640 | 621 | 137.2 |
| C | 15 | 180 | 2979282 | 107829.07 | 54 | 52 | 27.6 |
| C | 15 | 181 | 891969 | 32281.69 | 54 | 52 | 27.6 |
| C | 15 | 219 | 857502 | 31034.21 | 54 | 52 | 27.6 |
| D | 15 | 40 | 4382736 | 42849.22 | 246 | 231 | 102.3 |
| D | 15 | 184 | 2313226 | 22614.93 | 246 | 231 | 102.3 |
| D | 15 | 140 | 875460 | 8557.41 | 246 | 231 | 102.3 |
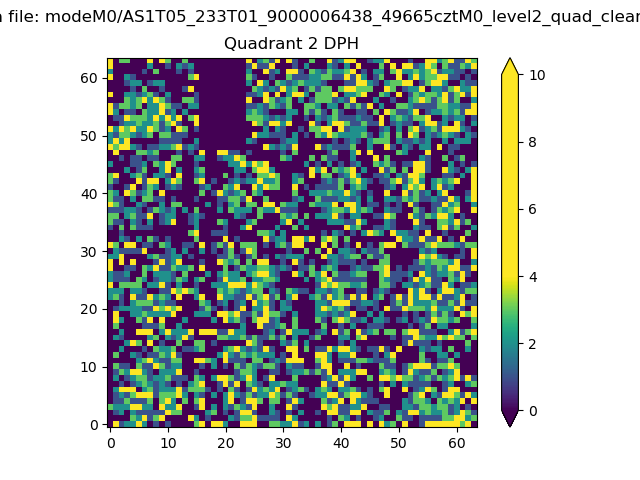
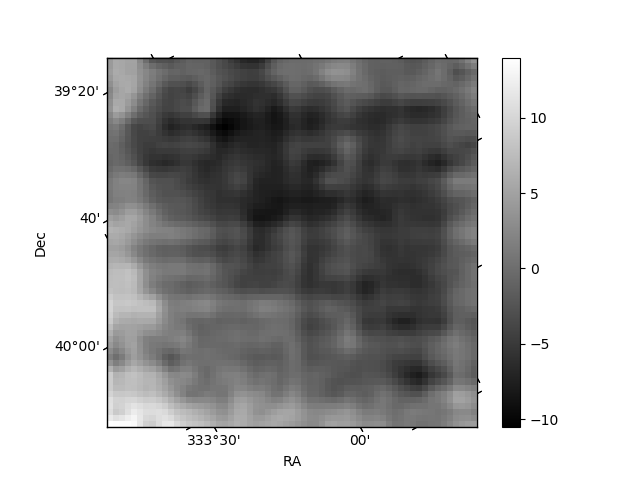
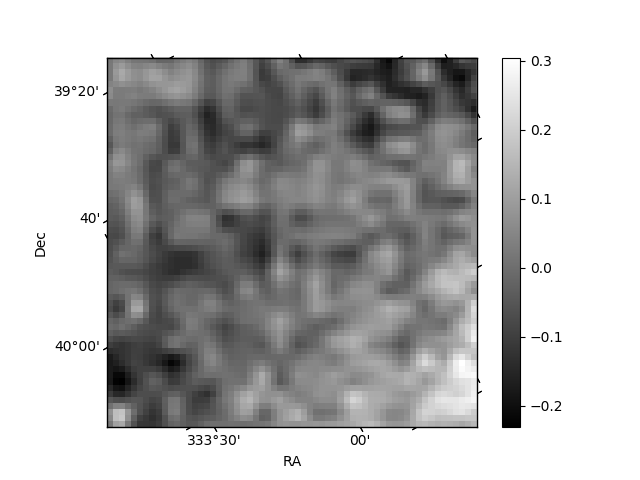
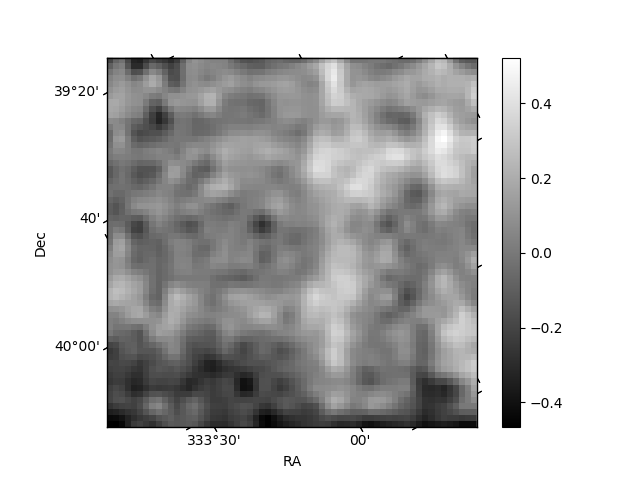
Histogram calculated using DETX and DETY for each event in the final _common_clean file
| Quadrant A | 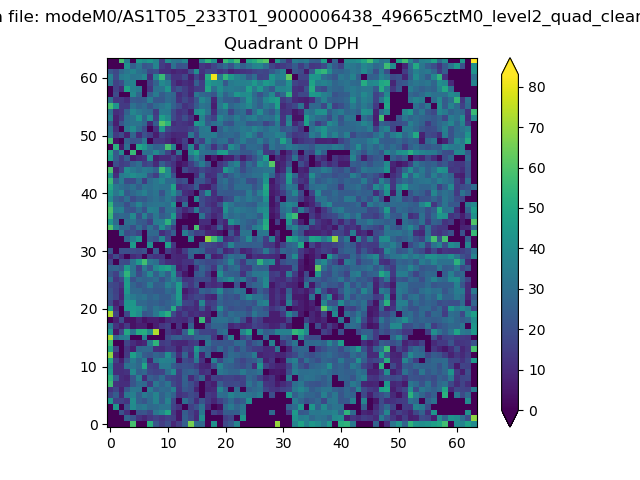 |
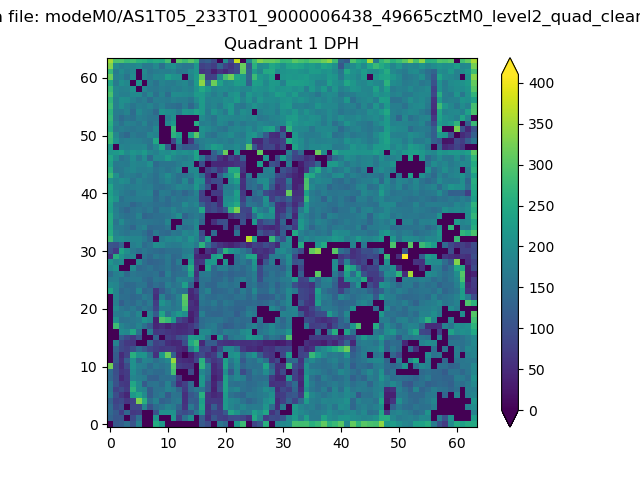 |
Quadrant B |
|---|---|---|---|
| Quadrant D | 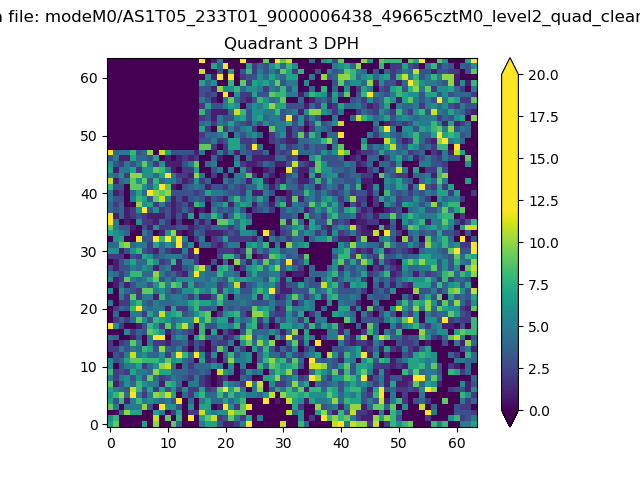 |
 |
Quadrant C |
| Plot type | Count rate plots | Images |
|---|---|---|
| Comparison with Poisson distribution Blue bars denote a histogram of data divided into 1 sec bins. Red curve is a Poisson curve with rate = median count rate of data. |
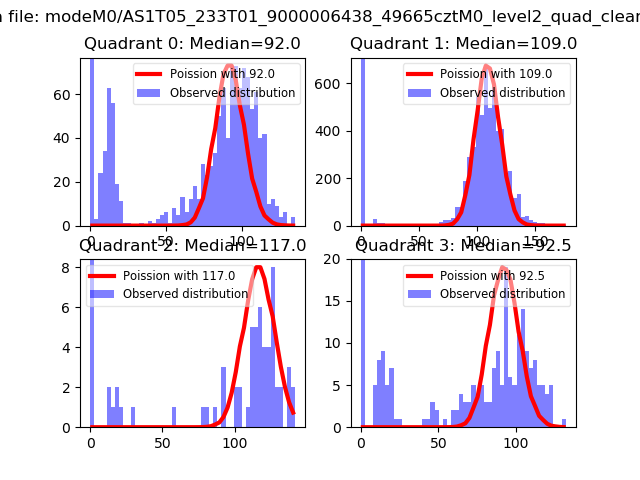 |
 |
| Quadrant-wise count rates Data is divided into 100 sec bins |
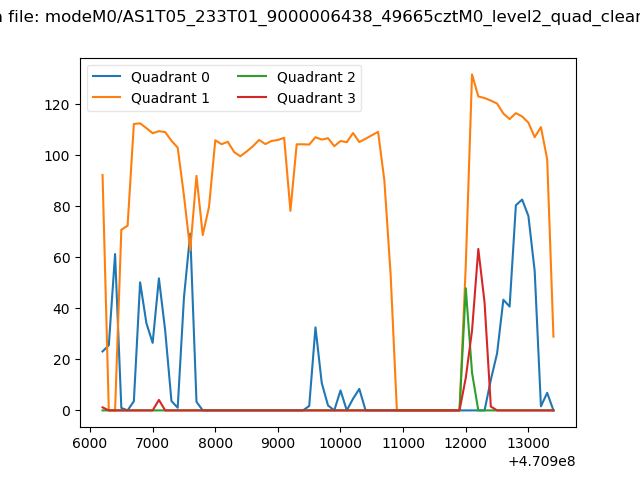 |
|
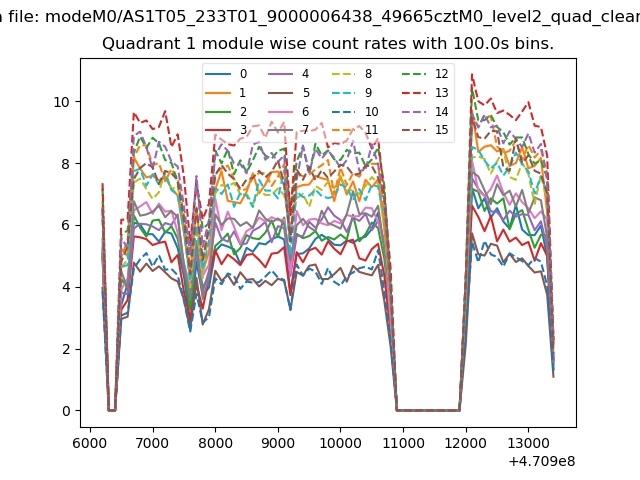
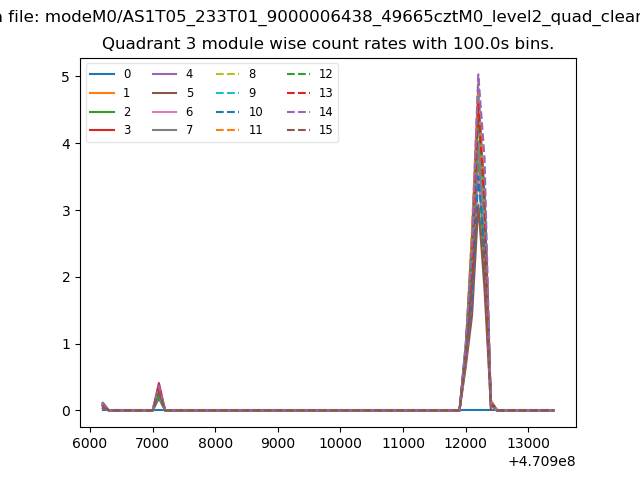
| Module-wise count rates for Quadrant A Data is divided into 100 sec bins |
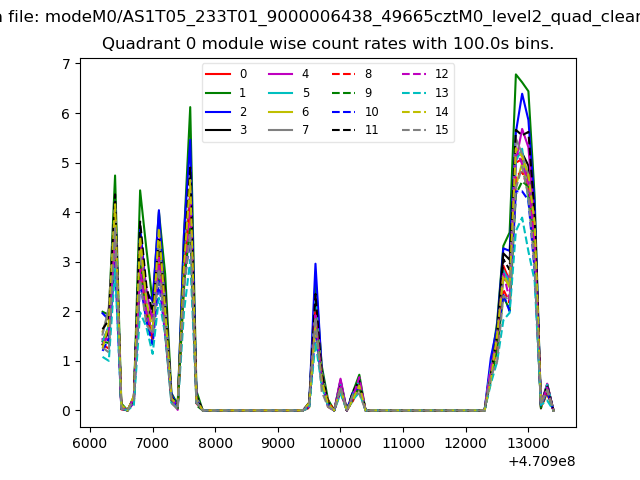 |
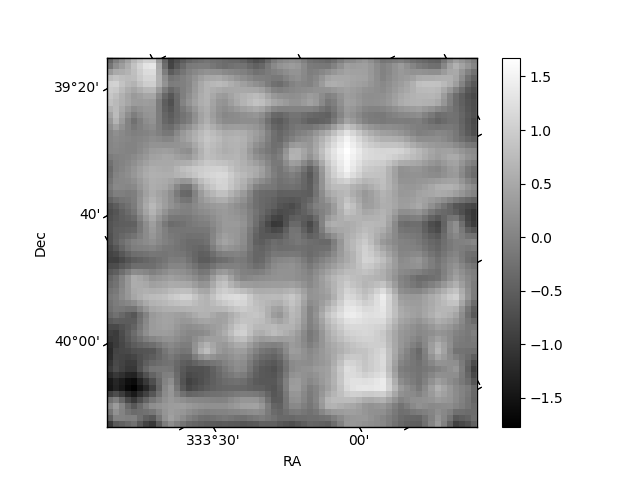 |
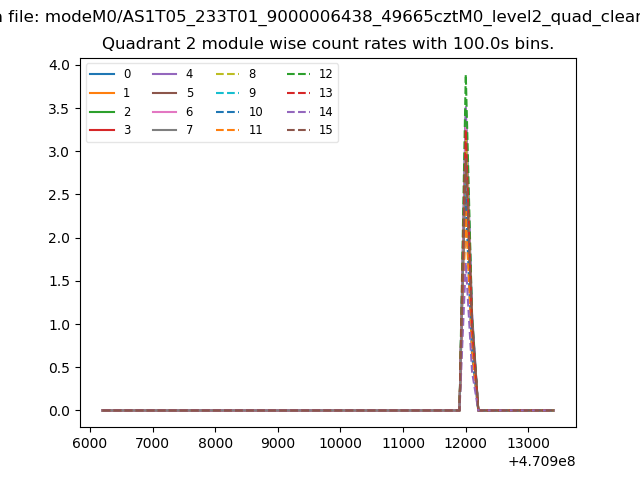
| Module-wise count rates for Quadrant B Data is divided into 100 sec bins |
 |
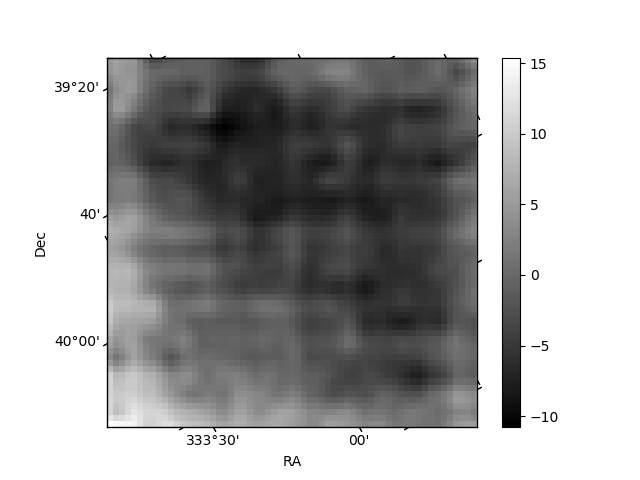 |
| Module-wise count rates for Quadrant C Data is divided into 100 sec bins |
 |
 |
| Module-wise count rates for Quadrant D Data is divided into 100 sec bins |
 |
 |
| Parameter | Plot |
|---|---|
| CZT HV Monitor | 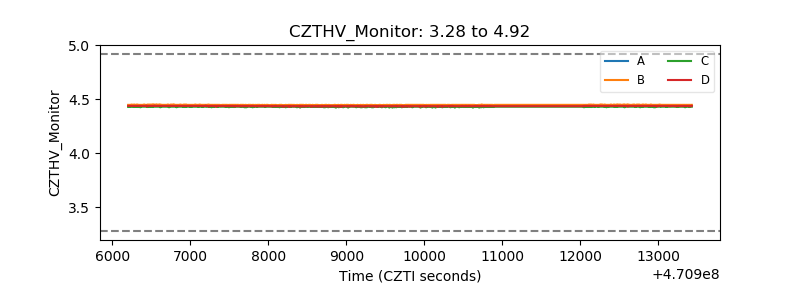 |
| D_VDD | 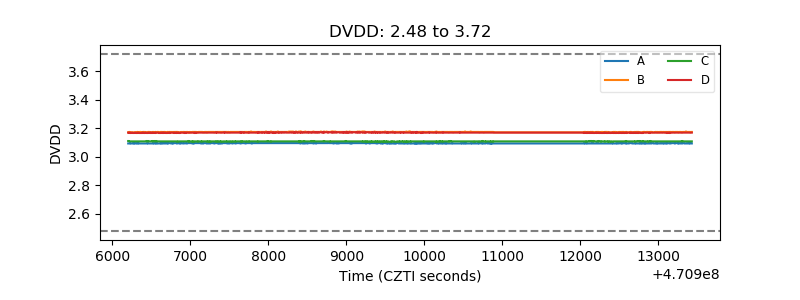 |
| Temperature 1 | 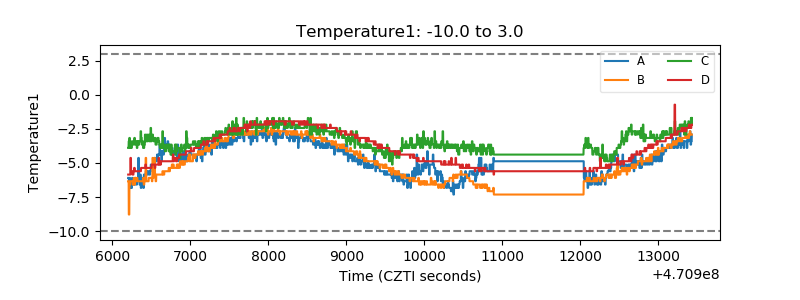 |
| Veto HV Monitor | 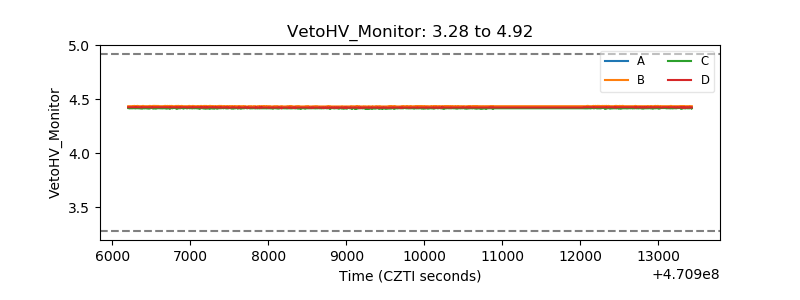 |
| Veto LLD | 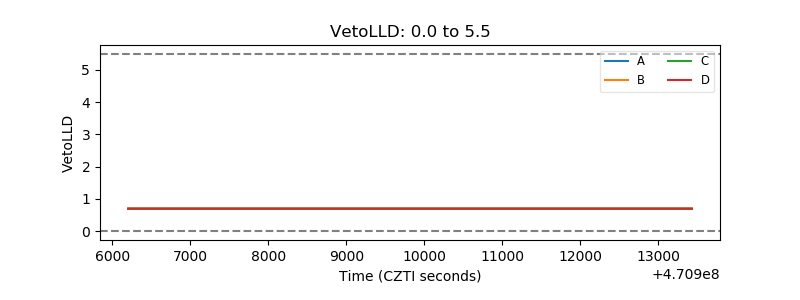 |
| Alpha Counter | 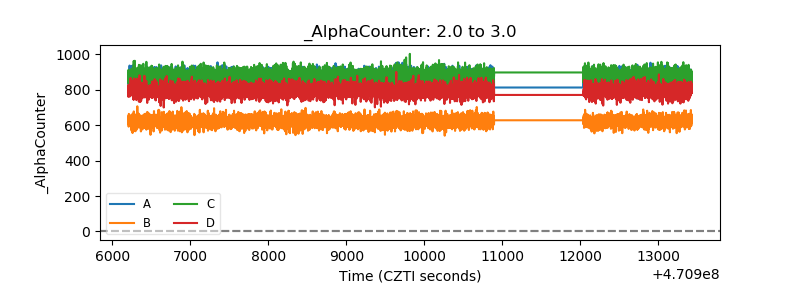 |
| _CPM_Rate | 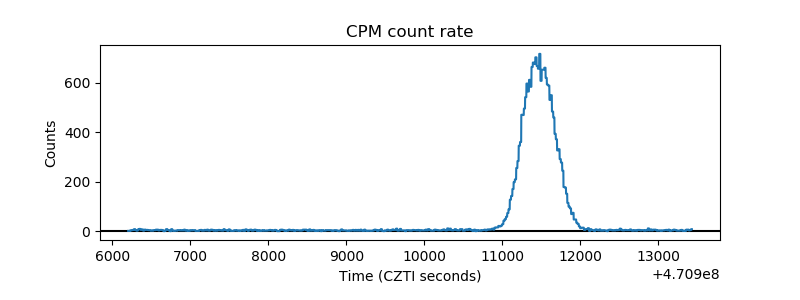 |
| CZT Counter | 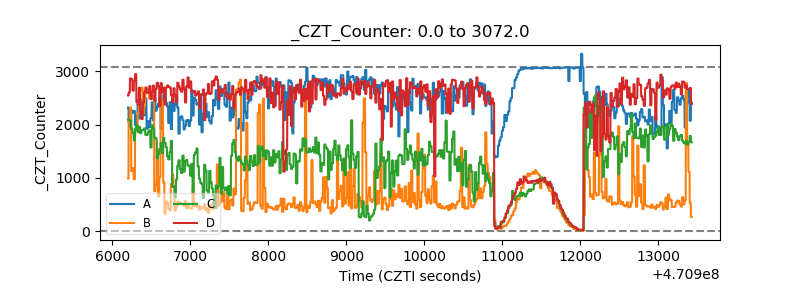 |
| +2.5 Volts monitor | 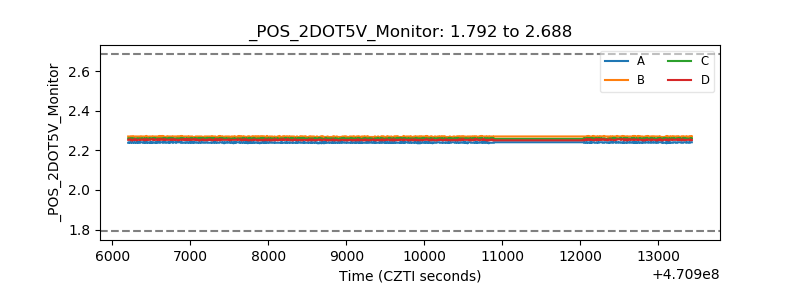 |
| +5 Volts monitor | 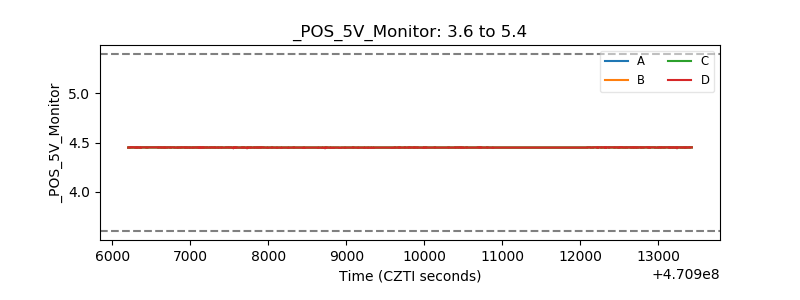 |
| _ROLL_ROT | 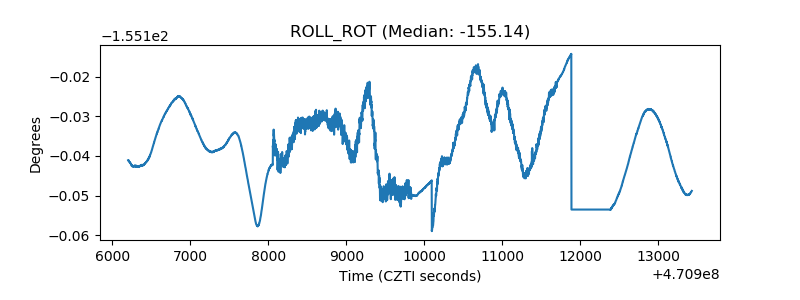 |
| _Roll_DEC | 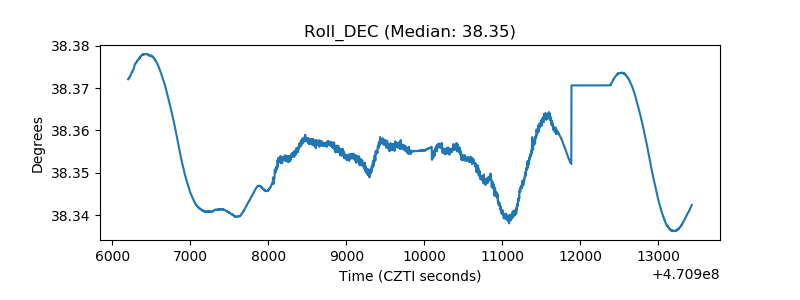 |
| _Roll_RA | 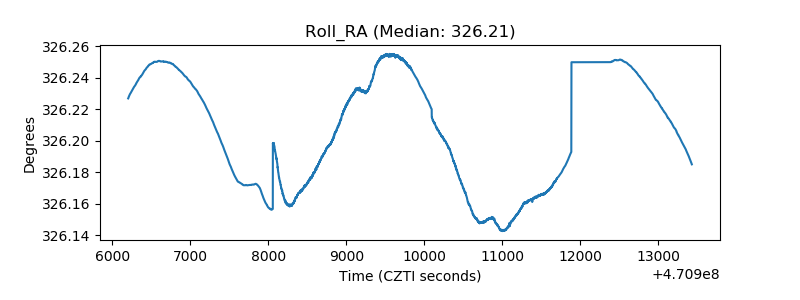 |
| Veto Counter | 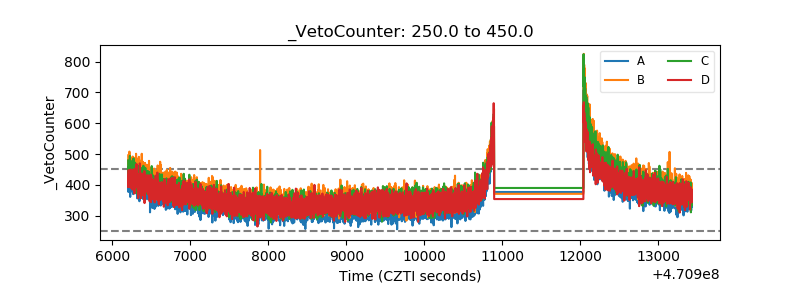 |