| Param | Original file | Final file |
|---|---|---|
| Filename | modeM0/AS1T05_233T01_9000006438_49666cztM0_level2.fits | modeM0/AS1T05_233T01_9000006438_49666cztM0_level2_quad_clean.evt |
| Size (bytes) | 1,228,288,320 | 37,615,680 |
| Size | 1.1 GB | 35.9 MB |
| Events in quadrant A | 15,021,854 | 73,020 |
| Events in quadrant B | 5,225,016 | 618,470 |
| Events in quadrant C | 9,129,770 | 2,618 |
| Events in quadrant D | 15,612,702 | 13,150 |
| Mode M9 | |||
|---|---|---|---|
| Quadrant | BADHDUFLAG | Total packets | Discarded packets |
| A | 0 | 10 | 0 |
| B | 0 | 10 | 0 |
| C | 0 | 10 | 0 |
| D | 0 | 10 | 0 |
| Mode SS | |||
|---|---|---|---|
| Quadrant | BADHDUFLAG | Total packets | Discarded packets |
| A | 0 | 126 | 0 |
| B | 0 | 126 | 0 |
| C | 0 | 126 | 0 |
| D | 0 | 126 | 0 |
| Mode M0 | |||
|---|---|---|---|
| Quadrant | BADHDUFLAG | Total packets | Discarded packets |
| A | 0 | 48860 | 1 |
| B | 0 | 19731 | 1 |
| C | 0 | 31364 | 1 |
| D | 0 | 50721 | 1 |
| Quadrant | Total seconds | Saturated seconds | Saturation percentage |
|---|---|---|---|
| A | 6180 | 5694 | 92.135922% |
| B | 6180 | 711 | 11.504854% |
| C | 6181 | 6164 | 99.724964% |
| D | 6181 | 6069 | 98.187995% |
Noise dominated data is calculated using 1-second bins in cleaned event files. If a bin has >2000 counts, and if more than 50% of those come from <1% of pixels, then it is considered to be noise-dominated and hence unusable.
| Quadrant | # 1 sec bins | Bins with >0 counts | Bins with >2000 counts | High rate bins dominated by noise | Noise dominated (total time) | Noise dominated (detector-on time) | Marked lightcurve |
|---|---|---|---|---|---|---|---|
| A | 7270 | 6181 | 5494 | 5494 | 75.57% | 88.89% | 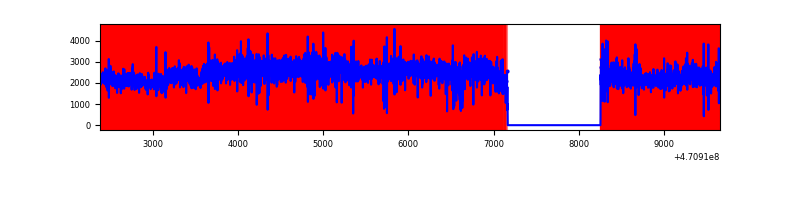 |
| B | 7270 | 6181 | 436 | 436 | 6.00% | 7.05% | 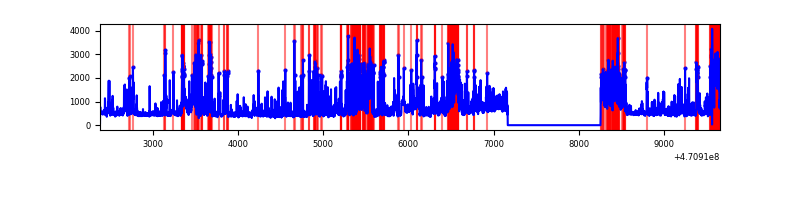 |
| C | 7270 | 6179 | 842 | 842 | 11.58% | 13.63% | 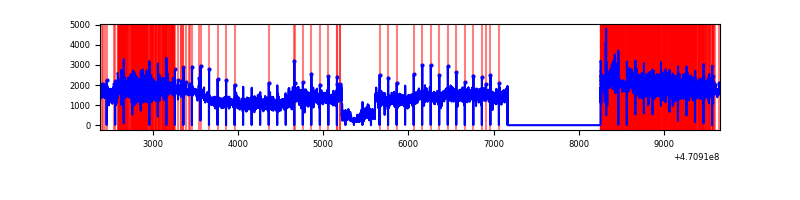 |
| D | 7271 | 6181 | 5385 | 5385 | 74.06% | 87.12% | 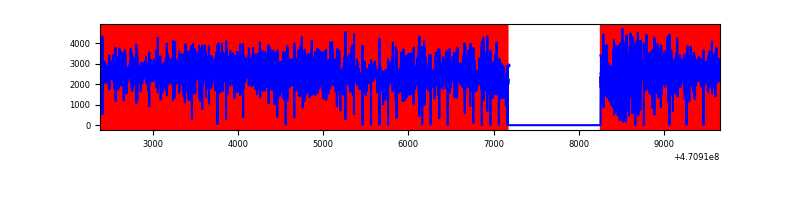 |
Top three noisy pixels from each quadrant. If the there are fewer than three noisy pixels in the level2.evt file, extra rows are filled as -1
| Pixel properties | Quadrant properties | ||||||
|---|---|---|---|---|---|---|---|
| Quadrant | DetID | PixID | Counts | Sigma | Mean | Median | Sigma |
| A | 10 | 83 | 5774643 | 45326.21 | 418 | 404 | 127.4 |
| A | 0 | 98 | 1669149 | 13099.2 | 418 | 404 | 127.4 |
| A | 3 | 130 | 1189689 | 9335.56 | 418 | 404 | 127.4 |
| B | 7 | 0 | 1180451 | 8361.05 | 663 | 644 | 141.1 |
| B | 4 | 206 | 456580 | 3231.13 | 663 | 644 | 141.1 |
| B | 10 | 57 | 147546 | 1041.06 | 663 | 644 | 141.1 |
| C | 15 | 180 | 3615995 | 147582.0 | 62 | 61 | 24.5 |
| C | 15 | 163 | 806845 | 32928.36 | 62 | 61 | 24.5 |
| C | 15 | 197 | 799464 | 32627.11 | 62 | 61 | 24.5 |
| D | 15 | 40 | 3865384 | 50720.63 | 184 | 173 | 76.2 |
| D | 9 | 49 | 1647746 | 21620.02 | 184 | 173 | 76.2 |
| D | 8 | 176 | 1349401 | 17705.03 | 184 | 173 | 76.2 |
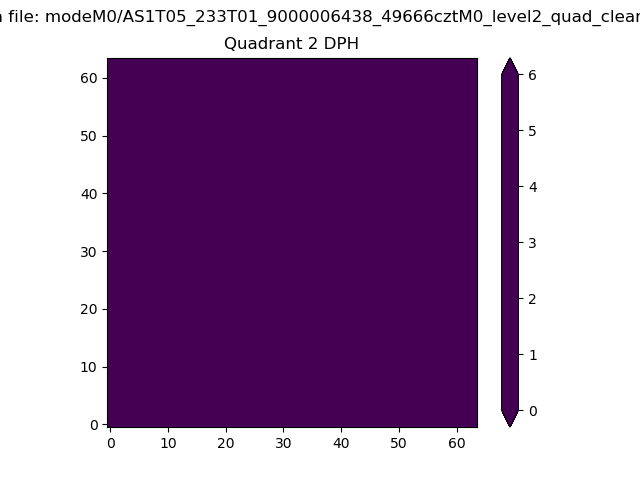
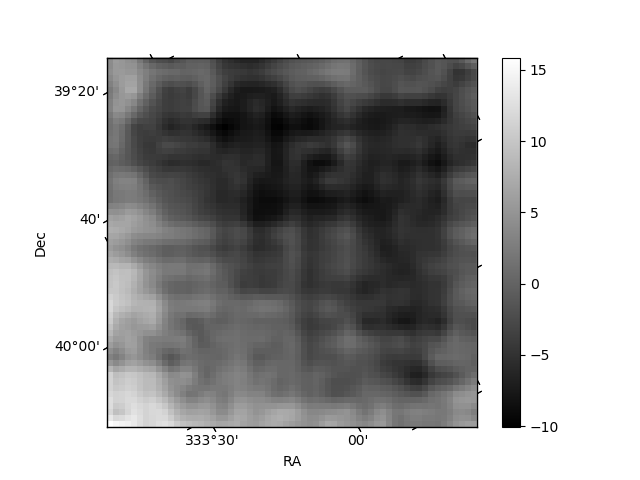
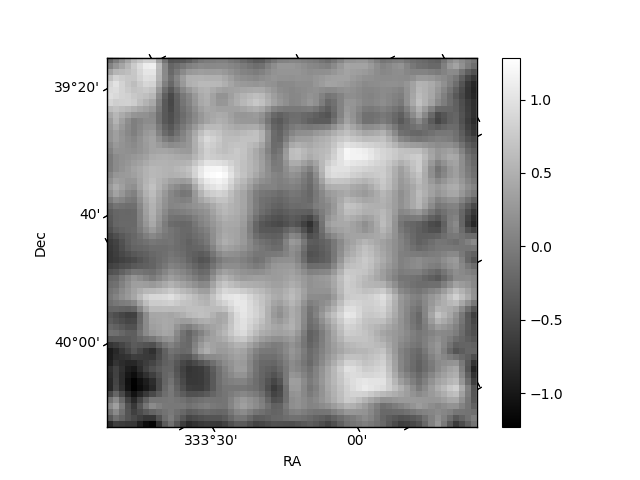
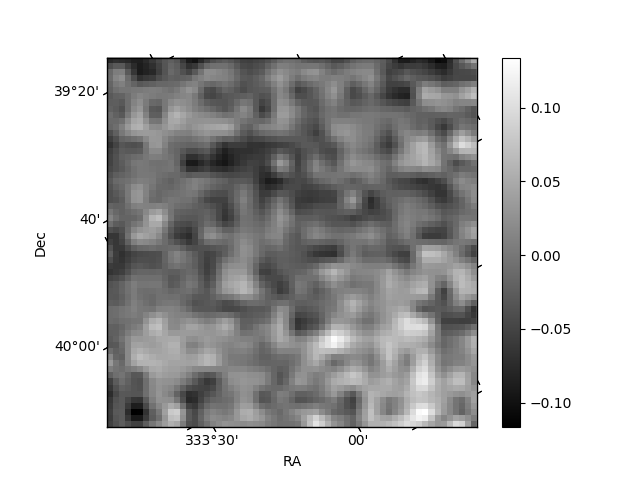
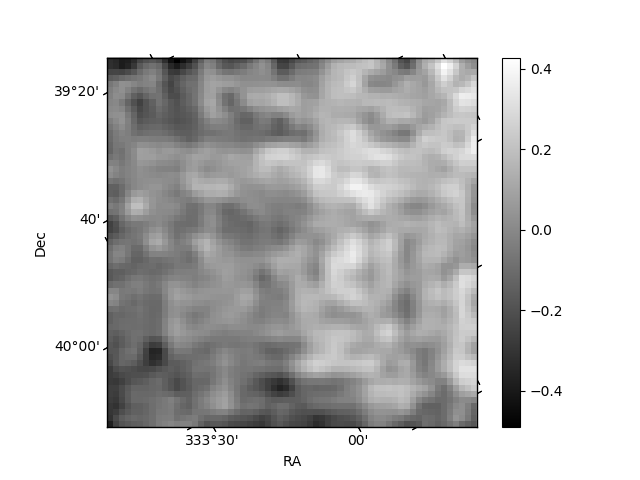
Histogram calculated using DETX and DETY for each event in the final _common_clean file
| Quadrant A | 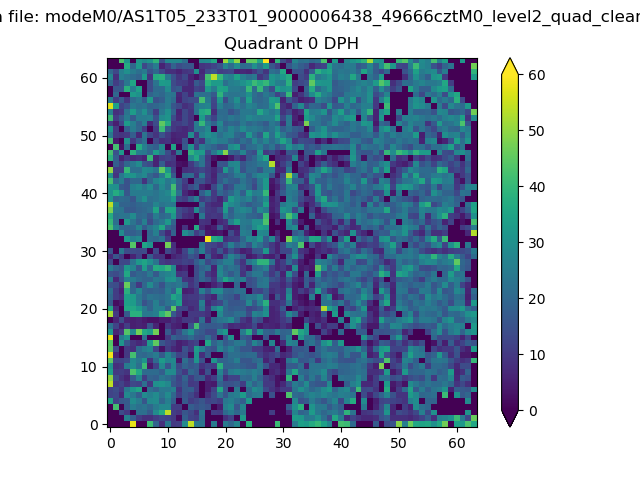 |
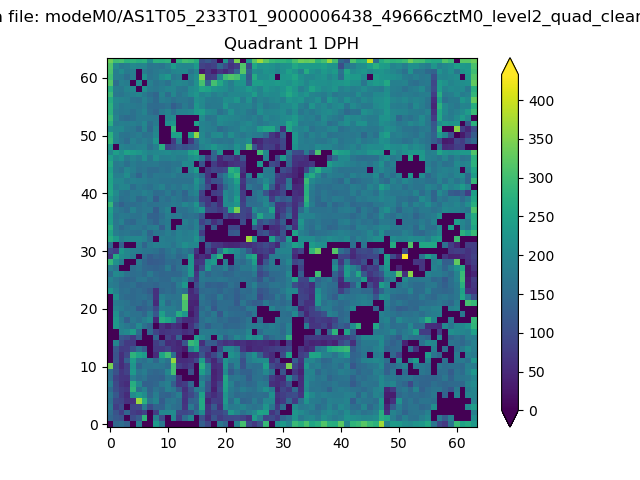 |
Quadrant B |
|---|---|---|---|
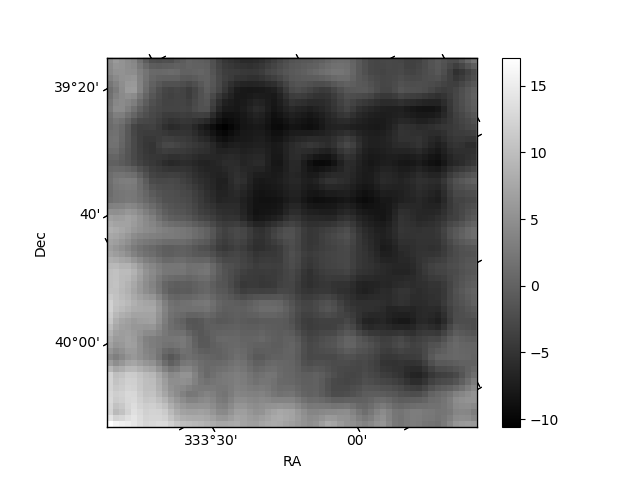
| Quadrant D | 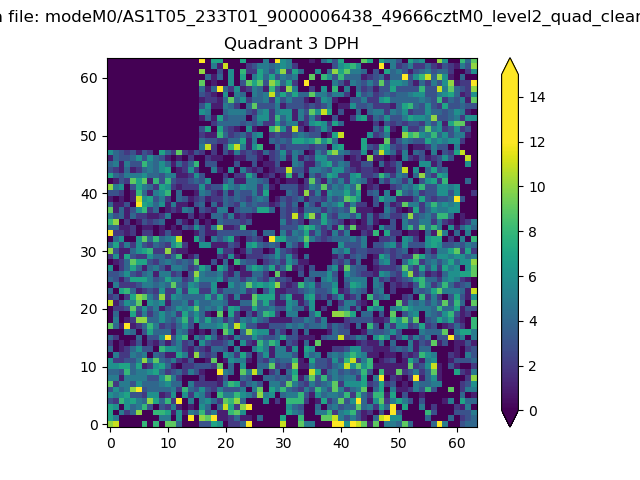 |
 |
Quadrant C |
| Plot type | Count rate plots | Images |
|---|---|---|
| Comparison with Poisson distribution Blue bars denote a histogram of data divided into 1 sec bins. Red curve is a Poisson curve with rate = median count rate of data. |
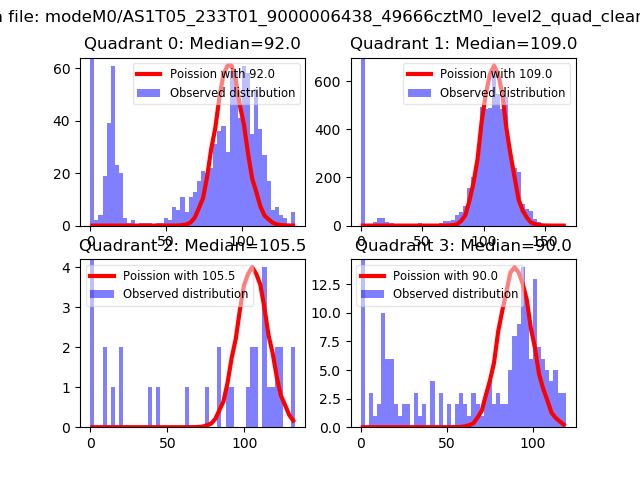 |
 |
| Quadrant-wise count rates Data is divided into 100 sec bins |
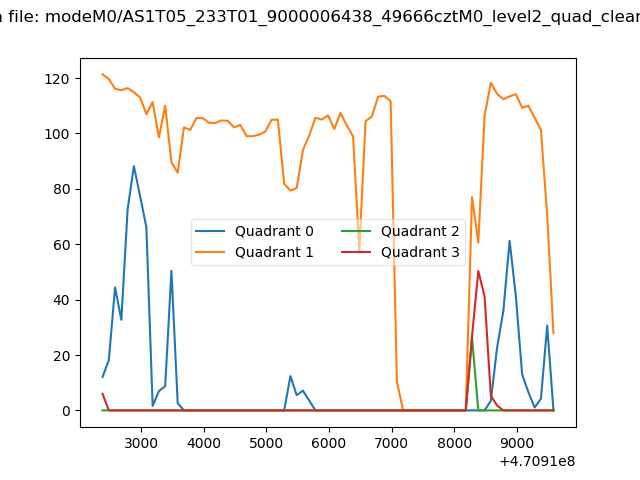 |
|
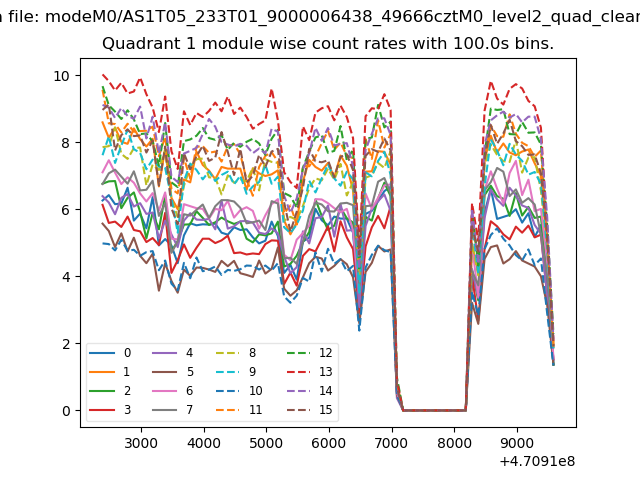
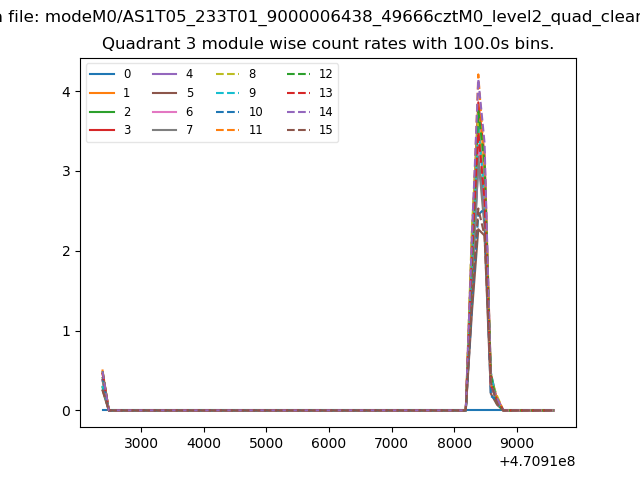
| Module-wise count rates for Quadrant A Data is divided into 100 sec bins |
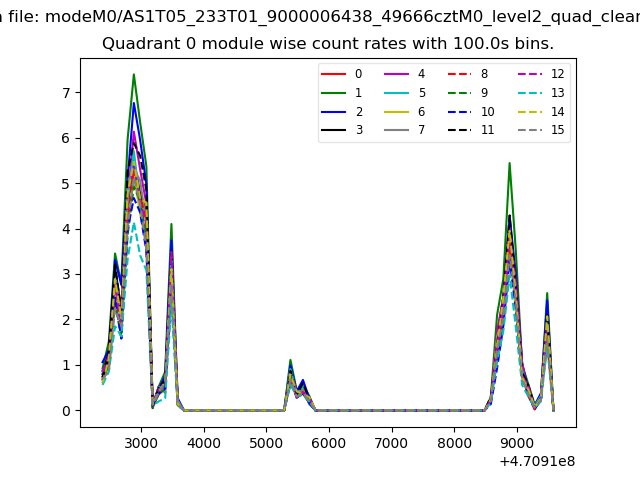 |
 |
| Module-wise count rates for Quadrant B Data is divided into 100 sec bins |
 |
 |
| Module-wise count rates for Quadrant C Data is divided into 100 sec bins |
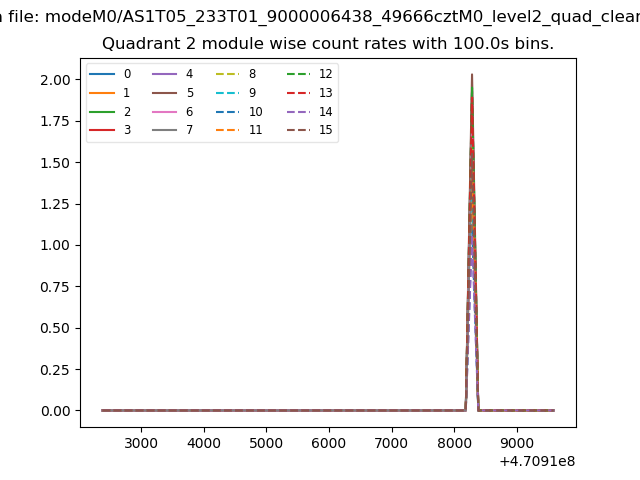 |
 |
| Module-wise count rates for Quadrant D Data is divided into 100 sec bins |
 |
 |
| Parameter | Plot |
|---|---|
| CZT HV Monitor | 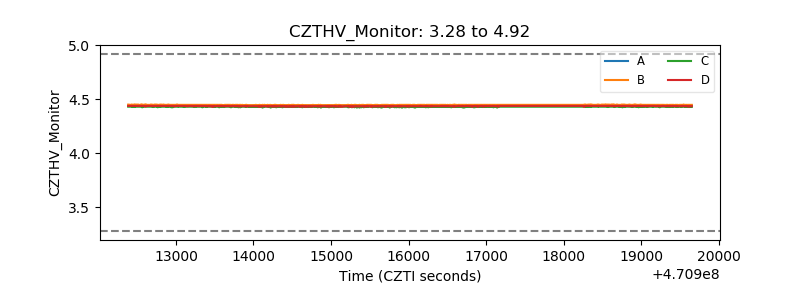 |
| D_VDD | 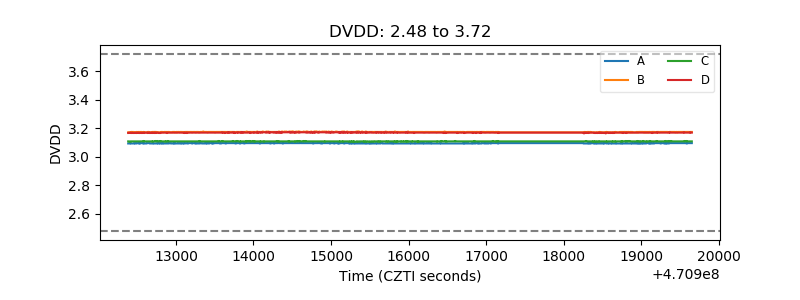 |
| Temperature 1 | 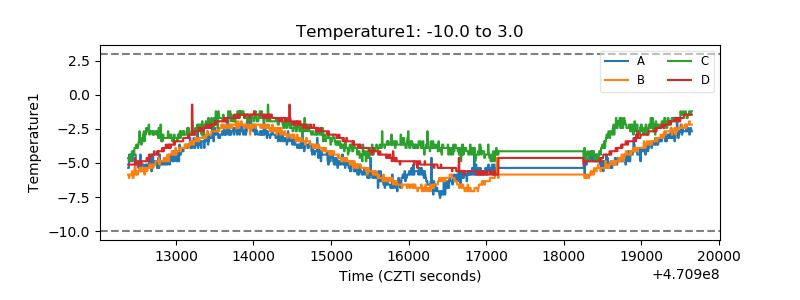 |
| Veto HV Monitor |  |
| Veto LLD | 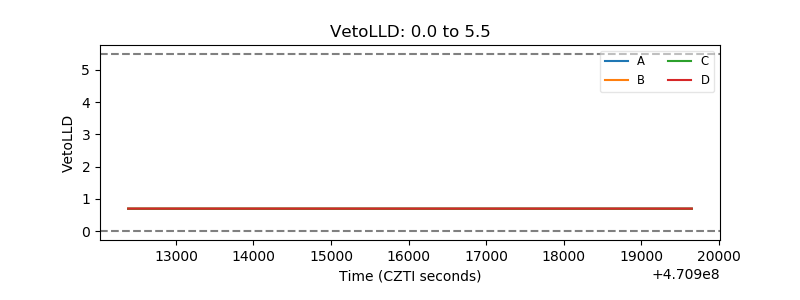 |
| Alpha Counter | 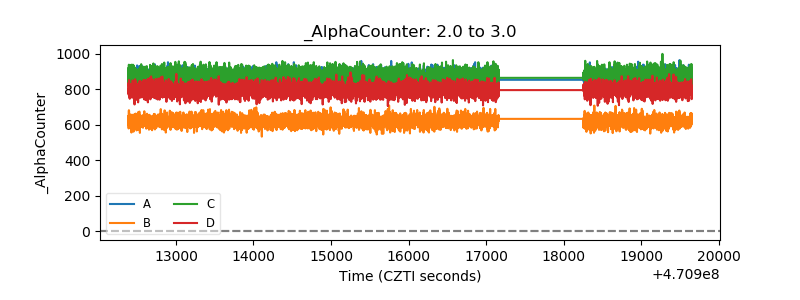 |
| _CPM_Rate | 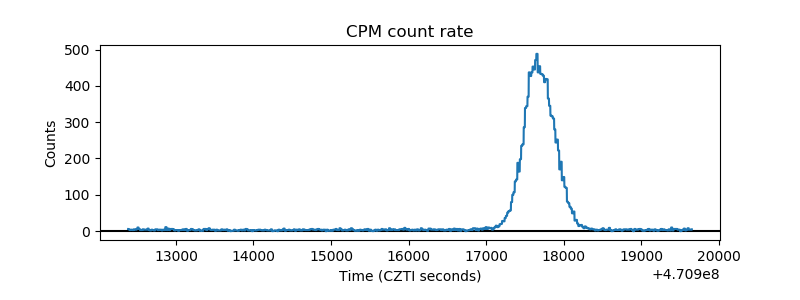 |
| CZT Counter | 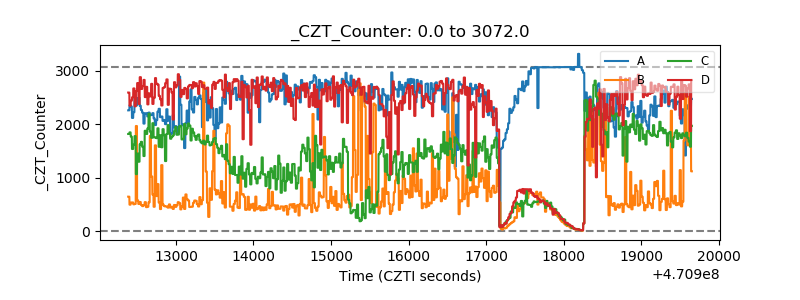 |
| +2.5 Volts monitor | 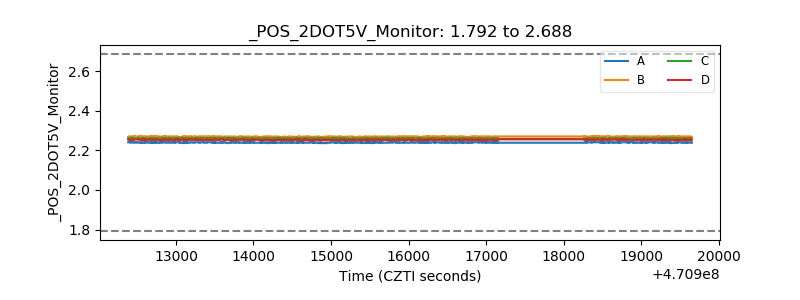 |
| +5 Volts monitor | 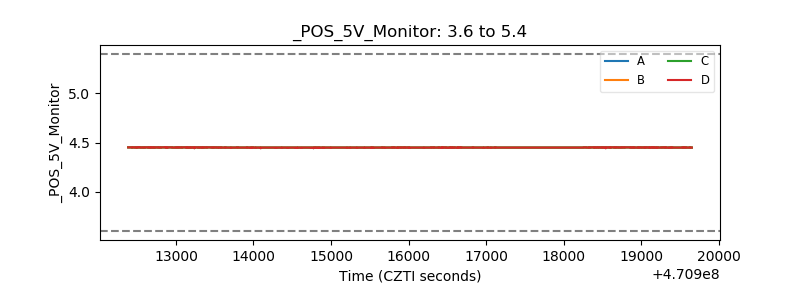 |
| _ROLL_ROT | 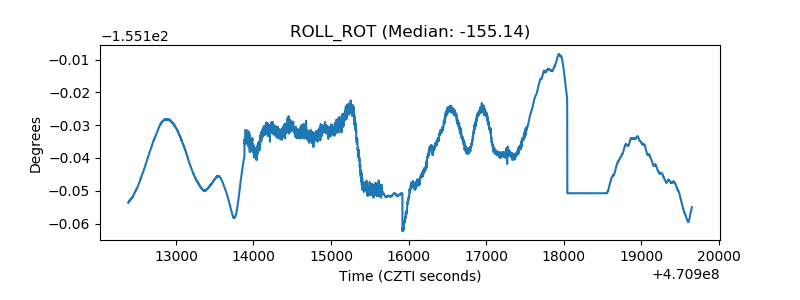 |
| _Roll_DEC | 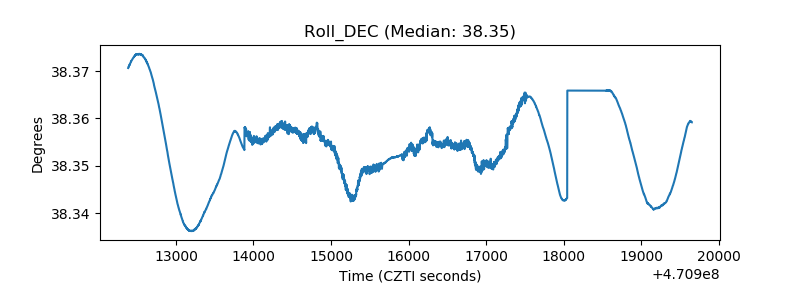 |
| _Roll_RA | 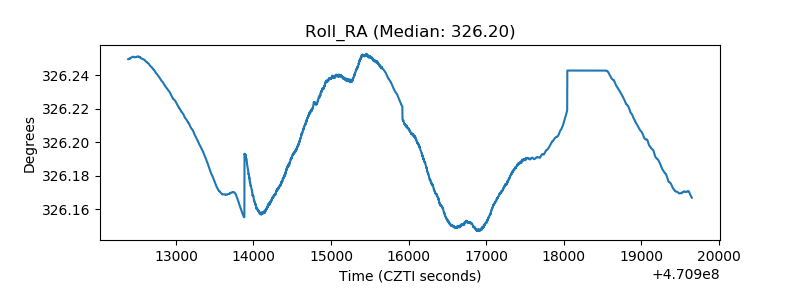 |
| Veto Counter | 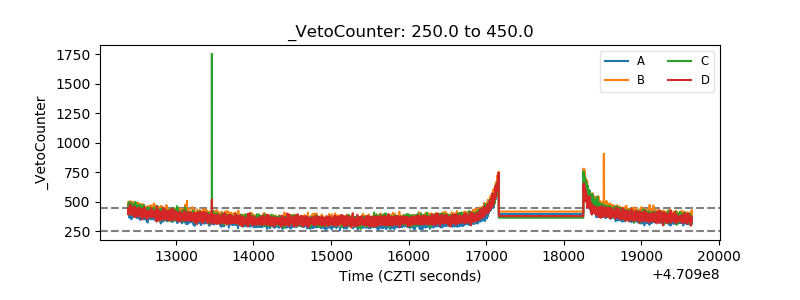 |