| Param | Original file | Final file |
|---|---|---|
| Filename | modeM0/AS1T05_233T01_9000006438_49667cztM0_level2.fits | modeM0/AS1T05_233T01_9000006438_49667cztM0_level2_quad_clean.evt |
| Size (bytes) | 1,318,066,560 | 36,889,920 |
| Size | 1.2 GB | 35.2 MB |
| Events in quadrant A | 16,098,143 | 29,725 |
| Events in quadrant B | 5,349,172 | 629,195 |
| Events in quadrant C | 10,451,514 | 1,944 |
| Events in quadrant D | 16,397,350 | 8,566 |
| Mode M9 | |||
|---|---|---|---|
| Quadrant | BADHDUFLAG | Total packets | Discarded packets |
| A | 0 | 9 | 0 |
| B | 0 | 9 | 0 |
| C | 0 | 9 | 0 |
| D | 0 | 9 | 0 |
| Mode SS | |||
|---|---|---|---|
| Quadrant | BADHDUFLAG | Total packets | Discarded packets |
| A | 0 | 132 | 0 |
| B | 0 | 132 | 0 |
| C | 0 | 132 | 0 |
| D | 0 | 132 | 0 |
| Mode M0 | |||
|---|---|---|---|
| Quadrant | BADHDUFLAG | Total packets | Discarded packets |
| A | 0 | 52168 | 1 |
| B | 0 | 20217 | 1 |
| C | 0 | 35434 | 1 |
| D | 0 | 53122 | 1 |
| Quadrant | Total seconds | Saturated seconds | Saturation percentage |
|---|---|---|---|
| A | 6402 | 6214 | 97.063418% |
| B | 6402 | 703 | 10.980943% |
| C | 6403 | 6391 | 99.812588% |
| D | 6403 | 6332 | 98.891145% |
Noise dominated data is calculated using 1-second bins in cleaned event files. If a bin has >2000 counts, and if more than 50% of those come from <1% of pixels, then it is considered to be noise-dominated and hence unusable.
| Quadrant | # 1 sec bins | Bins with >0 counts | Bins with >2000 counts | High rate bins dominated by noise | Noise dominated (total time) | Noise dominated (detector-on time) | Marked lightcurve |
|---|---|---|---|---|---|---|---|
| A | 7337 | 6403 | 5803 | 5803 | 79.09% | 90.63% | 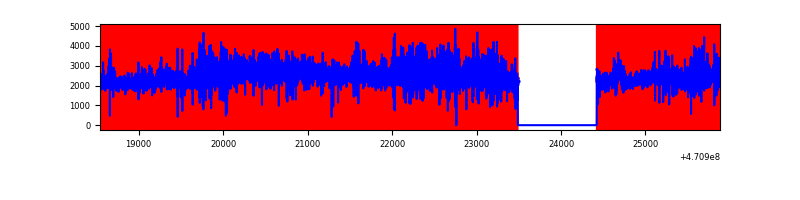 |
| B | 7337 | 6403 | 484 | 484 | 6.60% | 7.56% | 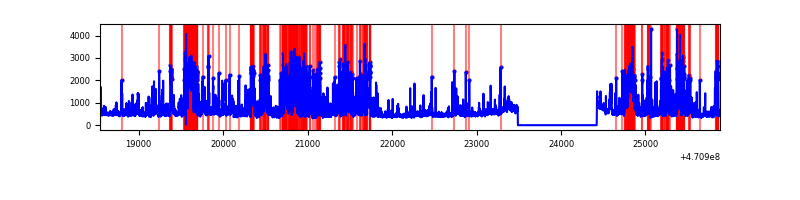 |
| C | 7337 | 6399 | 1080 | 1080 | 14.72% | 16.88% | 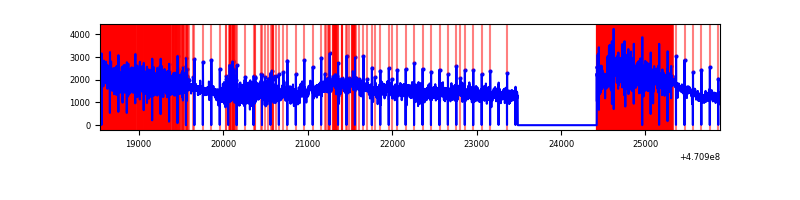 |
| D | 7338 | 6404 | 5655 | 5655 | 77.06% | 88.30% | 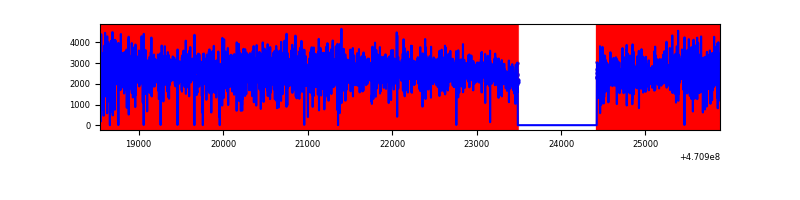 |
Top three noisy pixels from each quadrant. If the there are fewer than three noisy pixels in the level2.evt file, extra rows are filled as -1
| Pixel properties | Quadrant properties | ||||||
|---|---|---|---|---|---|---|---|
| Quadrant | DetID | PixID | Counts | Sigma | Mean | Median | Sigma |
| A | 10 | 83 | 5308064 | 46748.22 | 365 | 352 | 113.5 |
| A | 3 | 130 | 3182963 | 28031.18 | 365 | 352 | 113.5 |
| A | 12 | 50 | 1195774 | 10528.8 | 365 | 352 | 113.5 |
| B | 7 | 0 | 1143470 | 7888.96 | 684 | 664 | 144.9 |
| B | 4 | 206 | 464118 | 3199.29 | 684 | 664 | 144.9 |
| B | 3 | 232 | 234405 | 1613.55 | 684 | 664 | 144.9 |
| C | 15 | 180 | 4934724 | 111761.14 | 82 | 78 | 44.2 |
| C | 15 | 163 | 883670 | 20011.82 | 82 | 78 | 44.2 |
| C | 15 | 181 | 828028 | 18751.63 | 82 | 78 | 44.2 |
| D | 15 | 40 | 4953039 | 48645.4 | 240 | 225 | 101.8 |
| D | 12 | 191 | 1617255 | 15882.1 | 240 | 225 | 101.8 |
| D | 15 | 140 | 906589 | 8902.1 | 240 | 225 | 101.8 |
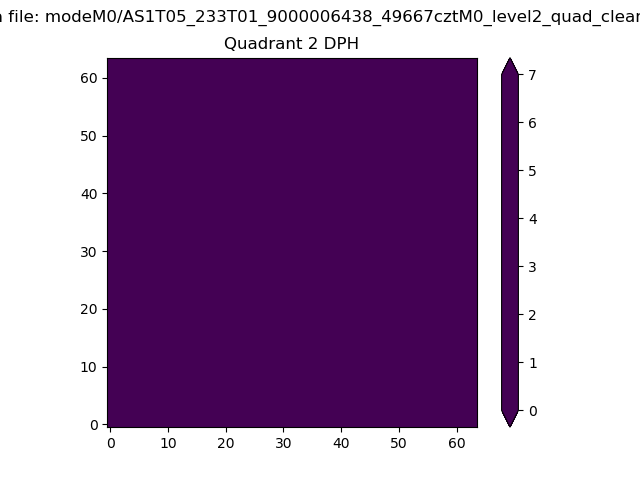
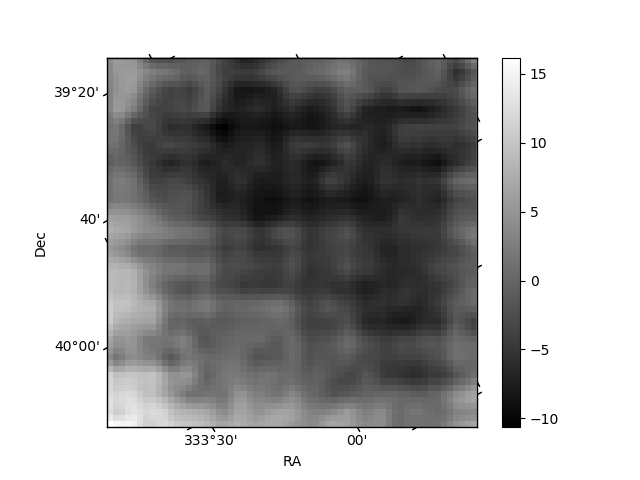
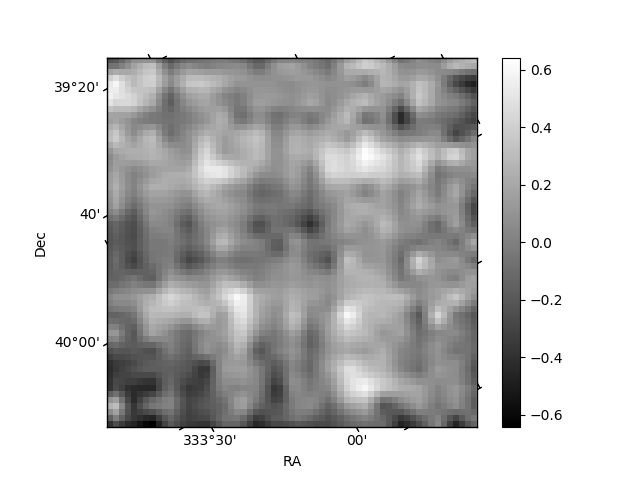
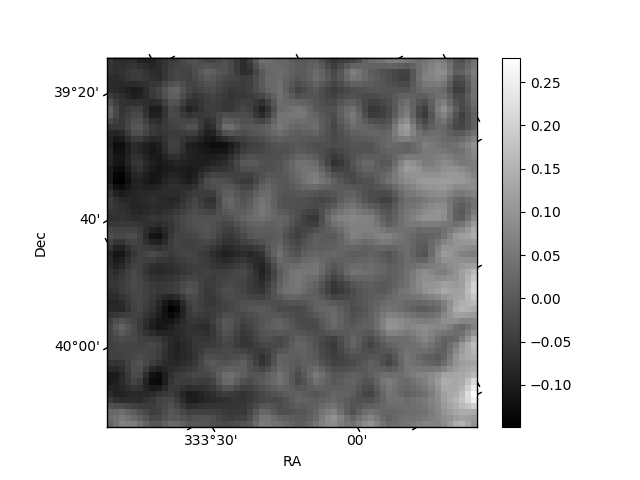
Histogram calculated using DETX and DETY for each event in the final _common_clean file
| Quadrant A | 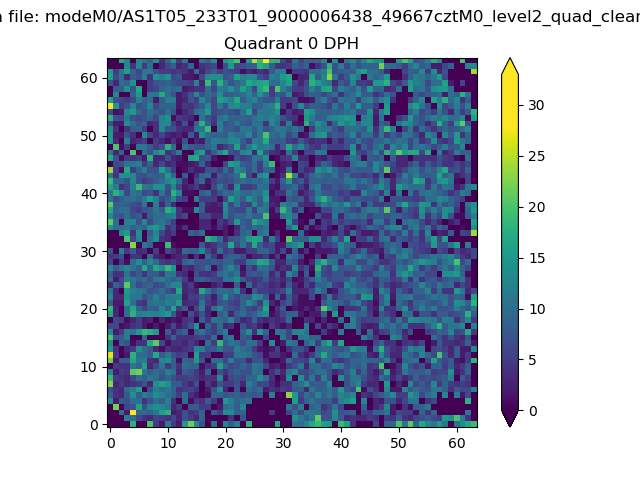 |
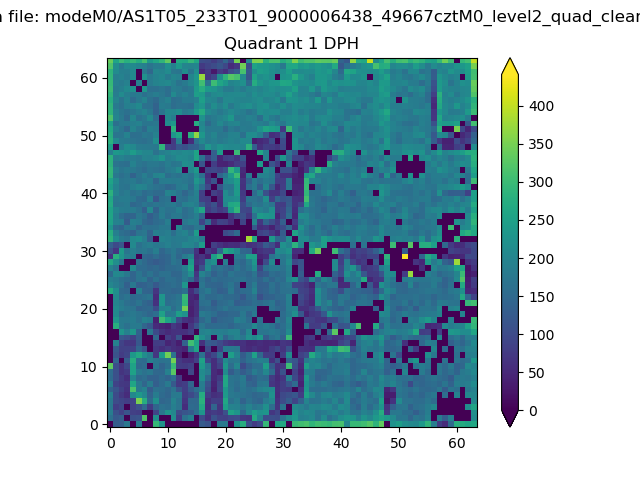 |
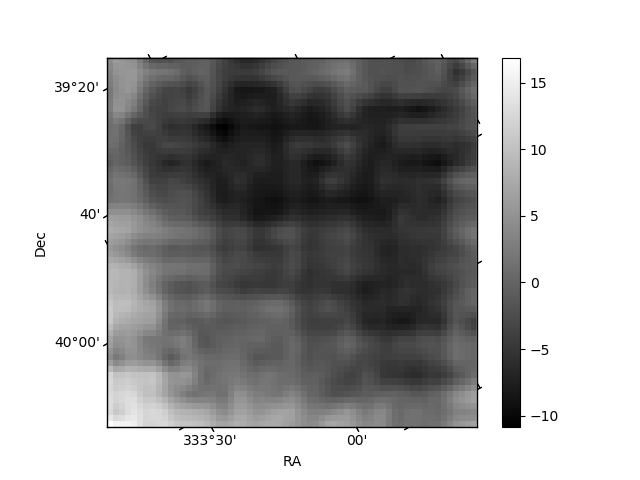
Quadrant B |
|---|---|---|---|
| Quadrant D | 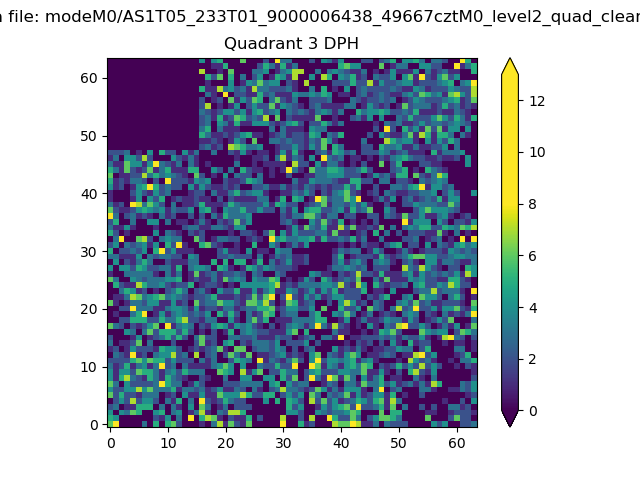 |
 |
Quadrant C |
| Plot type | Count rate plots | Images |
|---|---|---|
| Comparison with Poisson distribution Blue bars denote a histogram of data divided into 1 sec bins. Red curve is a Poisson curve with rate = median count rate of data. |
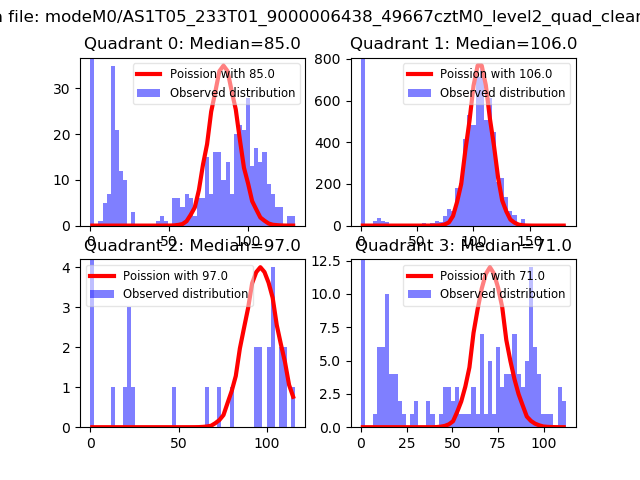 |
 |
| Quadrant-wise count rates Data is divided into 100 sec bins |
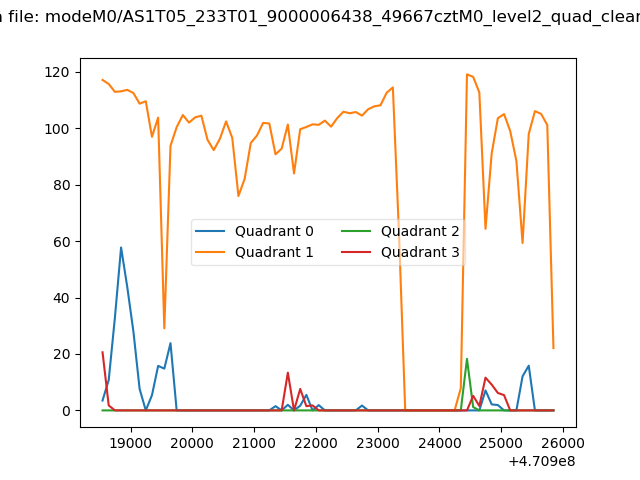 |
|
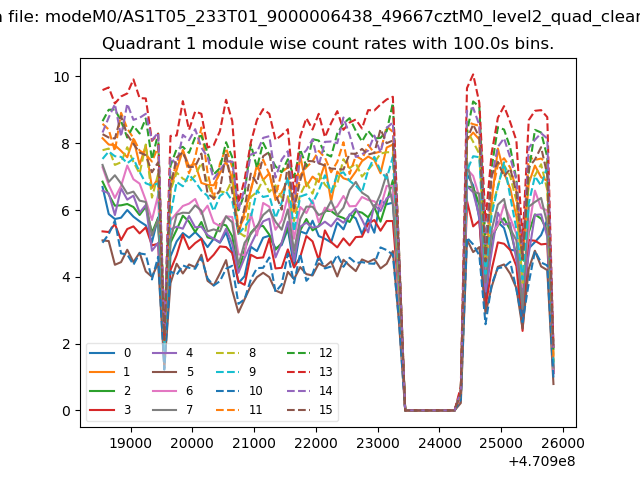
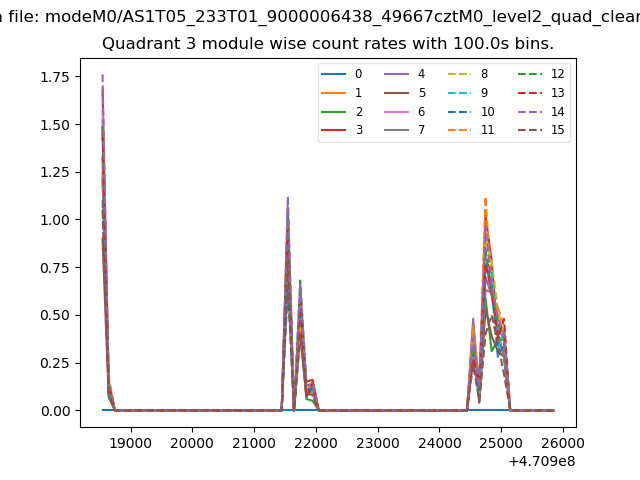
| Module-wise count rates for Quadrant A Data is divided into 100 sec bins |
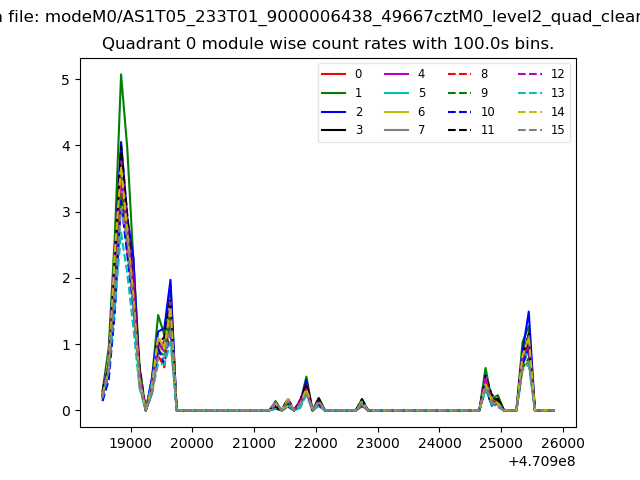 |
 |
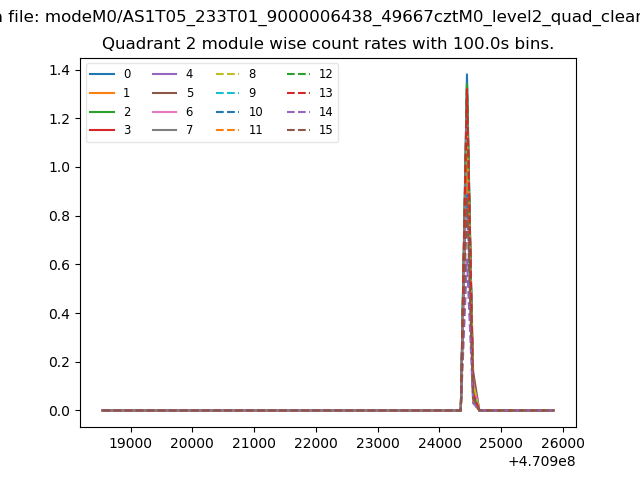
| Module-wise count rates for Quadrant B Data is divided into 100 sec bins |
 |
 |
| Module-wise count rates for Quadrant C Data is divided into 100 sec bins |
 |
 |
| Module-wise count rates for Quadrant D Data is divided into 100 sec bins |
 |
 |
| Parameter | Plot |
|---|---|
| CZT HV Monitor | 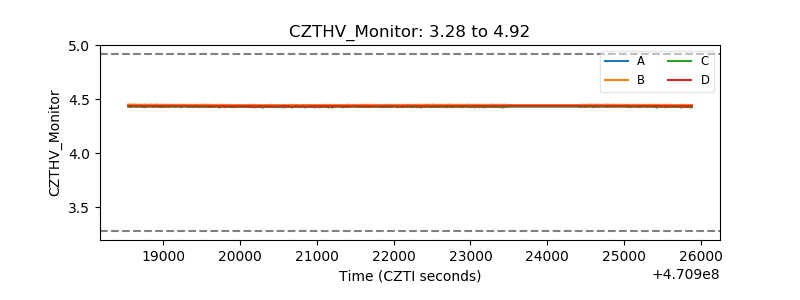 |
| D_VDD | 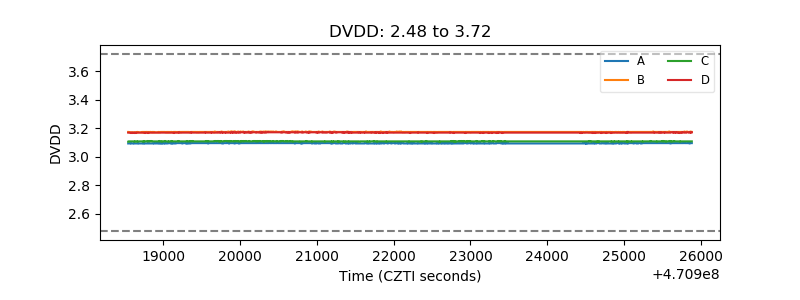 |
| Temperature 1 | 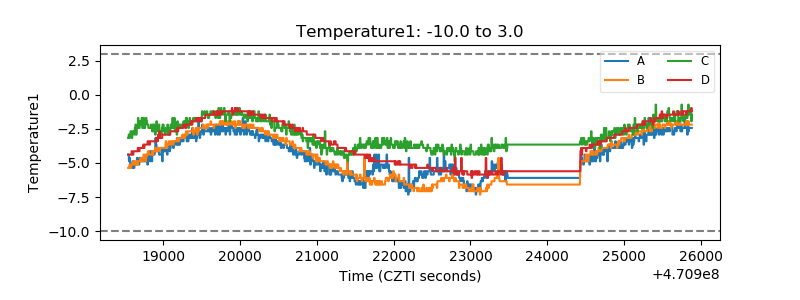 |
| Veto HV Monitor | 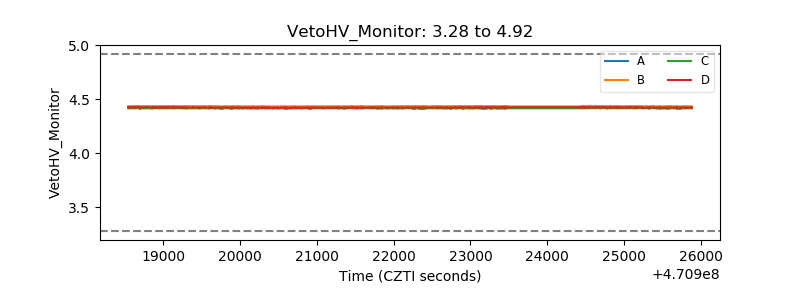 |
| Veto LLD | 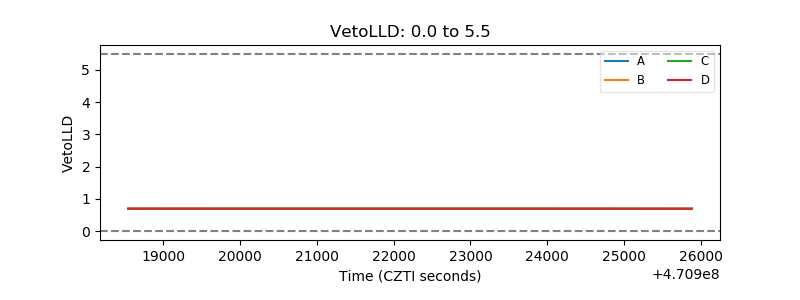 |
| Alpha Counter | 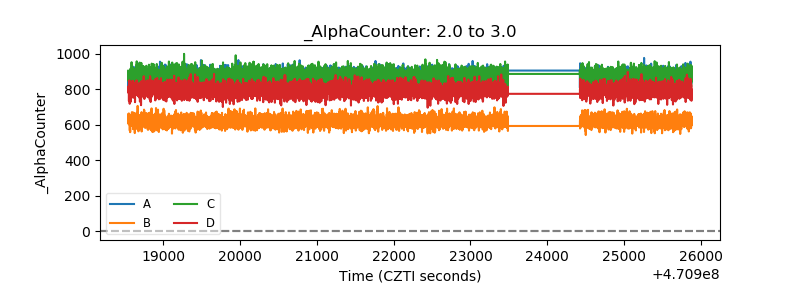 |
| _CPM_Rate | 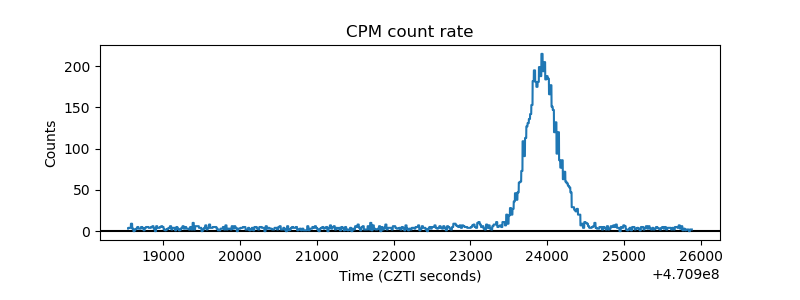 |
| CZT Counter | 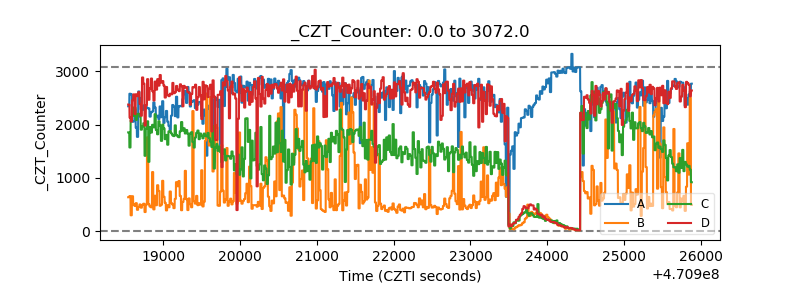 |
| +2.5 Volts monitor | 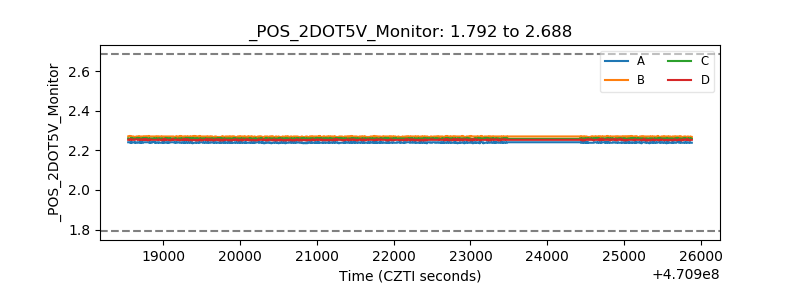 |
| +5 Volts monitor | 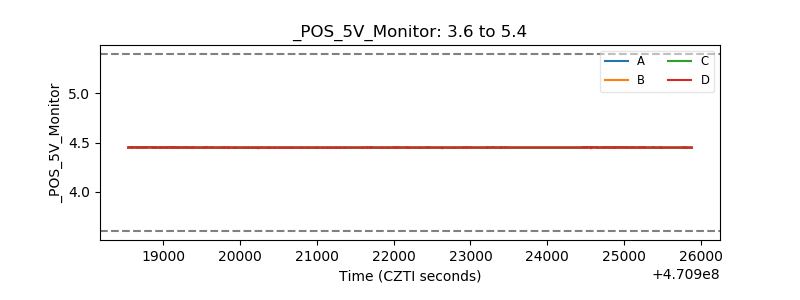 |
| _ROLL_ROT | 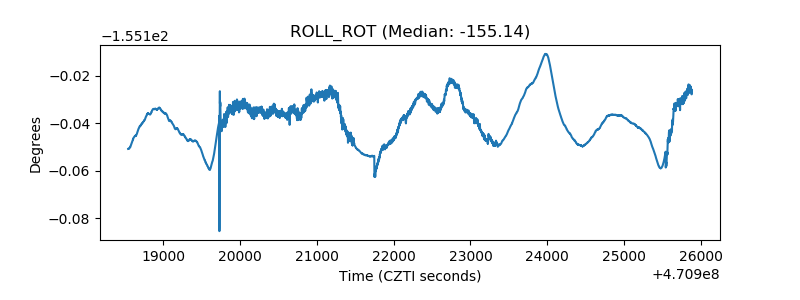 |
| _Roll_DEC | 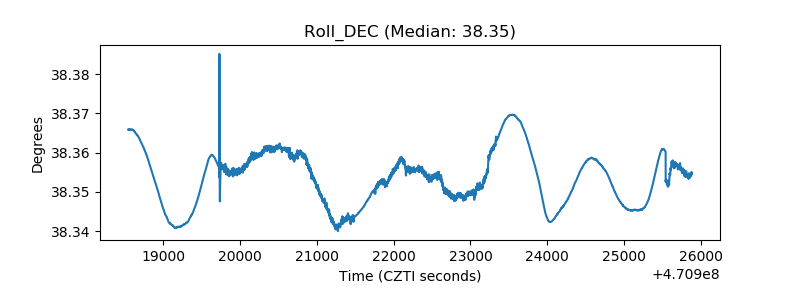 |
| _Roll_RA | 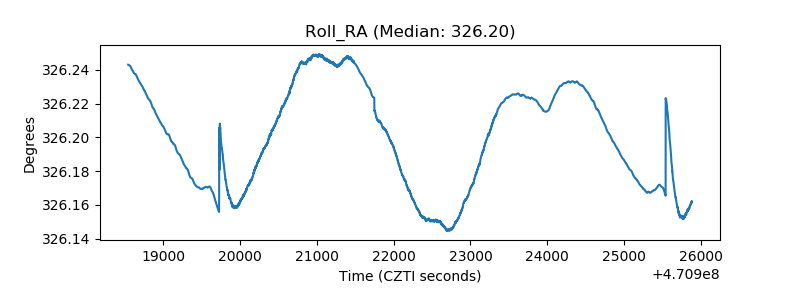 |
| Veto Counter | 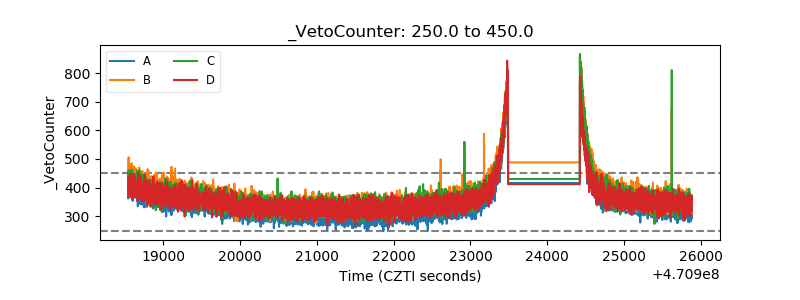 |