| Param | Original file | Final file |
|---|---|---|
| Filename | modeM0/AS1T05_233T01_9000006438_49669cztM0_level2.fits | modeM0/AS1T05_233T01_9000006438_49669cztM0_level2_quad_clean.evt |
| Size (bytes) | 2,520,604,800 | 70,197,120 |
| Size | 2.3 GB | 66.9 MB |
| Events in quadrant A | 32,396,967 | 35,814 |
| Events in quadrant B | 9,829,363 | 1,193,444 |
| Events in quadrant C | 17,345,237 | 12,353 |
| Events in quadrant D | 32,760,660 | 9,992 |
| Mode M9 | |||
|---|---|---|---|
| Quadrant | BADHDUFLAG | Total packets | Discarded packets |
| A | 0 | 9 | 0 |
| B | 0 | 9 | 0 |
| C | 0 | 9 | 0 |
| D | 0 | 9 | 0 |
| Mode SS | |||
|---|---|---|---|
| Quadrant | BADHDUFLAG | Total packets | Discarded packets |
| A | 0 | 258 | 0 |
| B | 0 | 258 | 0 |
| C | 0 | 258 | 0 |
| D | 0 | 258 | 0 |
| Mode M0 | |||
|---|---|---|---|
| Quadrant | BADHDUFLAG | Total packets | Discarded packets |
| A | 0 | 104835 | 11 |
| B | 0 | 37958 | 2 |
| C | 0 | 60356 | 2 |
| D | 0 | 106015 | 2 |
| Quadrant | Total seconds | Saturated seconds | Saturation percentage |
|---|---|---|---|
| A | 12623 | 12371 | 98.003644% |
| B | 12624 | 1218 | 9.648289% |
| C | 12624 | 12547 | 99.390051% |
| D | 12625 | 12545 | 99.366337% |
Noise dominated data is calculated using 1-second bins in cleaned event files. If a bin has >2000 counts, and if more than 50% of those come from <1% of pixels, then it is considered to be noise-dominated and hence unusable.
| Quadrant | # 1 sec bins | Bins with >0 counts | Bins with >2000 counts | High rate bins dominated by noise | Noise dominated (total time) | Noise dominated (detector-on time) | Marked lightcurve |
|---|---|---|---|---|---|---|---|
| A | 13584 | 12626 | 11521 | 11521 | 84.81% | 91.25% | 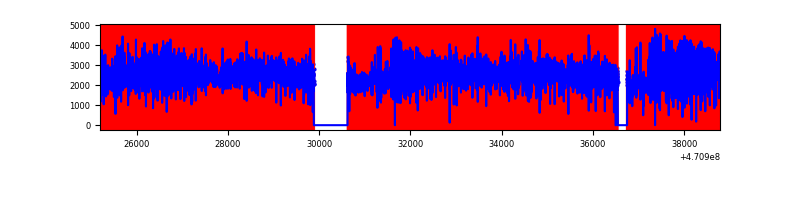 |
| B | 13584 | 12627 | 767 | 767 | 5.65% | 6.07% | 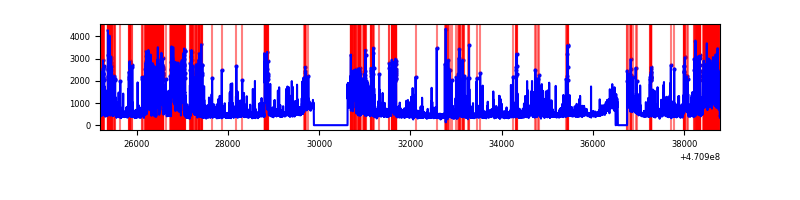 |
| C | 13583 | 12624 | 991 | 991 | 7.30% | 7.85% | 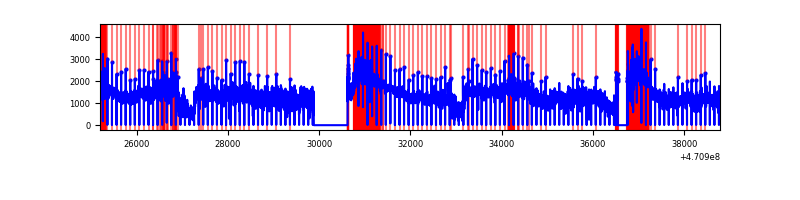 |
| D | 13584 | 12627 | 11132 | 11132 | 81.95% | 88.16% | 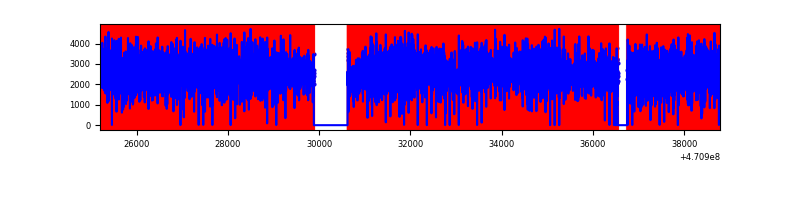 |
Top three noisy pixels from each quadrant. If the there are fewer than three noisy pixels in the level2.evt file, extra rows are filled as -1
| Pixel properties | Quadrant properties | ||||||
|---|---|---|---|---|---|---|---|
| Quadrant | DetID | PixID | Counts | Sigma | Mean | Median | Sigma |
| A | 10 | 83 | 9514690 | 49854.26 | 650 | 629 | 190.8 |
| A | 3 | 130 | 4904918 | 25698.78 | 650 | 629 | 190.8 |
| A | 0 | 98 | 4807703 | 25189.36 | 650 | 629 | 190.8 |
| B | 3 | 232 | 1488599 | 5231.32 | 1341 | 1298 | 284.3 |
| B | 4 | 206 | 792498 | 2782.91 | 1341 | 1298 | 284.3 |
| B | 7 | 0 | 715956 | 2513.69 | 1341 | 1298 | 284.3 |
| C | 15 | 180 | 7420378 | 105090.69 | 123 | 115 | 70.6 |
| C | 15 | 181 | 2021230 | 28624.37 | 123 | 115 | 70.6 |
| C | 15 | 197 | 1343390 | 19024.35 | 123 | 115 | 70.6 |
| D | 15 | 40 | 9125677 | 49605.46 | 422 | 396 | 184.0 |
| D | 12 | 191 | 3868282 | 21026.01 | 422 | 396 | 184.0 |
| D | 15 | 140 | 1963619 | 10672.17 | 422 | 396 | 184.0 |
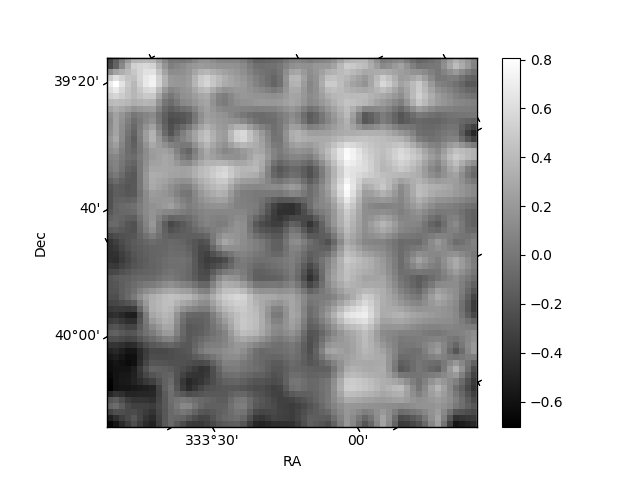
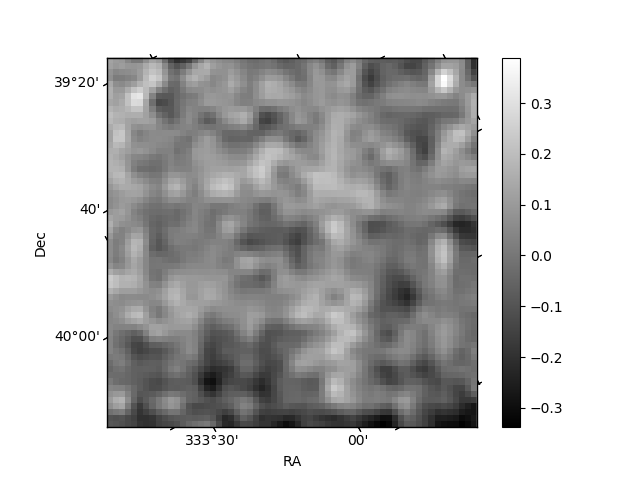
Histogram calculated using DETX and DETY for each event in the final _common_clean file
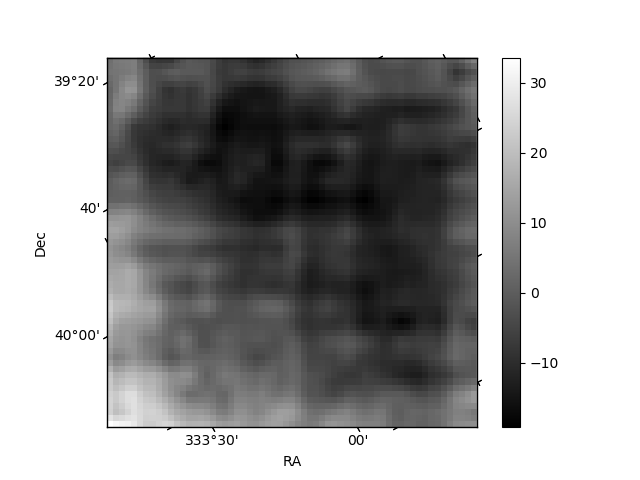
| Quadrant A | 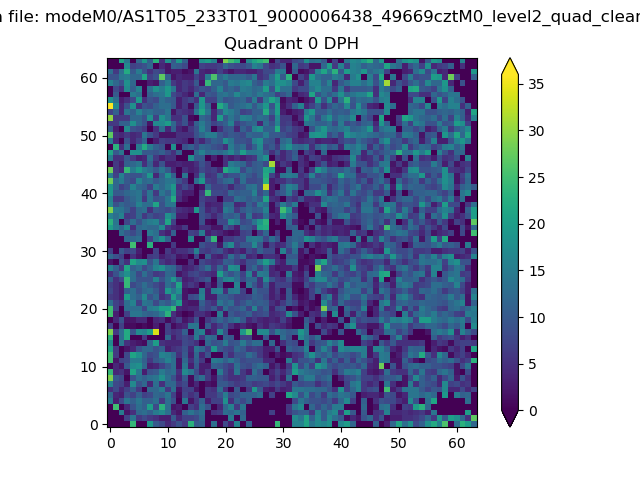 |
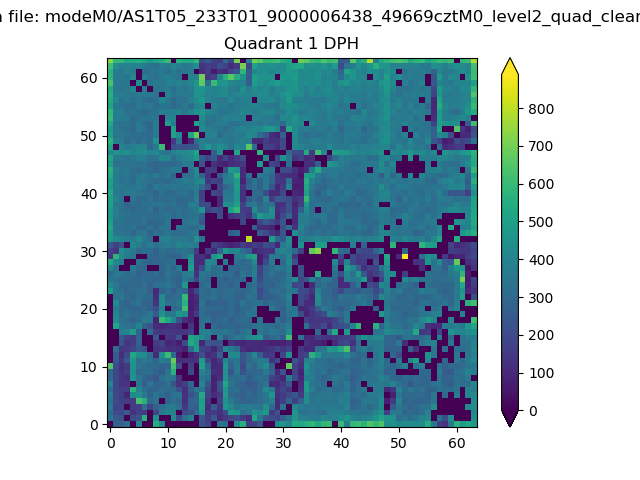 |
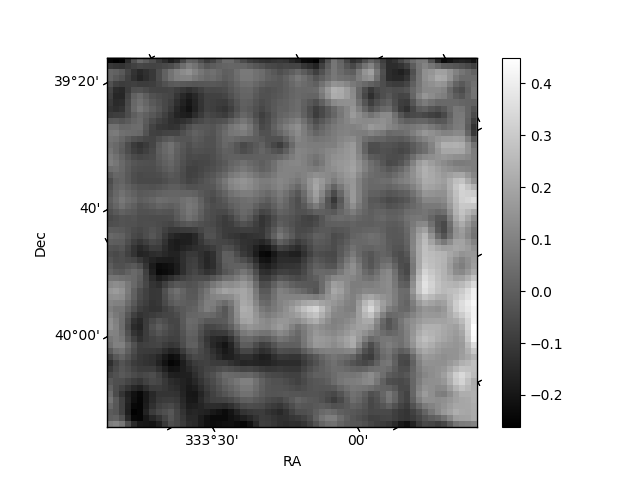
Quadrant B |
|---|---|---|---|
| Quadrant D | 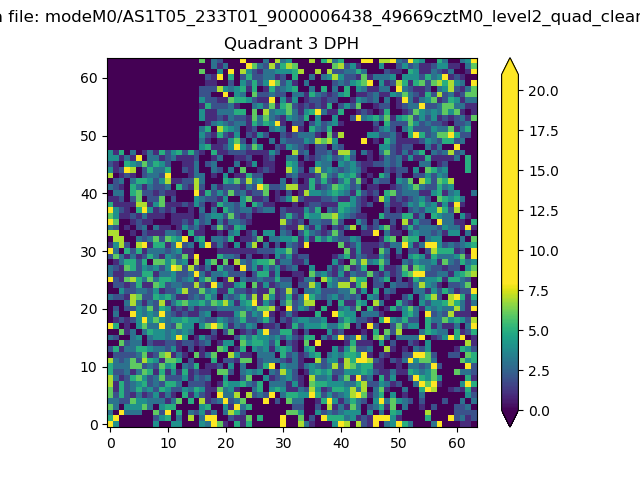 |
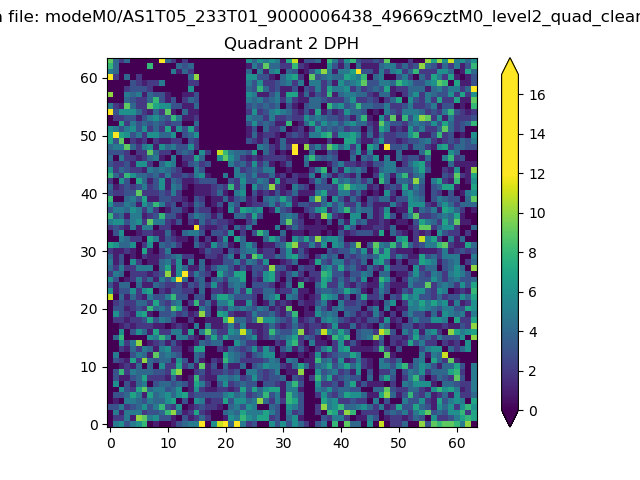 |
Quadrant C |
| Plot type | Count rate plots | Images |
|---|---|---|
| Comparison with Poisson distribution Blue bars denote a histogram of data divided into 1 sec bins. Red curve is a Poisson curve with rate = median count rate of data. |
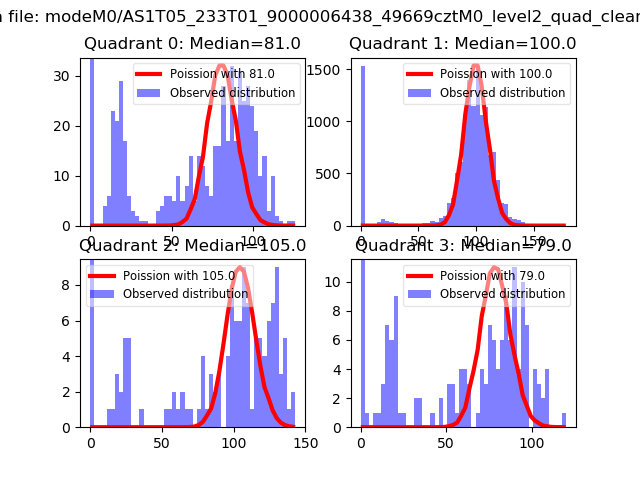 |
 |
| Quadrant-wise count rates Data is divided into 100 sec bins |
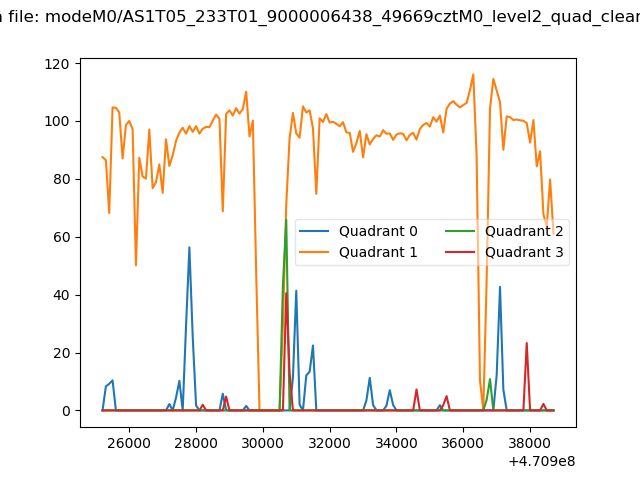 |
|
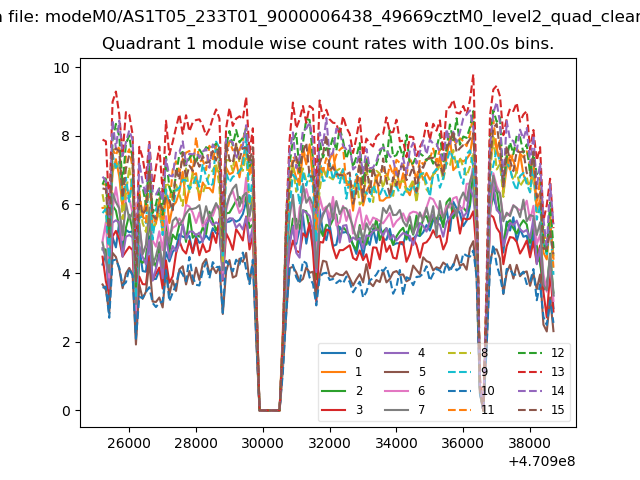
| Module-wise count rates for Quadrant A Data is divided into 100 sec bins |
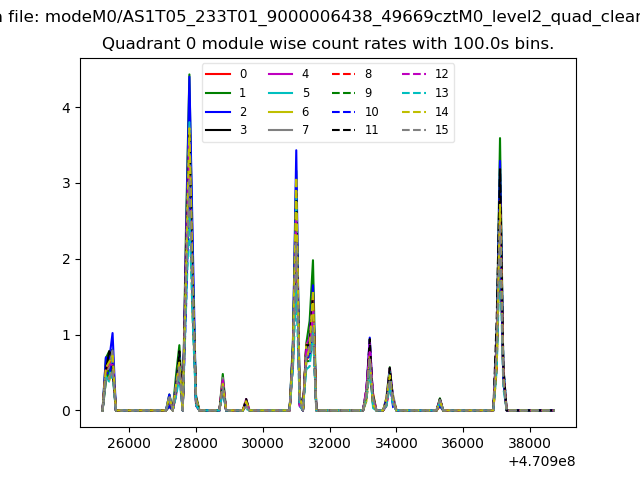 |
 |
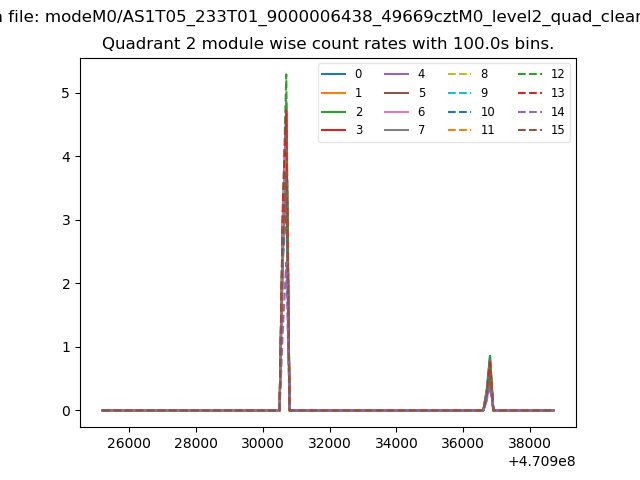
| Module-wise count rates for Quadrant B Data is divided into 100 sec bins |
 |
 |
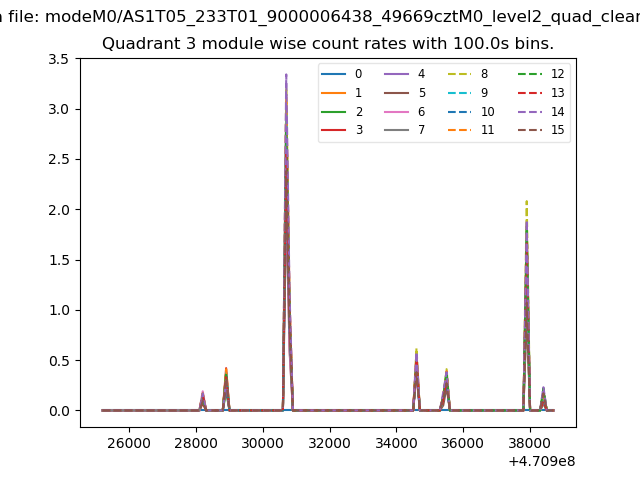
| Module-wise count rates for Quadrant C Data is divided into 100 sec bins |
 |
 |
| Module-wise count rates for Quadrant D Data is divided into 100 sec bins |
 |
 |
| Parameter | Plot |
|---|---|
| CZT HV Monitor | 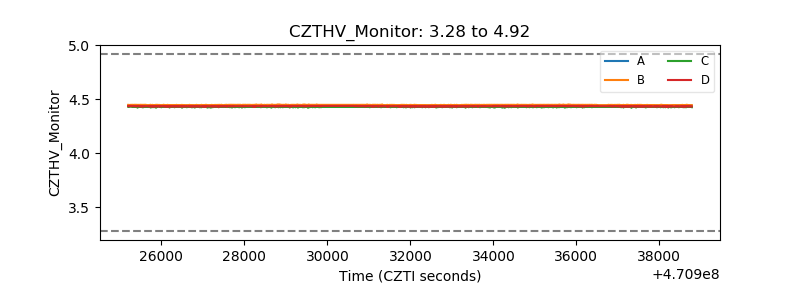 |
| D_VDD |  |
| Temperature 1 | 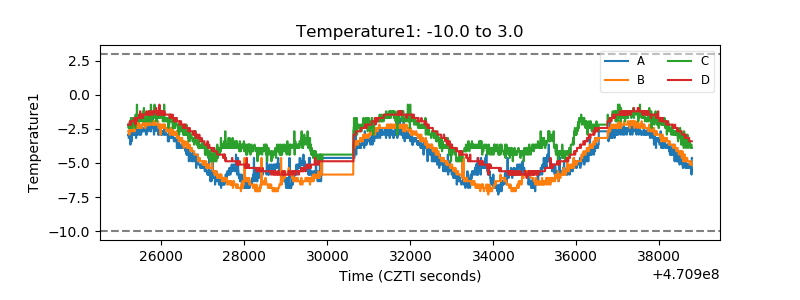 |
| Veto HV Monitor | 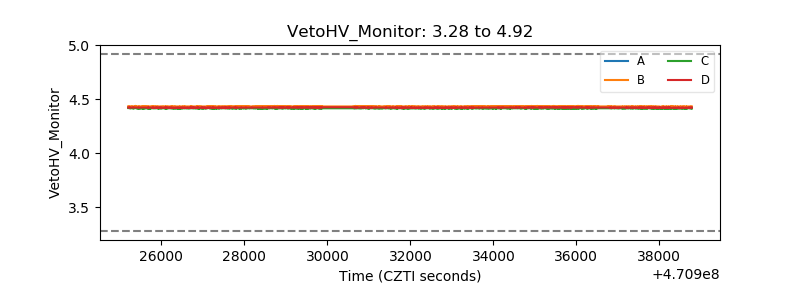 |
| Veto LLD | 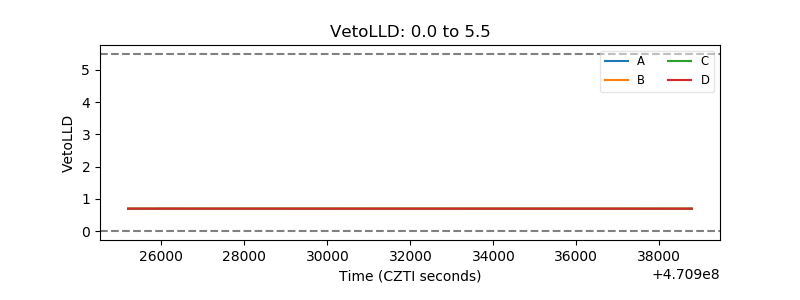 |
| Alpha Counter | 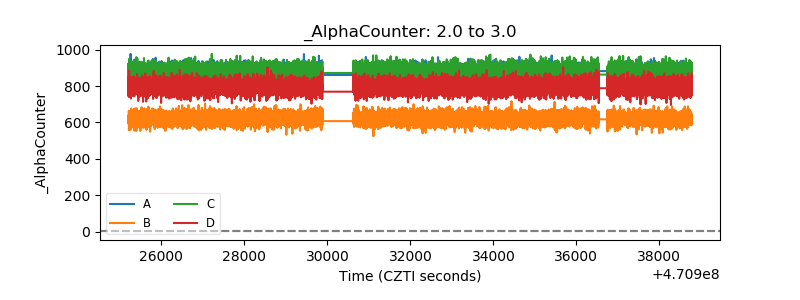 |
| _CPM_Rate | 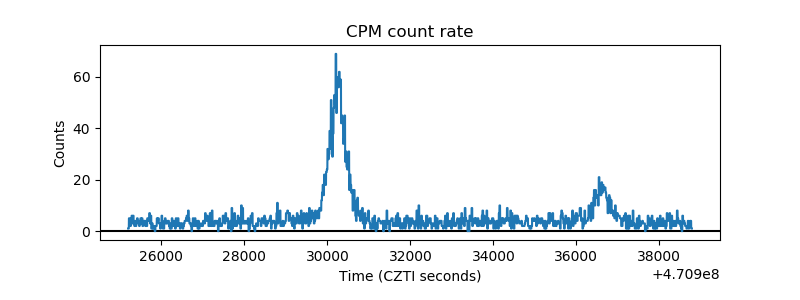 |
| CZT Counter | 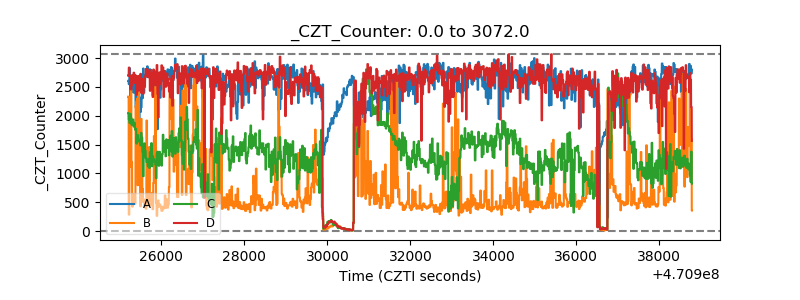 |
| +2.5 Volts monitor | 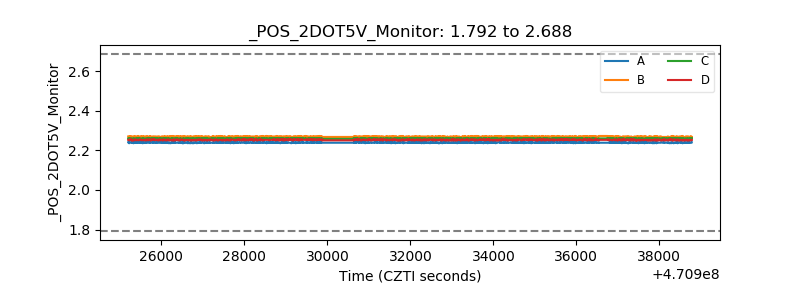 |
| +5 Volts monitor | 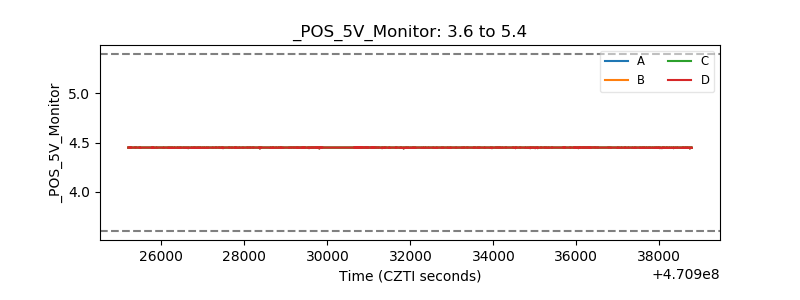 |
| _ROLL_ROT | 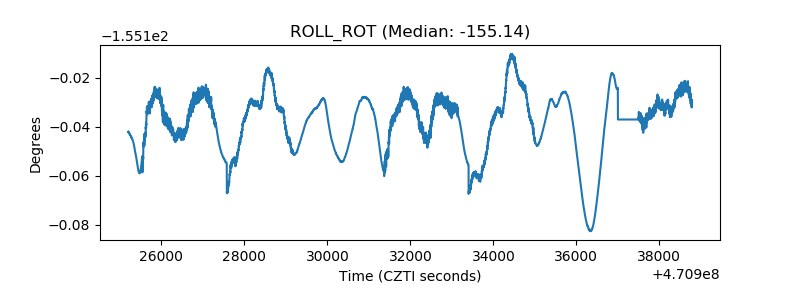 |
| _Roll_DEC | 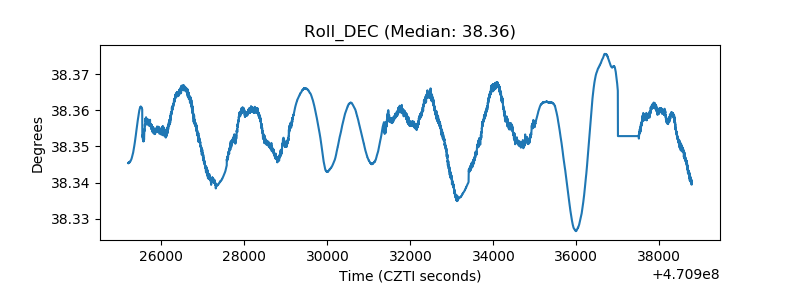 |
| _Roll_RA | 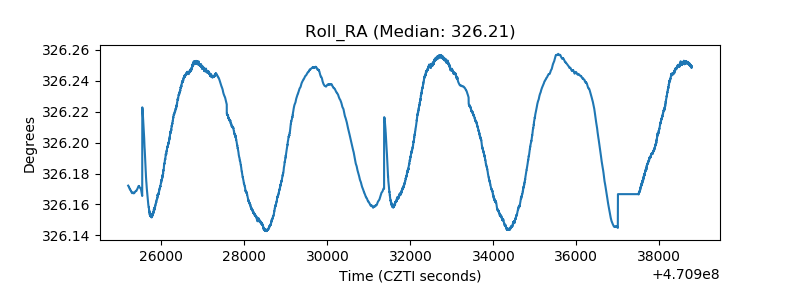 |
| Veto Counter | 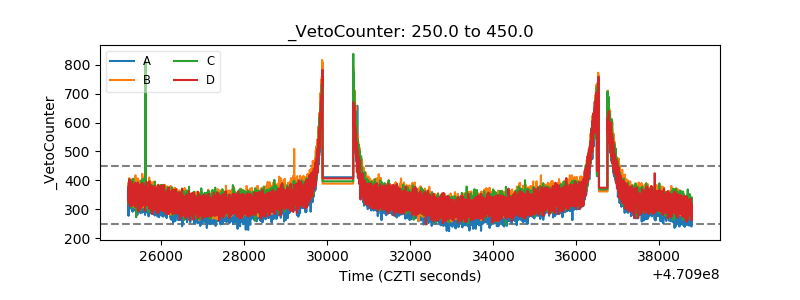 |