| Param | Original file | Final file |
|---|---|---|
| Filename | modeM0/AS1T05_233T01_9000006438_49670cztM0_level2.fits | modeM0/AS1T05_233T01_9000006438_49670cztM0_level2_quad_clean.evt |
| Size (bytes) | 1,429,724,160 | 50,797,440 |
| Size | 1.3 GB | 48.4 MB |
| Events in quadrant A | 19,387,818 | 215,973 |
| Events in quadrant B | 7,223,689 | 686,194 |
| Events in quadrant C | 7,585,548 | 3,113 |
| Events in quadrant D | 18,156,593 | 108,920 |
| Mode SS | |||
|---|---|---|---|
| Quadrant | BADHDUFLAG | Total packets | Discarded packets |
| A | 0 | 148 | 0 |
| B | 0 | 148 | 0 |
| C | 0 | 148 | 0 |
| D | 0 | 146 | 0 |
| Mode M0 | |||
|---|---|---|---|
| Quadrant | BADHDUFLAG | Total packets | Discarded packets |
| A | 0 | 62709 | 0 |
| B | 0 | 26524 | 0 |
| C | 0 | 27730 | 0 |
| D | 0 | 58972 | 0 |
| Quadrant | Total seconds | Saturated seconds | Saturation percentage |
|---|---|---|---|
| A | 7363 | 7329 | 99.538232% |
| B | 7364 | 1417 | 19.242260% |
| C | 7364 | 7364 | 100.000000% |
| D | 7363 | 7342 | 99.714790% |
Noise dominated data is calculated using 1-second bins in cleaned event files. If a bin has >2000 counts, and if more than 50% of those come from <1% of pixels, then it is considered to be noise-dominated and hence unusable.
| Quadrant | # 1 sec bins | Bins with >0 counts | Bins with >2000 counts | High rate bins dominated by noise | Noise dominated (total time) | Noise dominated (detector-on time) | Marked lightcurve |
|---|---|---|---|---|---|---|---|
| A | 7363 | 7363 | 6901 | 6901 | 93.73% | 93.73% | 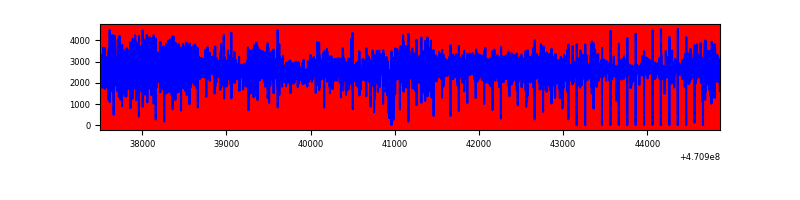 |
| B | 7364 | 7364 | 1079 | 1079 | 14.65% | 14.65% | 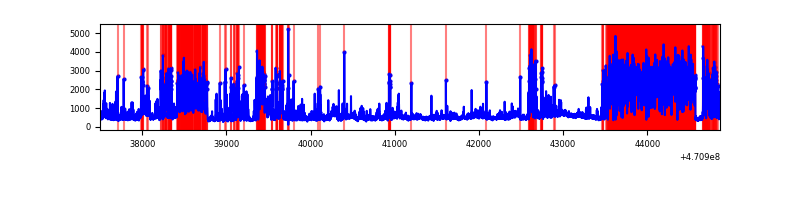 |
| C | 7364 | 7364 | 46 | 46 | 0.62% | 0.62% | 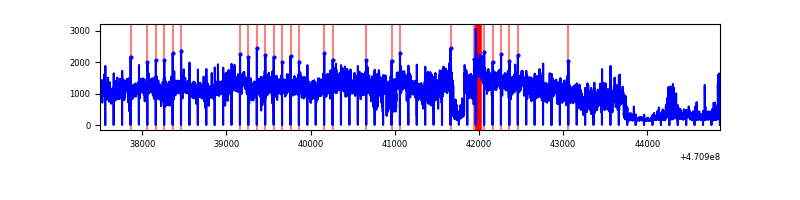 |
| D | 7362 | 7362 | 6303 | 6303 | 85.62% | 85.62% | 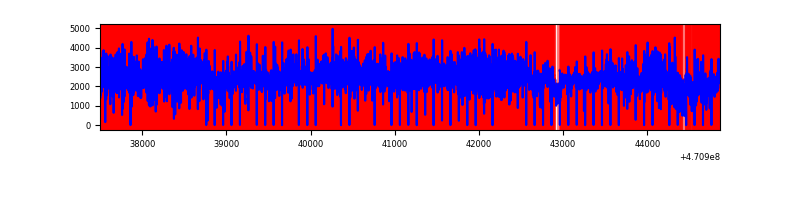 |
Top three noisy pixels from each quadrant. If the there are fewer than three noisy pixels in the level2.evt file, extra rows are filled as -1
| Pixel properties | Quadrant properties | ||||||
|---|---|---|---|---|---|---|---|
| Quadrant | DetID | PixID | Counts | Sigma | Mean | Median | Sigma |
| A | 0 | 98 | 5499331 | 67458.96 | 260 | 250 | 81.5 |
| A | 10 | 83 | 3933444 | 48249.73 | 260 | 250 | 81.5 |
| A | 3 | 130 | 1906051 | 23379.06 | 260 | 250 | 81.5 |
| B | 3 | 232 | 2397424 | 15497.44 | 720 | 698 | 154.7 |
| B | 10 | 44 | 588208 | 3798.89 | 720 | 698 | 154.7 |
| B | 4 | 206 | 475486 | 3070.02 | 720 | 698 | 154.7 |
| C | 15 | 180 | 2061082 | 101788.82 | 23 | 20 | 20.2 |
| C | 15 | 181 | 1332814 | 65822.15 | 23 | 20 | 20.2 |
| C | 15 | 163 | 891343 | 44019.4 | 23 | 20 | 20.2 |
| D | 15 | 40 | 4245853 | 41797.77 | 159 | 144 | 101.6 |
| D | 12 | 191 | 2458108 | 24197.94 | 159 | 144 | 101.6 |
| D | 7 | 60 | 2019226 | 19877.28 | 159 | 144 | 101.6 |
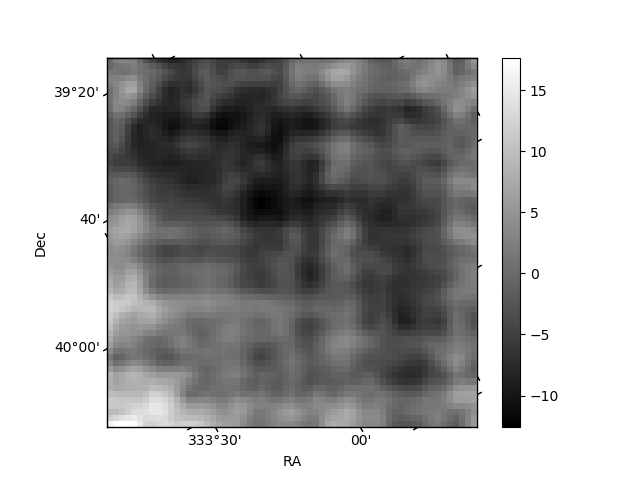
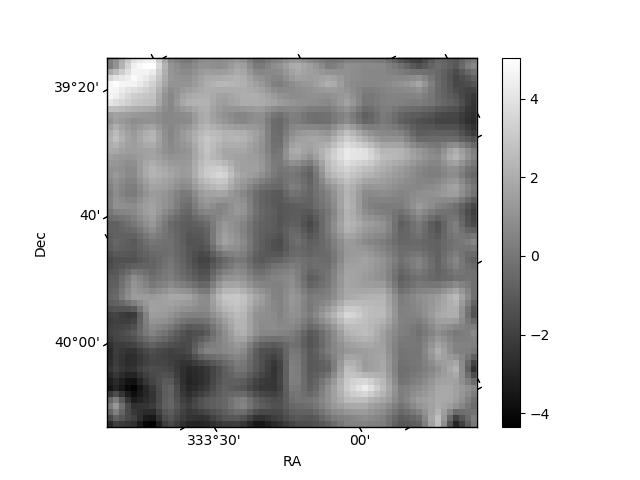
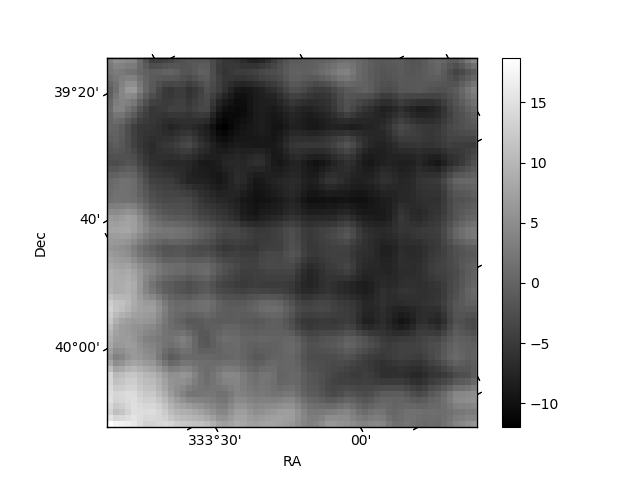
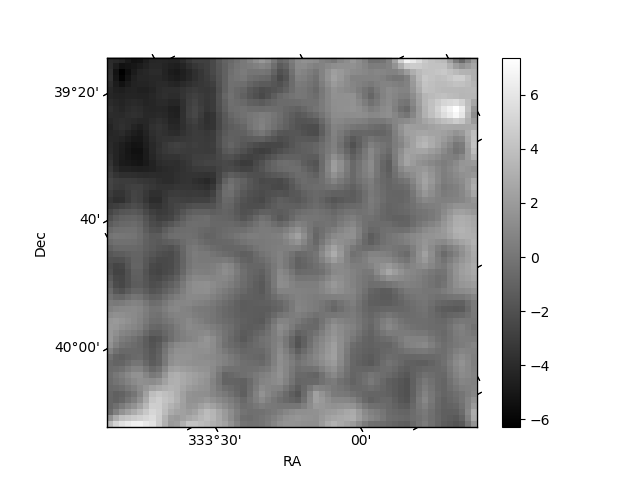
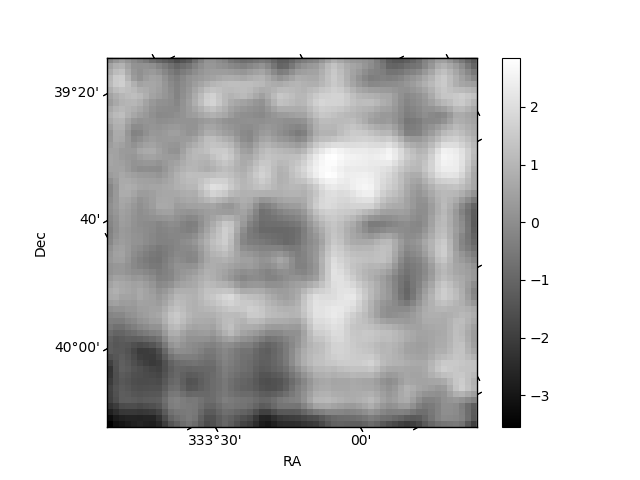
Histogram calculated using DETX and DETY for each event in the final _common_clean file
| Quadrant A | 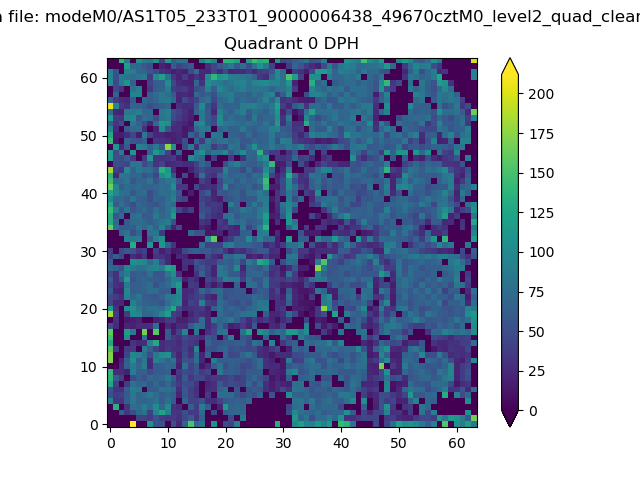 |
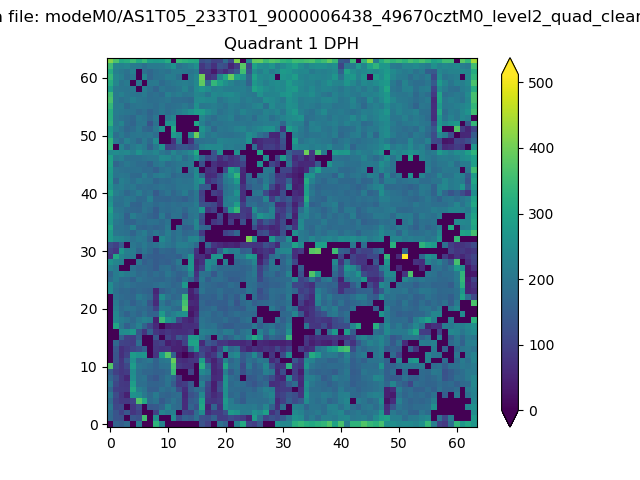 |
Quadrant B |
|---|---|---|---|
| Quadrant D | 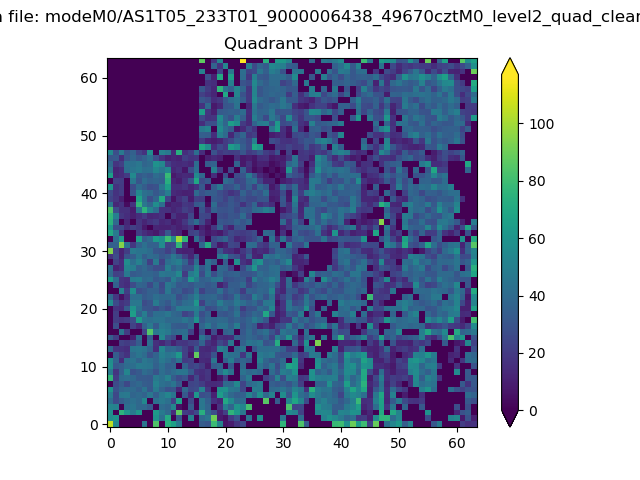 |
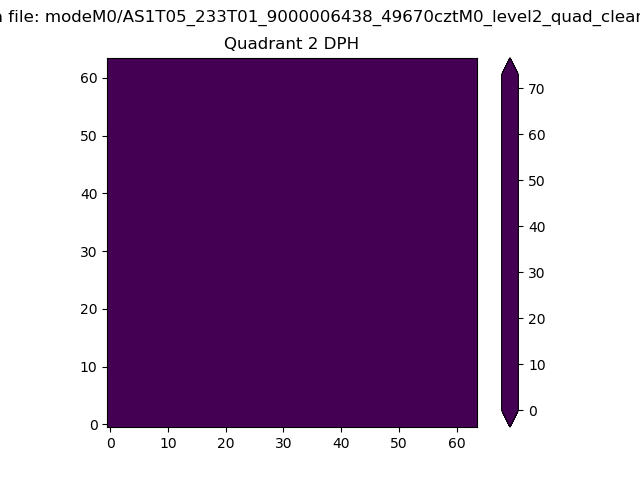 |
Quadrant C |
| Plot type | Count rate plots | Images |
|---|---|---|
| Comparison with Poisson distribution Blue bars denote a histogram of data divided into 1 sec bins. Red curve is a Poisson curve with rate = median count rate of data. |
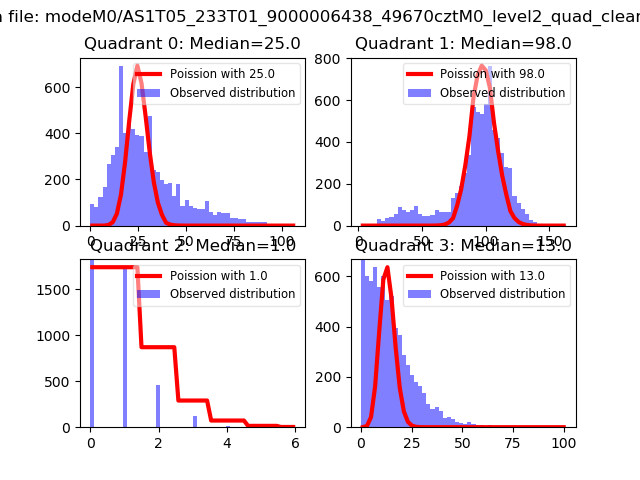 |
 |
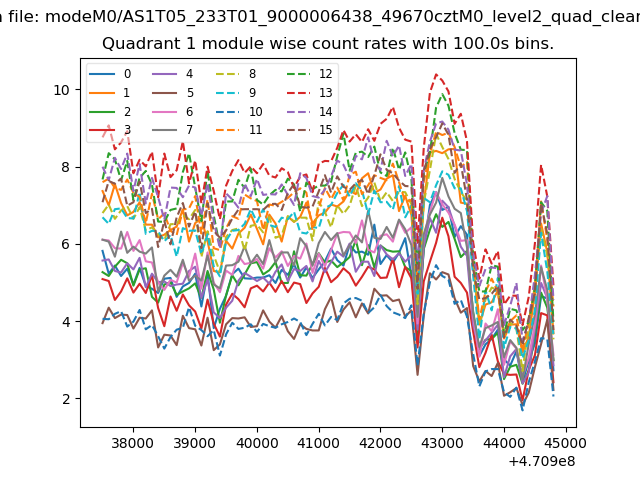
| Quadrant-wise count rates Data is divided into 100 sec bins |
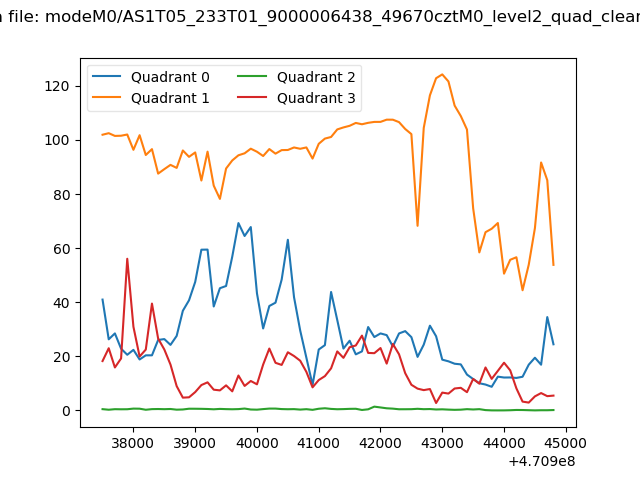 |
|
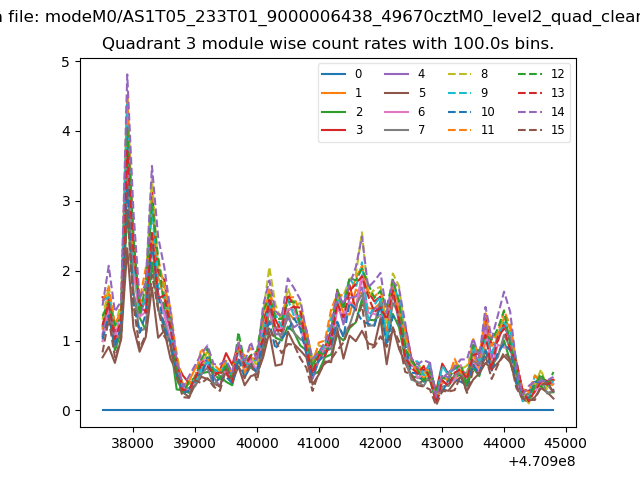
| Module-wise count rates for Quadrant A Data is divided into 100 sec bins |
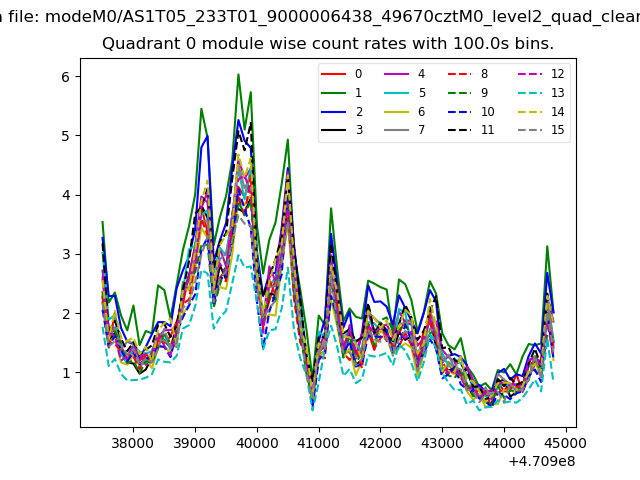 |
 |
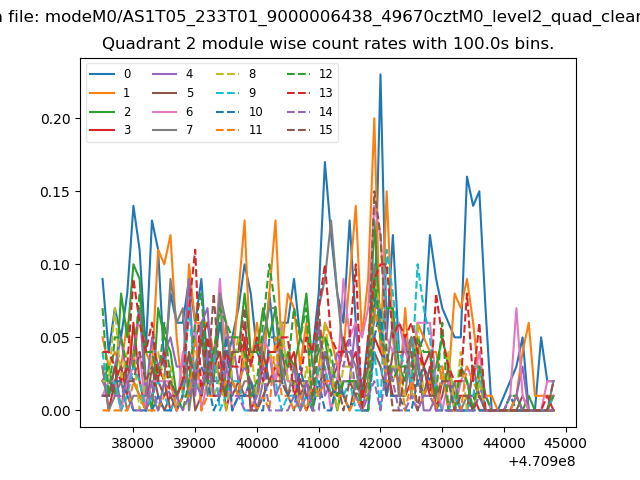
| Module-wise count rates for Quadrant B Data is divided into 100 sec bins |
 |
 |
| Module-wise count rates for Quadrant C Data is divided into 100 sec bins |
 |
 |
| Module-wise count rates for Quadrant D Data is divided into 100 sec bins |
 |
 |
| Parameter | Plot |
|---|---|
| CZT HV Monitor | 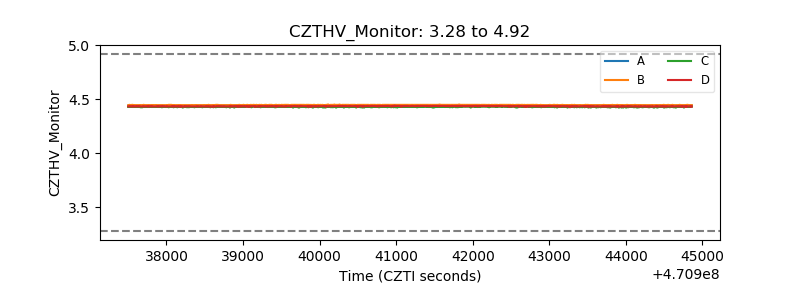 |
| D_VDD | 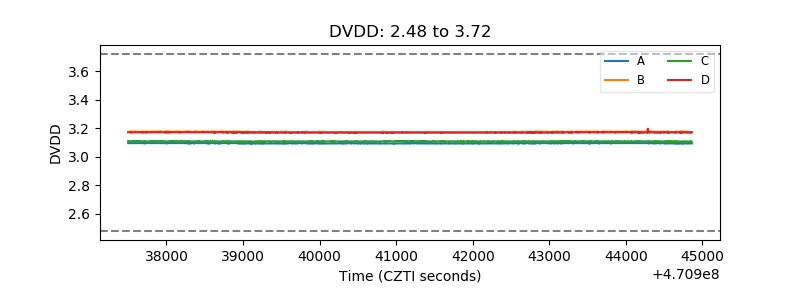 |
| Temperature 1 | 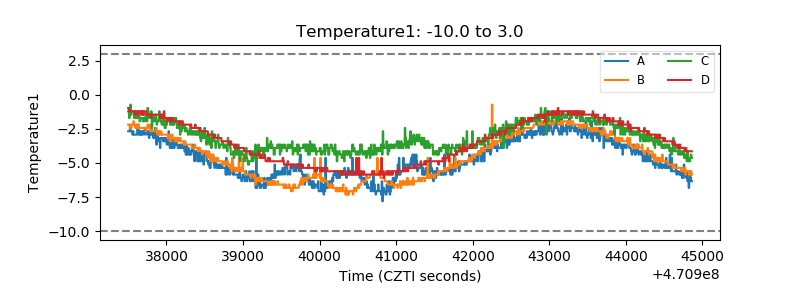 |
| Veto HV Monitor | 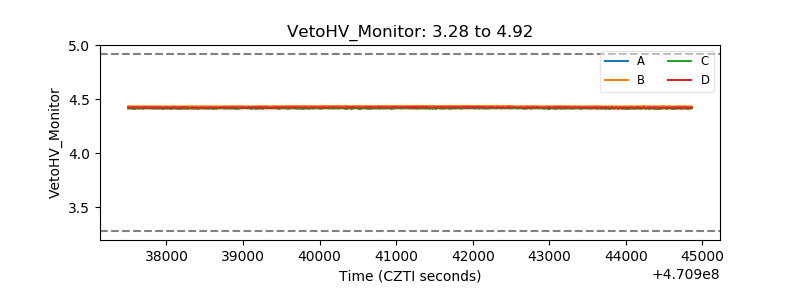 |
| Veto LLD | 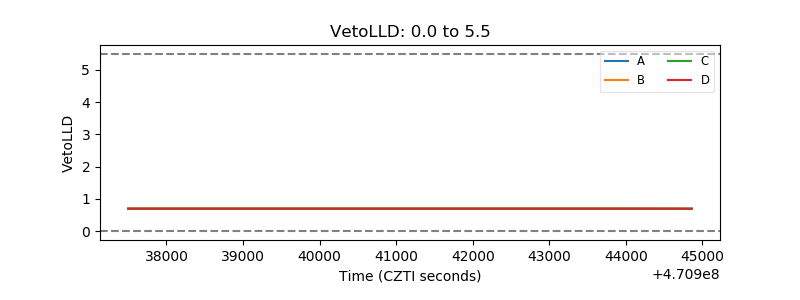 |
| Alpha Counter | 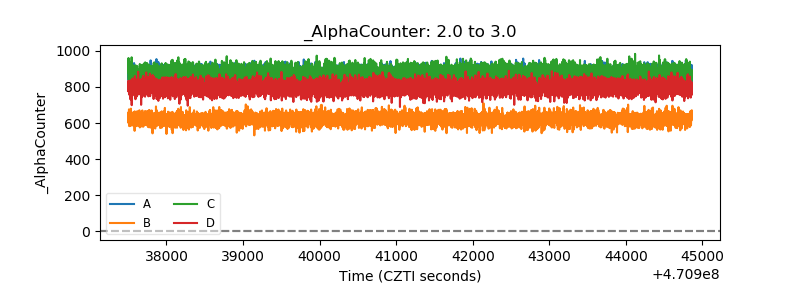 |
| _CPM_Rate | 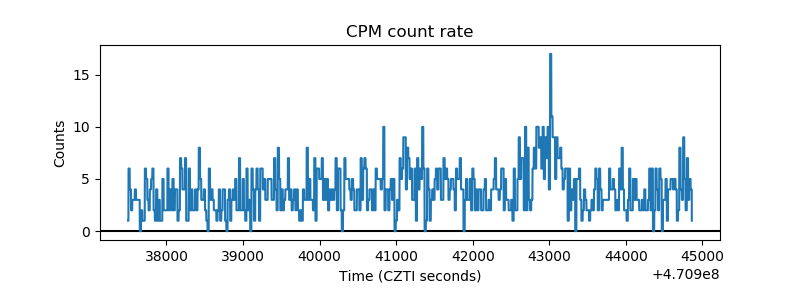 |
| CZT Counter | 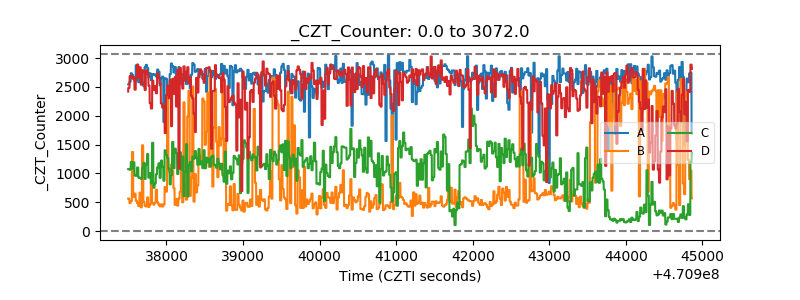 |
| +2.5 Volts monitor | 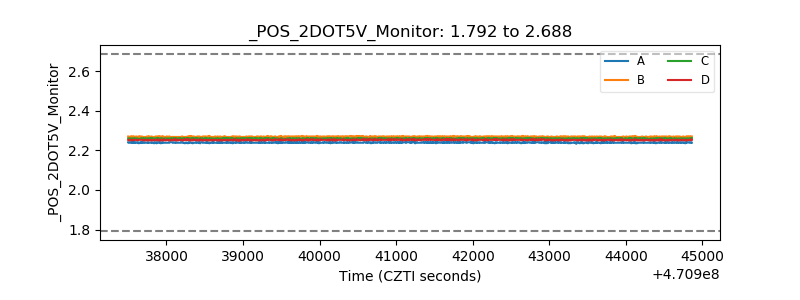 |
| +5 Volts monitor | 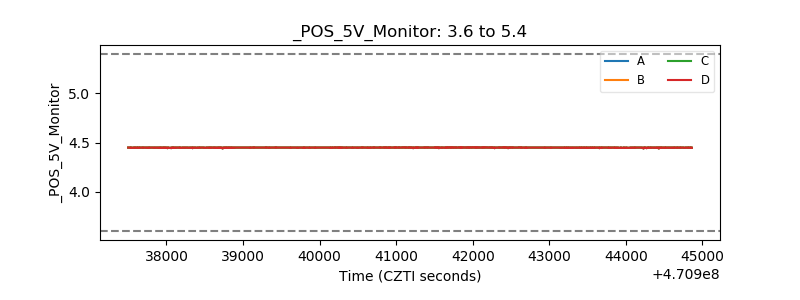 |
| _ROLL_ROT | 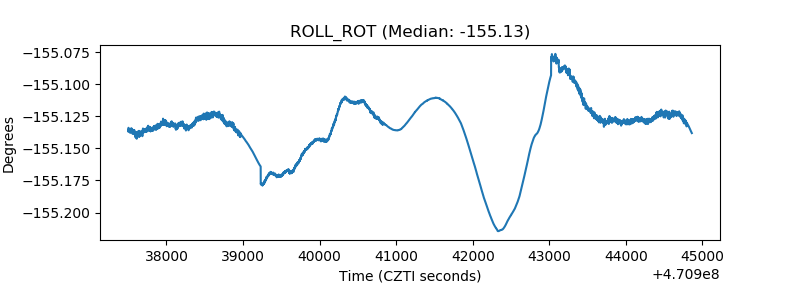 |
| _Roll_DEC | 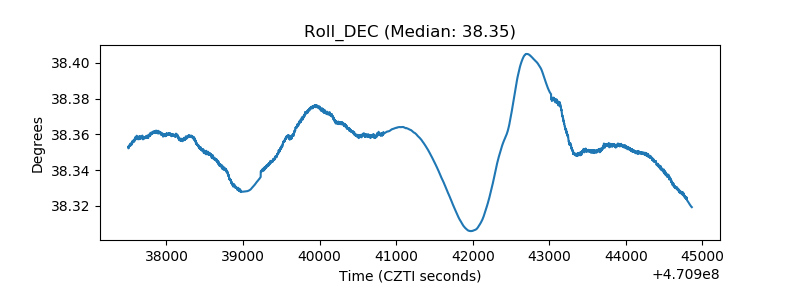 |
| _Roll_RA | 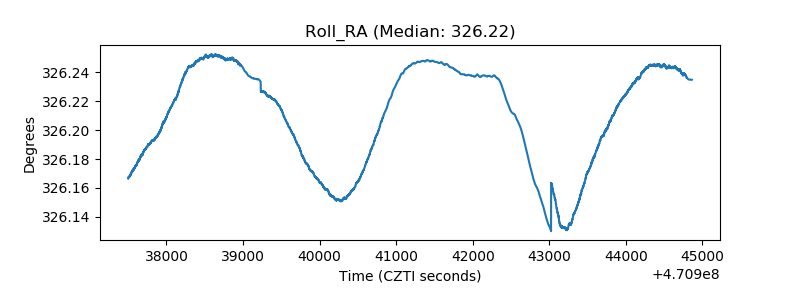 |
| Veto Counter | 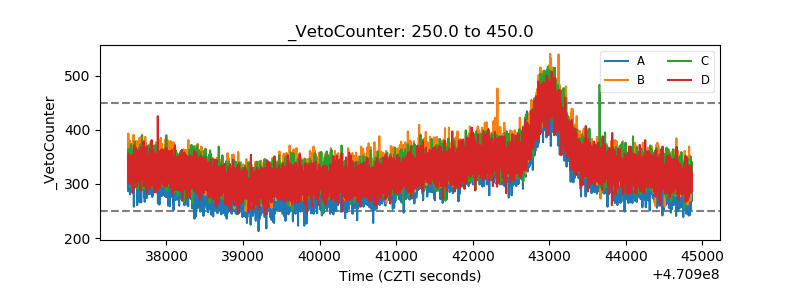 |