| Param | Original file | Final file |
|---|---|---|
| Filename | modeM0/AS1T05_233T01_9000006438_49671cztM0_level2.fits | modeM0/AS1T05_233T01_9000006438_49671cztM0_level2_quad_clean.evt |
| Size (bytes) | 1,353,058,560 | 45,904,320 |
| Size | 1.3 GB | 43.8 MB |
| Events in quadrant A | 19,000,459 | 149,871 |
| Events in quadrant B | 7,736,340 | 632,006 |
| Events in quadrant C | 5,882,010 | 5,909 |
| Events in quadrant D | 16,906,052 | 87,500 |
| Mode SS | |||
|---|---|---|---|
| Quadrant | BADHDUFLAG | Total packets | Discarded packets |
| A | 0 | 144 | 0 |
| B | 0 | 144 | 0 |
| C | 0 | 144 | 0 |
| D | 0 | 144 | 0 |
| Mode M0 | |||
|---|---|---|---|
| Quadrant | BADHDUFLAG | Total packets | Discarded packets |
| A | 0 | 61462 | 0 |
| B | 0 | 27796 | 0 |
| C | 0 | 22622 | 0 |
| D | 0 | 55119 | 0 |
| Quadrant | Total seconds | Saturated seconds | Saturation percentage |
|---|---|---|---|
| A | 7229 | 7229 | 100.000000% |
| B | 7229 | 1910 | 26.421358% |
| C | 7229 | 7229 | 100.000000% |
| D | 7230 | 7228 | 99.972337% |
Noise dominated data is calculated using 1-second bins in cleaned event files. If a bin has >2000 counts, and if more than 50% of those come from <1% of pixels, then it is considered to be noise-dominated and hence unusable.
| Quadrant | # 1 sec bins | Bins with >0 counts | Bins with >2000 counts | High rate bins dominated by noise | Noise dominated (total time) | Noise dominated (detector-on time) | Marked lightcurve |
|---|---|---|---|---|---|---|---|
| A | 7228 | 7228 | 6895 | 6895 | 95.39% | 95.39% | 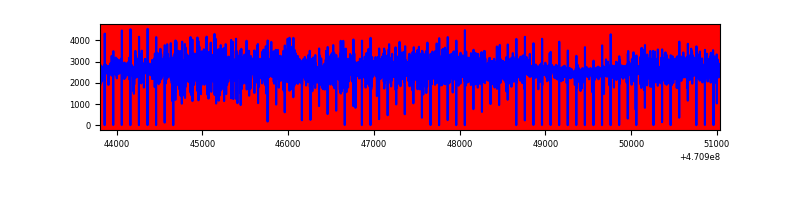 |
| B | 7229 | 7229 | 1371 | 1371 | 18.97% | 18.97% | 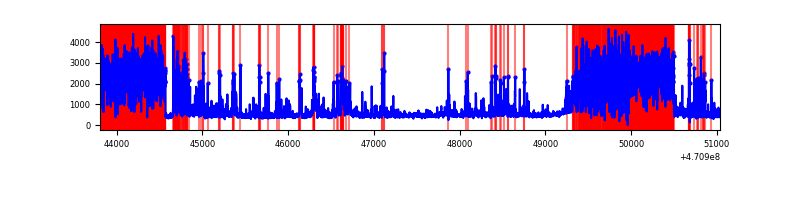 |
| C | 7228 | 7228 | 10 | 10 | 0.14% | 0.14% | 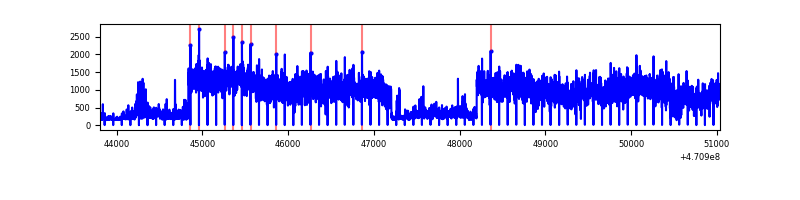 |
| D | 7229 | 7228 | 5825 | 5825 | 80.58% | 80.59% |  |
Top three noisy pixels from each quadrant. If the there are fewer than three noisy pixels in the level2.evt file, extra rows are filled as -1
| Pixel properties | Quadrant properties | ||||||
|---|---|---|---|---|---|---|---|
| Quadrant | DetID | PixID | Counts | Sigma | Mean | Median | Sigma |
| A | 0 | 98 | 3922494 | 57697.22 | 187 | 179 | 68.0 |
| A | 0 | 99 | 3917753 | 57627.48 | 187 | 179 | 68.0 |
| A | 10 | 83 | 3050821 | 44874.92 | 187 | 179 | 68.0 |
| B | 3 | 232 | 3433137 | 24158.67 | 667 | 646 | 142.1 |
| B | 4 | 206 | 382935 | 2690.64 | 667 | 646 | 142.1 |
| B | 10 | 44 | 330614 | 2322.39 | 667 | 646 | 142.1 |
| C | 15 | 180 | 1186795 | 112035.2 | 13 | 12 | 10.6 |
| C | 15 | 181 | 1112499 | 105021.48 | 13 | 12 | 10.6 |
| C | 15 | 197 | 596414 | 56301.8 | 13 | 12 | 10.6 |
| D | 15 | 40 | 2848865 | 29928.9 | 131 | 118 | 95.2 |
| D | 7 | 60 | 2841634 | 29852.93 | 131 | 118 | 95.2 |
| D | 12 | 191 | 1642428 | 17254.09 | 131 | 118 | 95.2 |
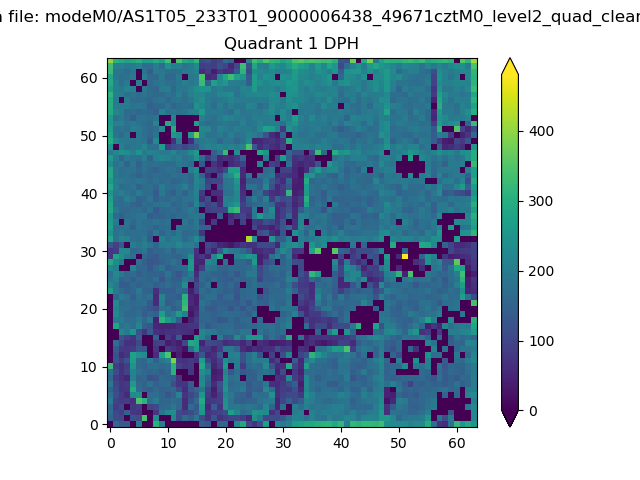
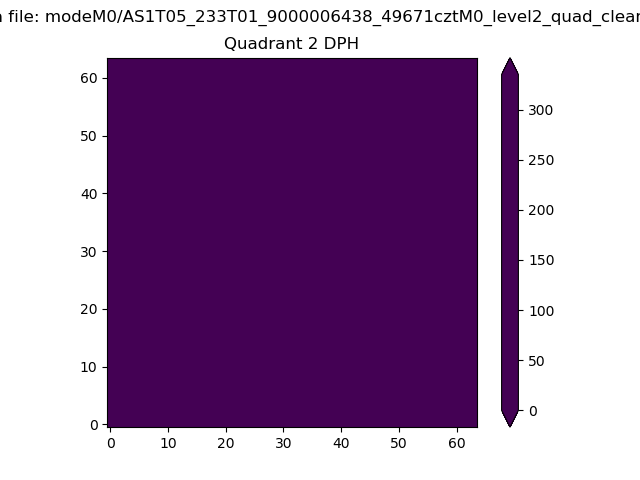
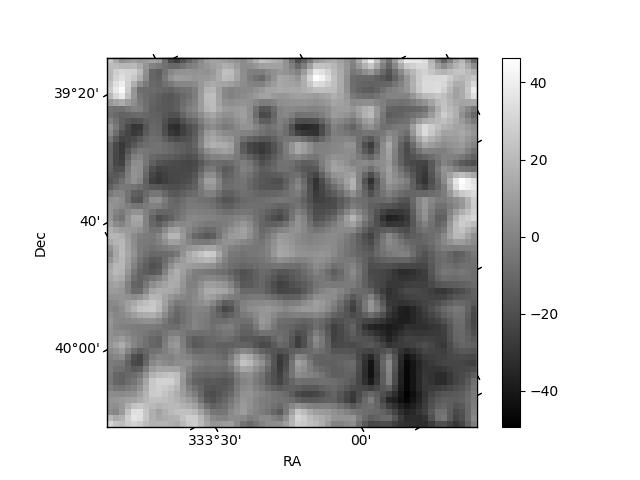
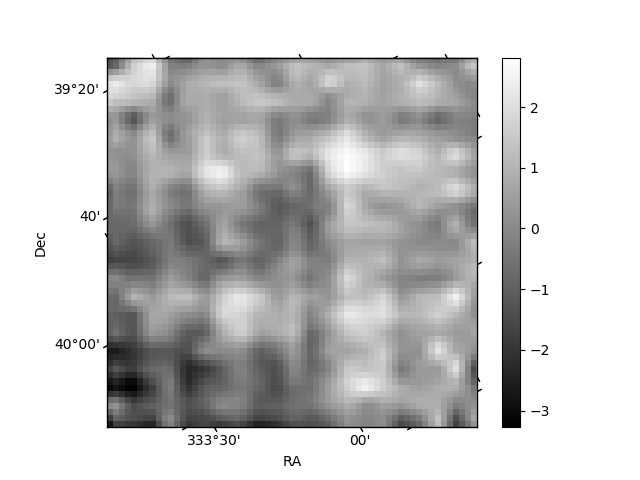
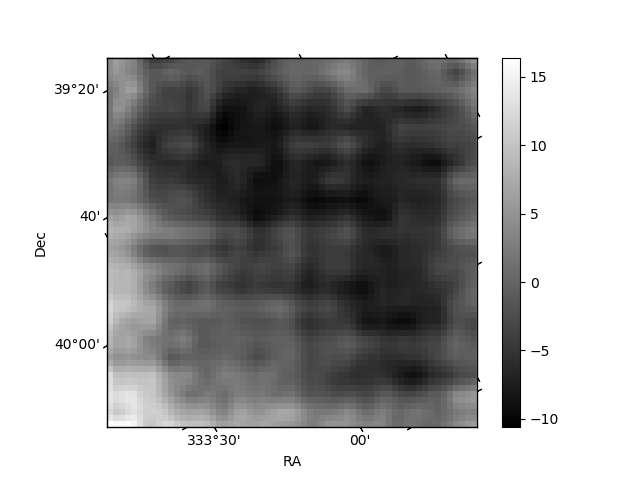
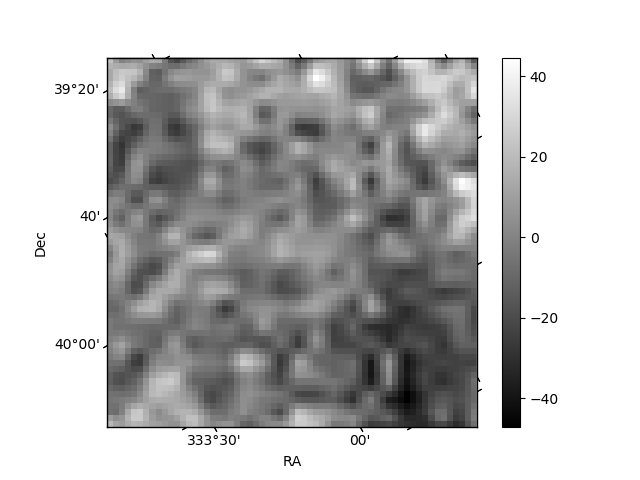
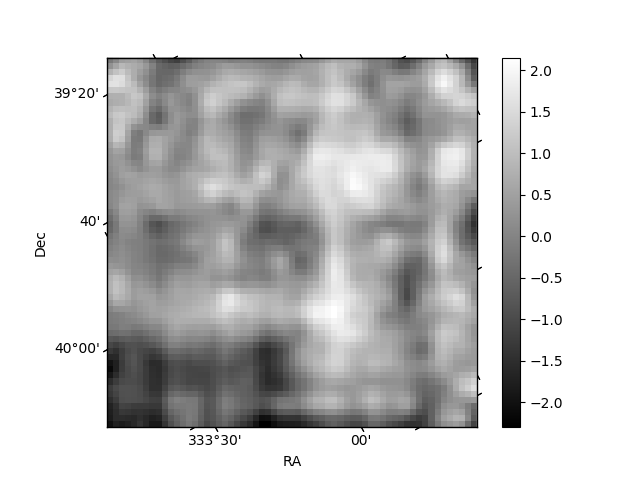
Histogram calculated using DETX and DETY for each event in the final _common_clean file
| Quadrant A | 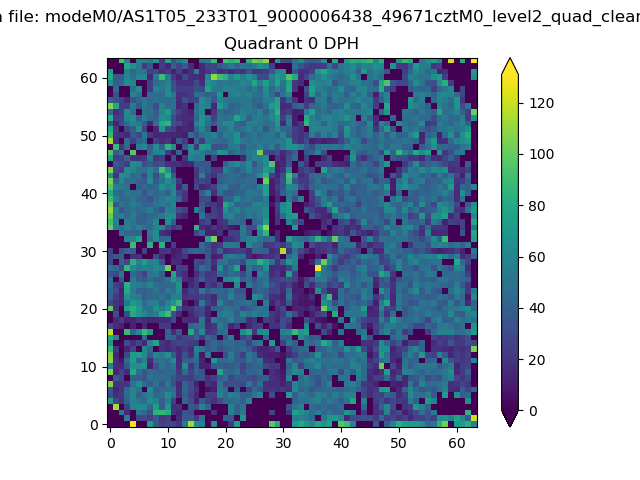 |
 |
Quadrant B |
|---|---|---|---|
| Quadrant D | 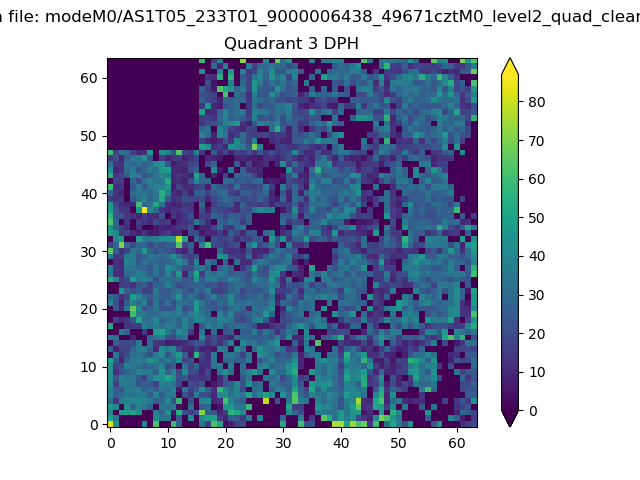 |
 |
Quadrant C |
| Plot type | Count rate plots | Images |
|---|---|---|
| Comparison with Poisson distribution Blue bars denote a histogram of data divided into 1 sec bins. Red curve is a Poisson curve with rate = median count rate of data. |
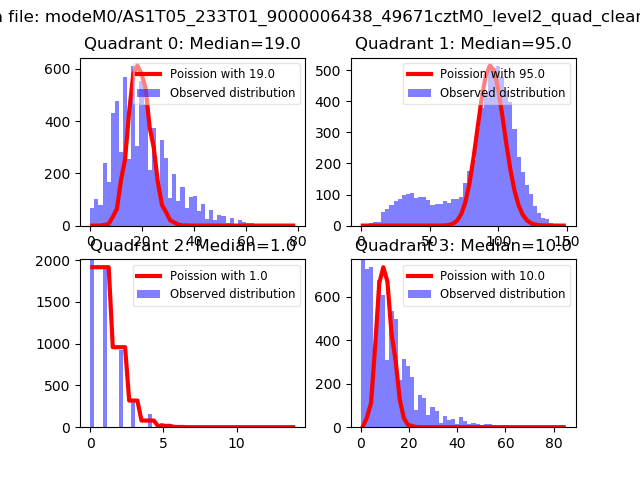 |
 |
| Quadrant-wise count rates Data is divided into 100 sec bins |
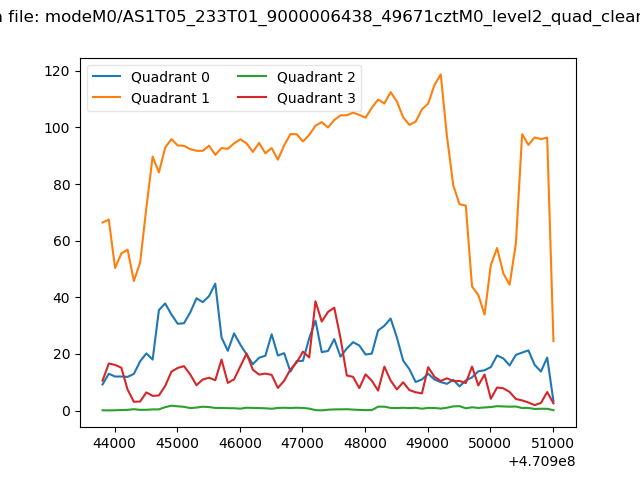 |
|
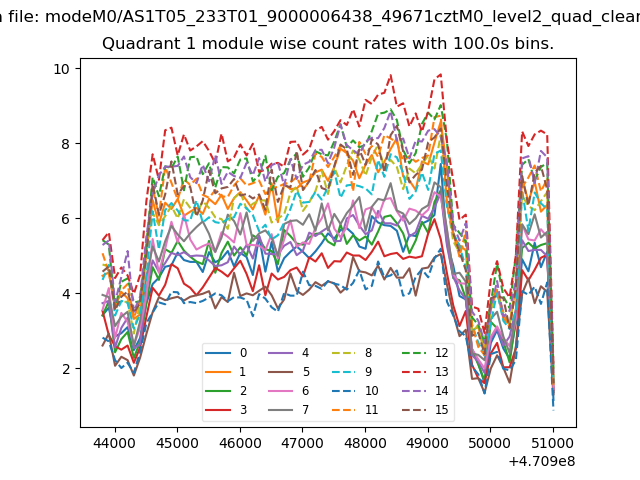
| Module-wise count rates for Quadrant A Data is divided into 100 sec bins |
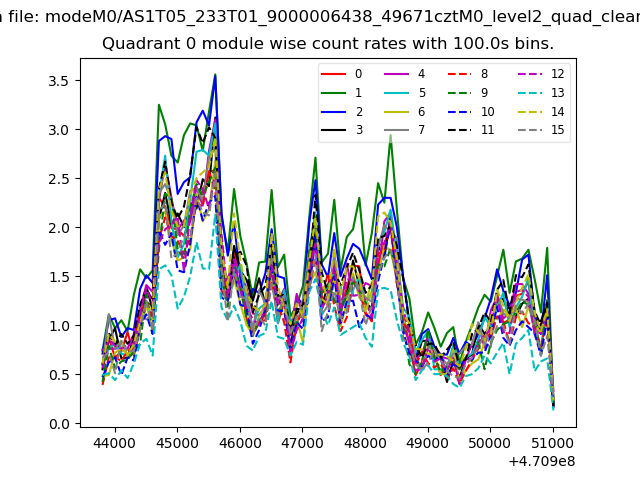 |
 |
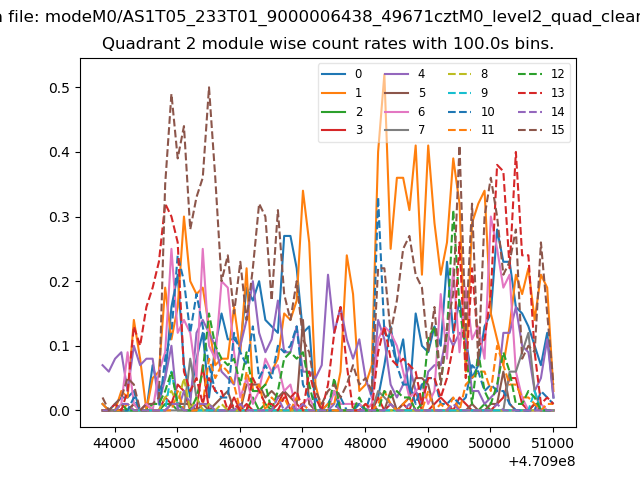
| Module-wise count rates for Quadrant B Data is divided into 100 sec bins |
 |
 |
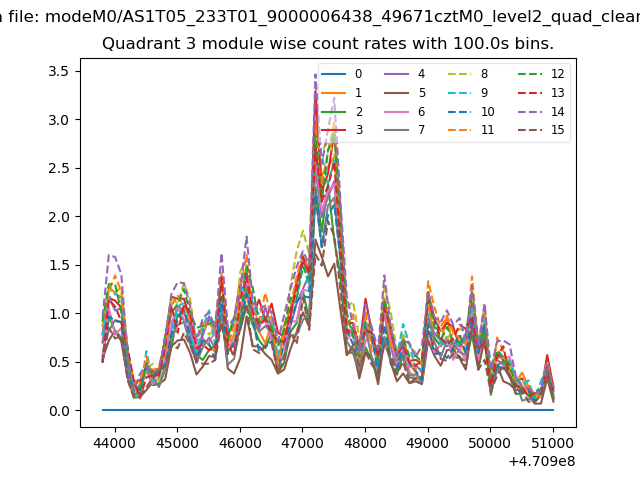
| Module-wise count rates for Quadrant C Data is divided into 100 sec bins |
 |
 |
| Module-wise count rates for Quadrant D Data is divided into 100 sec bins |
 |
 |
| Parameter | Plot |
|---|---|
| CZT HV Monitor |  |
| D_VDD | 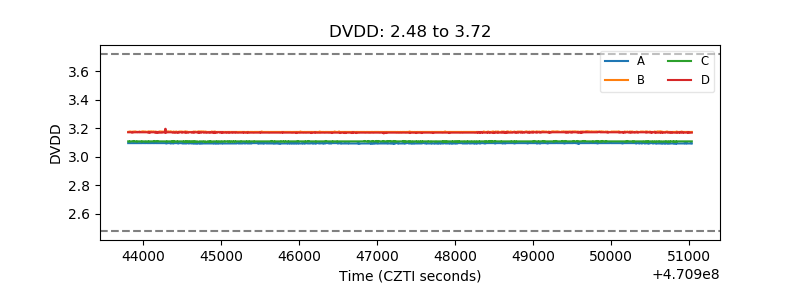 |
| Temperature 1 | 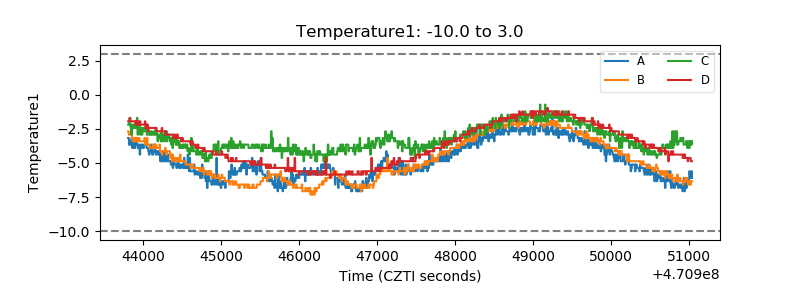 |
| Veto HV Monitor | 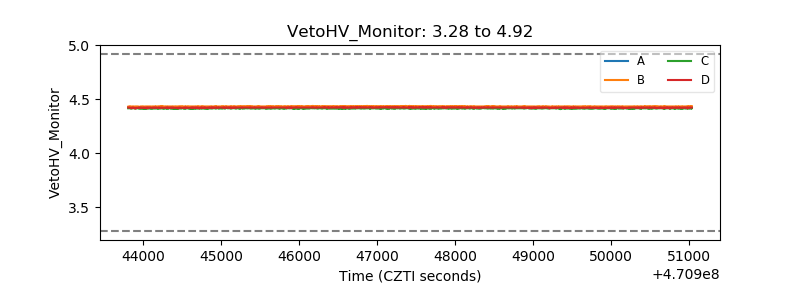 |
| Veto LLD | 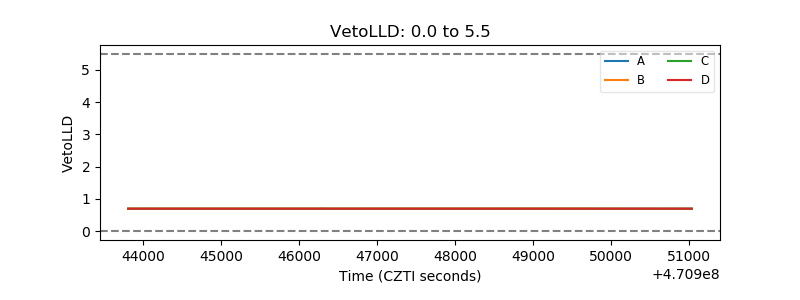 |
| Alpha Counter | 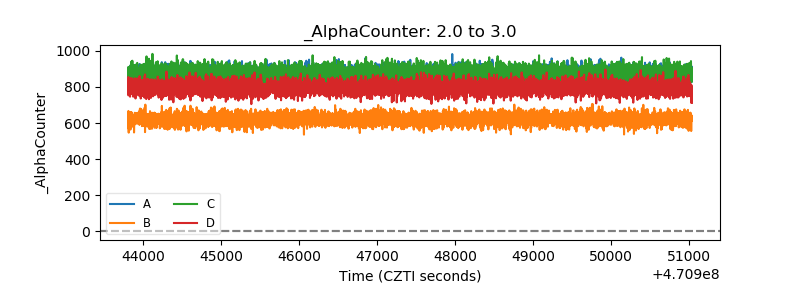 |
| _CPM_Rate | 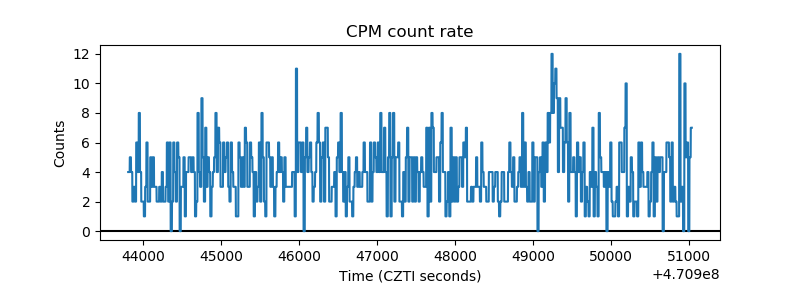 |
| CZT Counter | 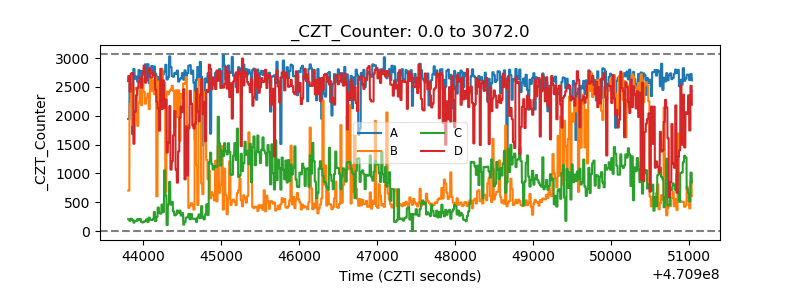 |
| +2.5 Volts monitor | 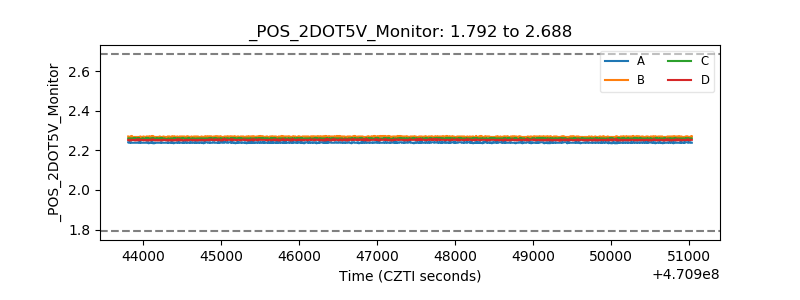 |
| +5 Volts monitor |  |
| _ROLL_ROT | 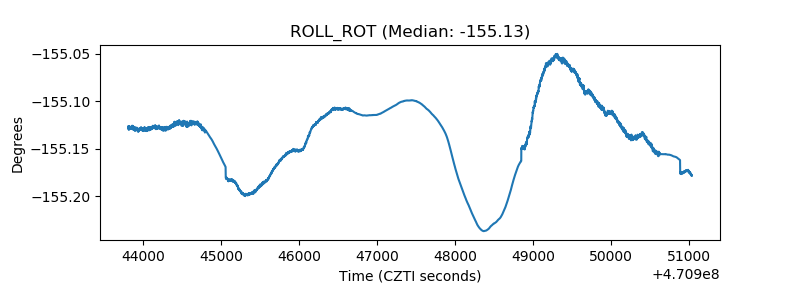 |
| _Roll_DEC | 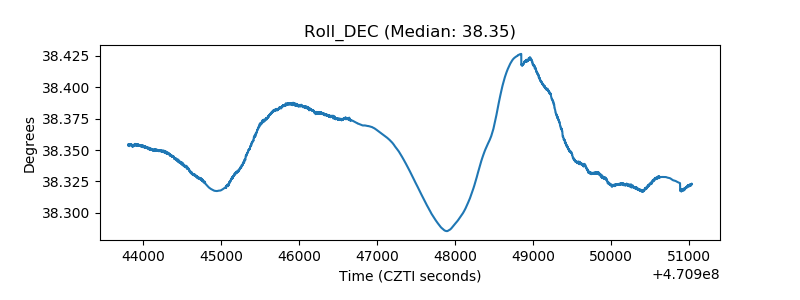 |
| _Roll_RA | 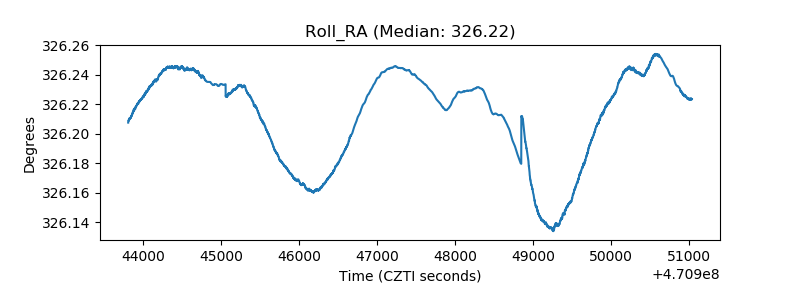 |
| Veto Counter | 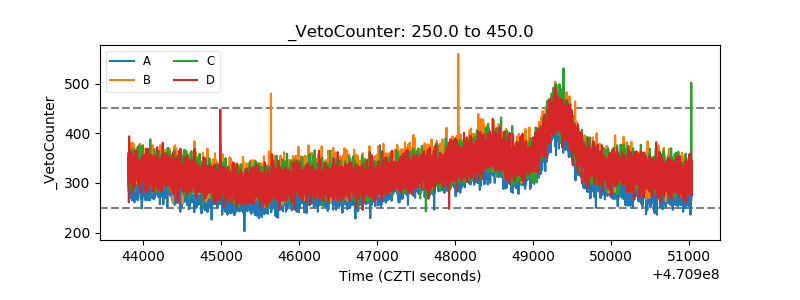 |