| Param | Original file | Final file |
|---|---|---|
| Filename | modeM0/AS1T05_233T01_9000006438_49674cztM0_level2.fits | modeM0/AS1T05_233T01_9000006438_49674cztM0_level2_quad_clean.evt |
| Size (bytes) | 3,205,157,760 | 91,572,480 |
| Size | 3.0 GB | 87.3 MB |
| Events in quadrant A | 44,922,896 | 17,890 |
| Events in quadrant B | 14,915,357 | 1,514,168 |
| Events in quadrant C | 15,548,452 | 827 |
| Events in quadrant D | 41,868,962 | 2,588 |
| Mode M9 | |||
|---|---|---|---|
| Quadrant | BADHDUFLAG | Total packets | Discarded packets |
| A | 0 | 12 | 0 |
| B | 0 | 12 | 0 |
| C | 0 | 12 | 0 |
| D | 0 | 12 | 0 |
| Mode SS | |||
|---|---|---|---|
| Quadrant | BADHDUFLAG | Total packets | Discarded packets |
| A | 0 | 360 | 0 |
| B | 0 | 360 | 0 |
| C | 0 | 360 | 0 |
| D | 0 | 360 | 0 |
| Mode M0 | |||
|---|---|---|---|
| Quadrant | BADHDUFLAG | Total packets | Discarded packets |
| A | 0 | 145814 | 2 |
| B | 0 | 56604 | 2 |
| C | 0 | 59122 | 2 |
| D | 0 | 136796 | 3 |
| Quadrant | Total seconds | Saturated seconds | Saturation percentage |
|---|---|---|---|
| A | 17944 | 17814 | 99.275524% |
| B | 17944 | 2650 | 14.768168% |
| C | 17945 | 17938 | 99.960992% |
| D | 17944 | 17925 | 99.894115% |
Noise dominated data is calculated using 1-second bins in cleaned event files. If a bin has >2000 counts, and if more than 50% of those come from <1% of pixels, then it is considered to be noise-dominated and hence unusable.
| Quadrant | # 1 sec bins | Bins with >0 counts | Bins with >2000 counts | High rate bins dominated by noise | Noise dominated (total time) | Noise dominated (detector-on time) | Marked lightcurve |
|---|---|---|---|---|---|---|---|
| A | 19024 | 17943 | 16629 | 16629 | 87.41% | 92.68% | 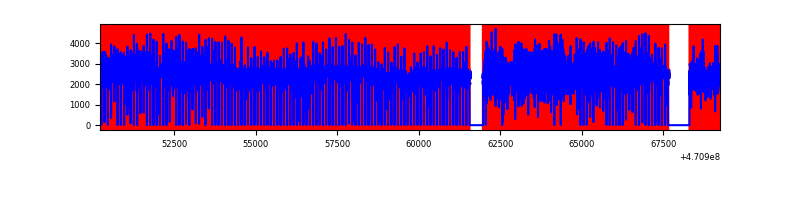 |
| B | 19024 | 17944 | 1747 | 1747 | 9.18% | 9.74% | 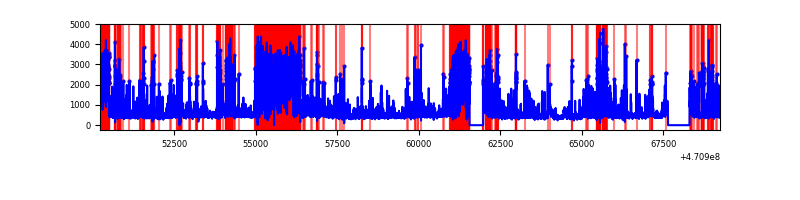 |
| C | 19024 | 17944 | 863 | 863 | 4.54% | 4.81% | 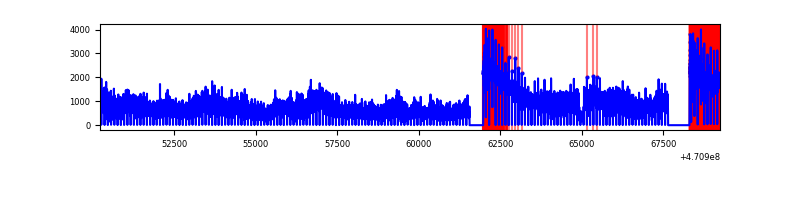 |
| D | 19023 | 17942 | 14084 | 14084 | 74.04% | 78.50% | 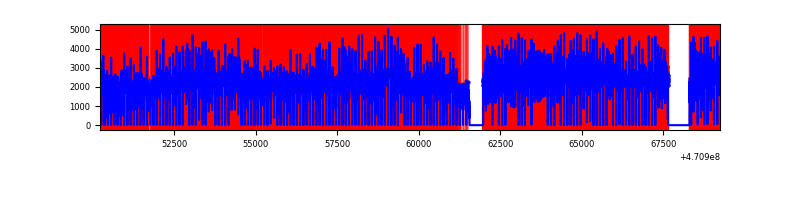 |
Top three noisy pixels from each quadrant. If the there are fewer than three noisy pixels in the level2.evt file, extra rows are filled as -1
| Pixel properties | Quadrant properties | ||||||
|---|---|---|---|---|---|---|---|
| Quadrant | DetID | PixID | Counts | Sigma | Mean | Median | Sigma |
| A | 0 | 99 | 16410988 | 88867.85 | 503 | 477 | 184.7 |
| A | 10 | 83 | 8618156 | 46667.32 | 503 | 477 | 184.7 |
| A | 0 | 98 | 3137514 | 16988.0 | 503 | 477 | 184.7 |
| B | 3 | 232 | 3328235 | 8964.26 | 1757 | 1700 | 371.1 |
| B | 4 | 206 | 959054 | 2579.85 | 1757 | 1700 | 371.1 |
| B | 3 | 216 | 770277 | 2071.14 | 1757 | 1700 | 371.1 |
| C | 15 | 180 | 3136647 | 58382.45 | 68 | 61 | 53.7 |
| C | 15 | 190 | 2000687 | 37238.4 | 68 | 61 | 53.7 |
| C | 15 | 181 | 1663194 | 30956.52 | 68 | 61 | 53.7 |
| D | 15 | 184 | 8352438 | 39541.55 | 312 | 280 | 211.2 |
| D | 15 | 40 | 6883725 | 32588.23 | 312 | 280 | 211.2 |
| D | 15 | 140 | 2674843 | 12662.16 | 312 | 280 | 211.2 |
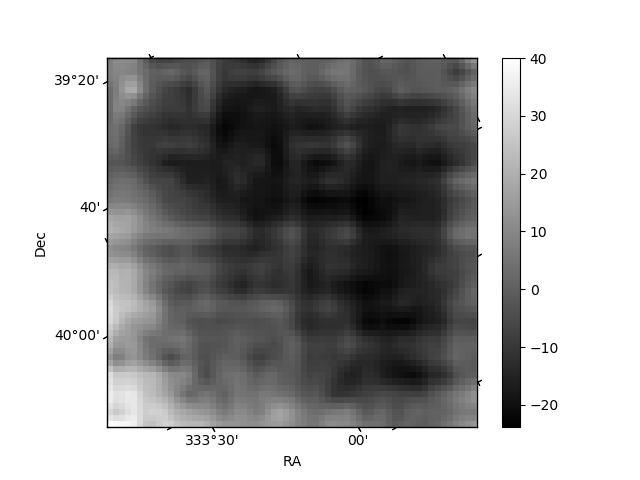
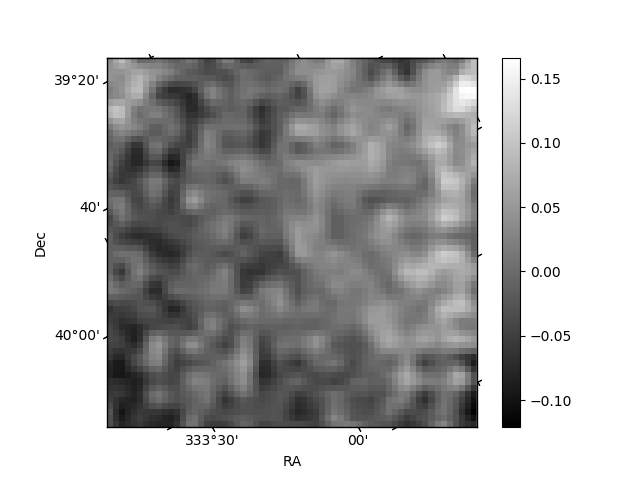
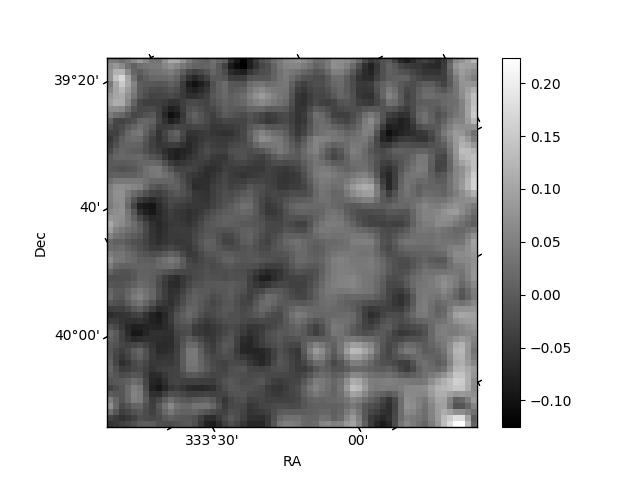
Histogram calculated using DETX and DETY for each event in the final _common_clean file
| Quadrant A | 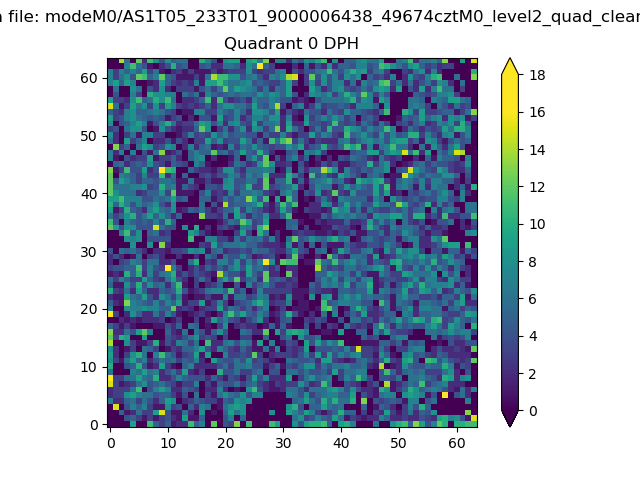 |
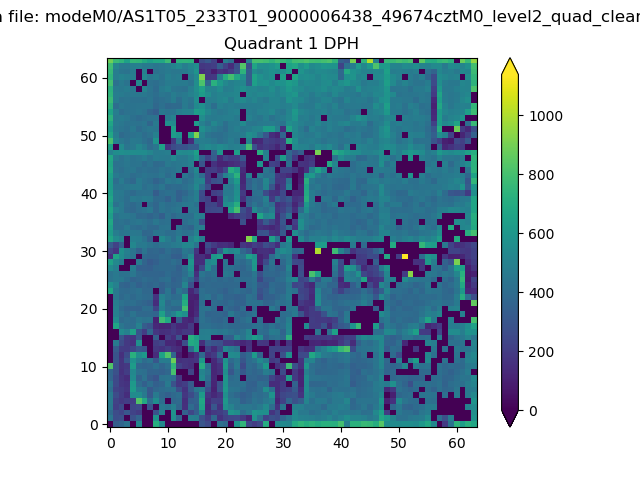 |
Quadrant B |
|---|---|---|---|
| Quadrant D | 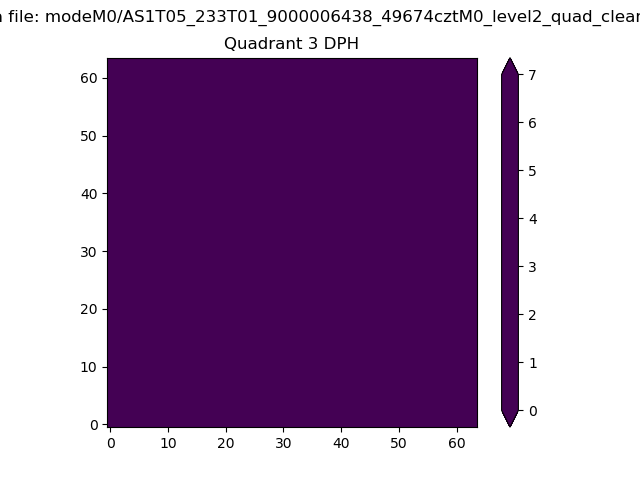 |
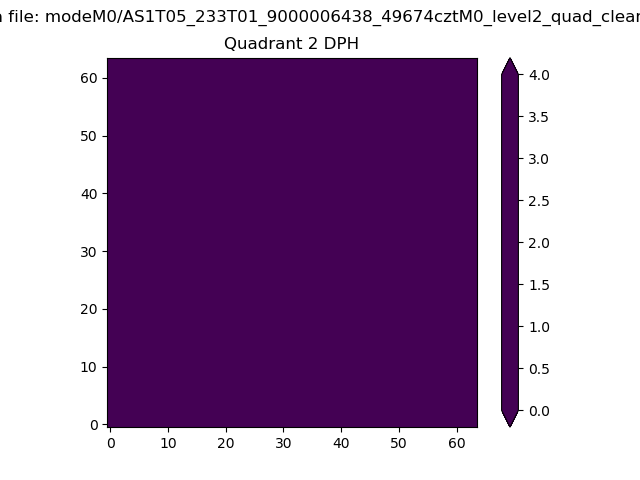 |
Quadrant C |
| Plot type | Count rate plots | Images |
|---|---|---|
| Comparison with Poisson distribution Blue bars denote a histogram of data divided into 1 sec bins. Red curve is a Poisson curve with rate = median count rate of data. |
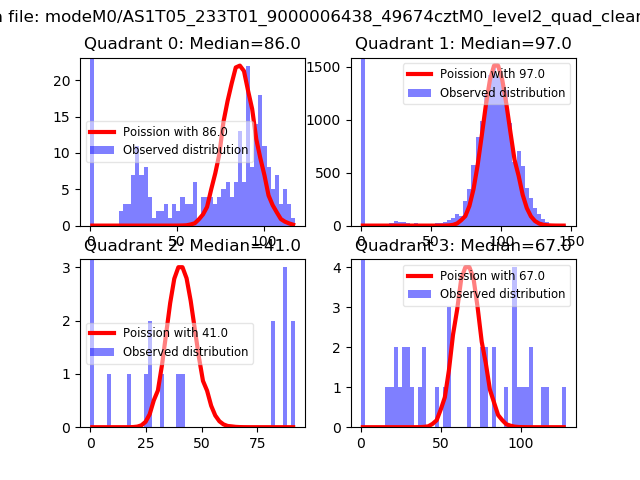 |
 |
| Quadrant-wise count rates Data is divided into 100 sec bins |
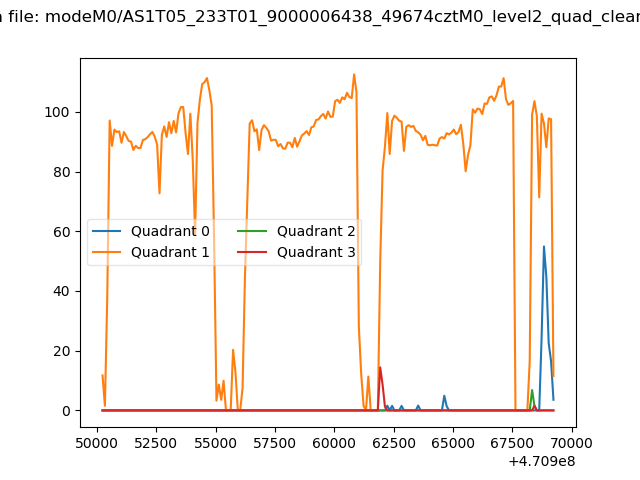 |
|
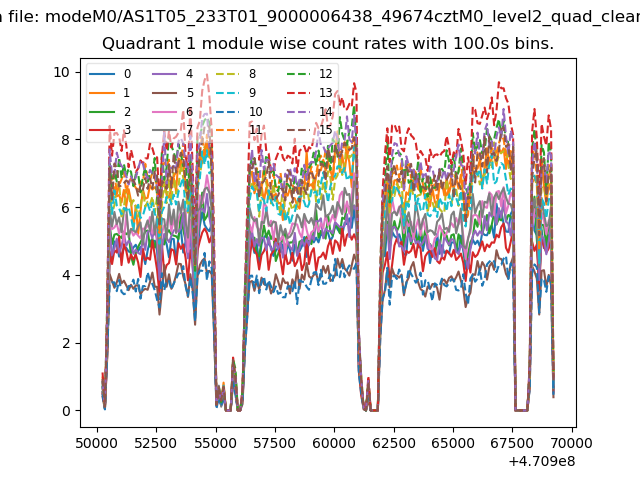
| Module-wise count rates for Quadrant A Data is divided into 100 sec bins |
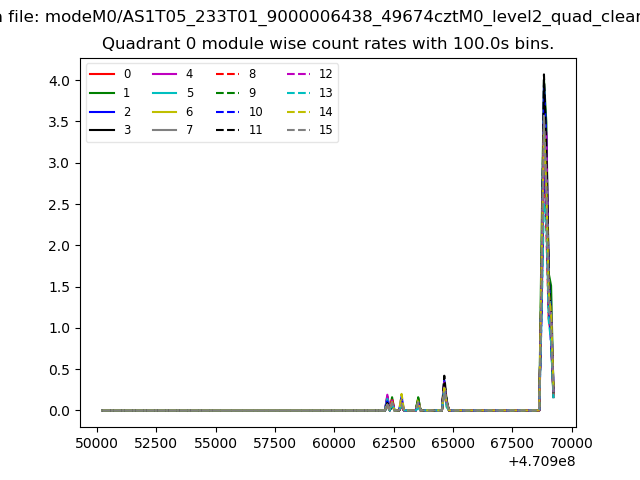 |
 |
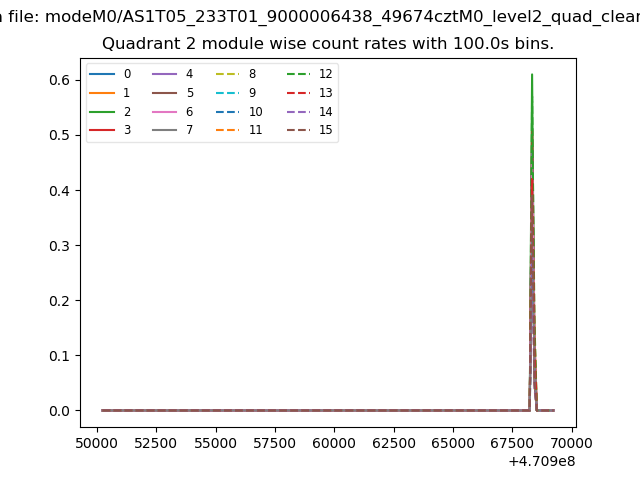
| Module-wise count rates for Quadrant B Data is divided into 100 sec bins |
 |
 |
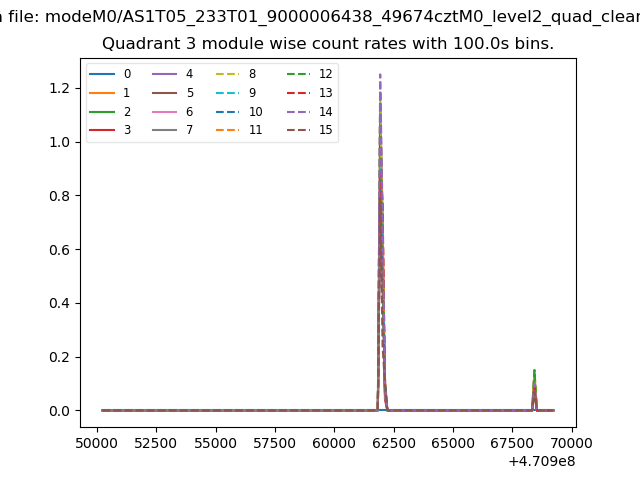
| Module-wise count rates for Quadrant C Data is divided into 100 sec bins |
 |
 |
| Module-wise count rates for Quadrant D Data is divided into 100 sec bins |
 |
 |
| Parameter | Plot |
|---|---|
| CZT HV Monitor | 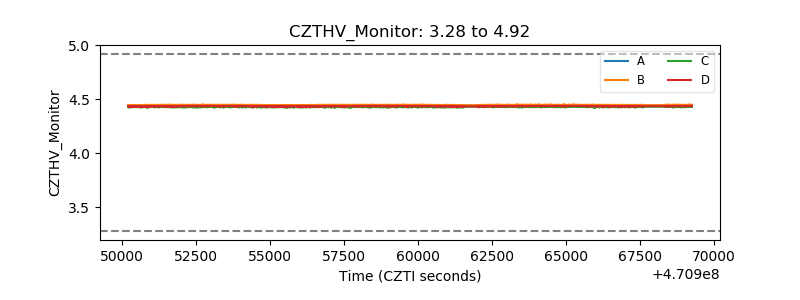 |
| D_VDD | 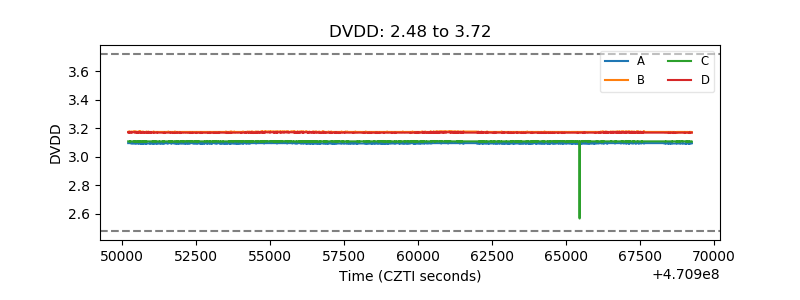 |
| Temperature 1 | 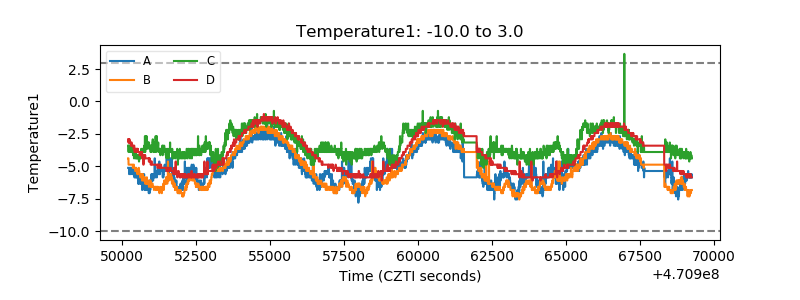 |
| Veto HV Monitor | 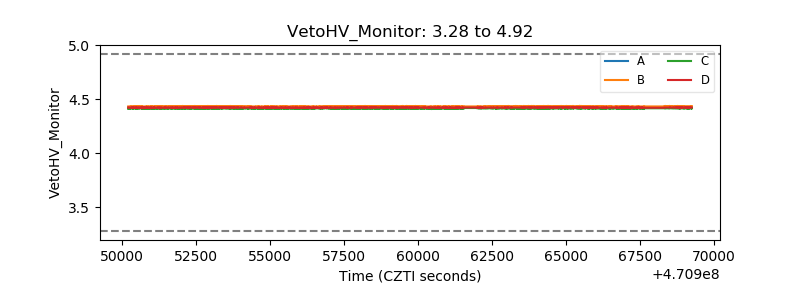 |
| Veto LLD | 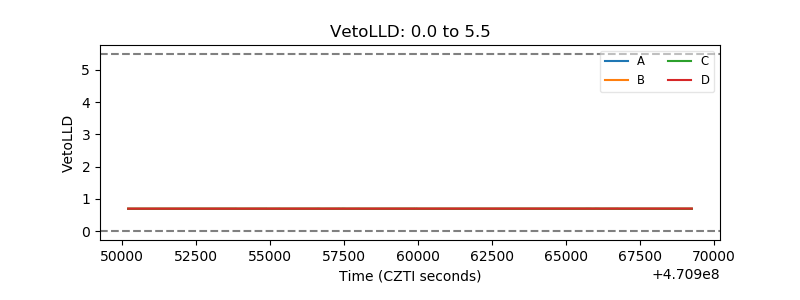 |
| Alpha Counter | 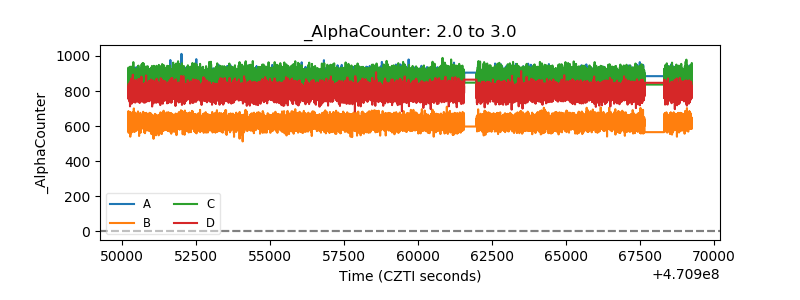 |
| _CPM_Rate | 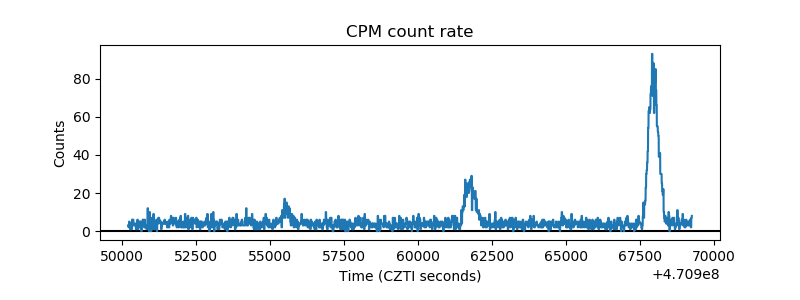 |
| CZT Counter | 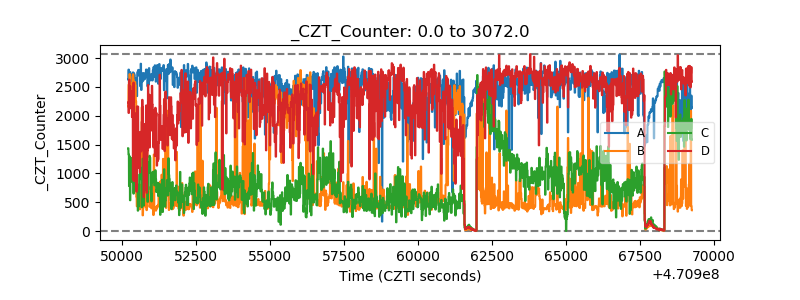 |
| +2.5 Volts monitor | 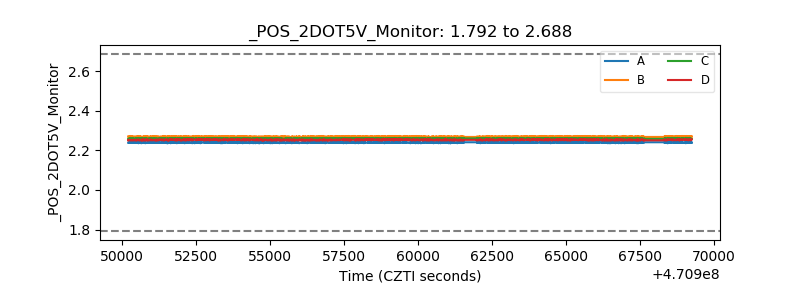 |
| +5 Volts monitor | 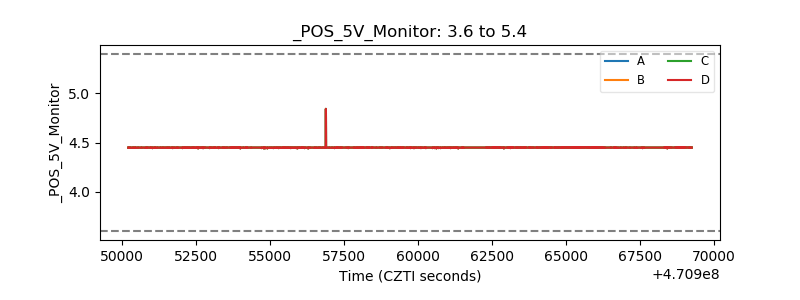 |
| _ROLL_ROT | 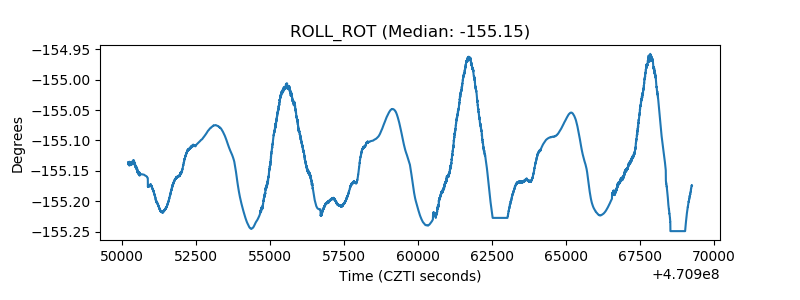 |
| _Roll_DEC | 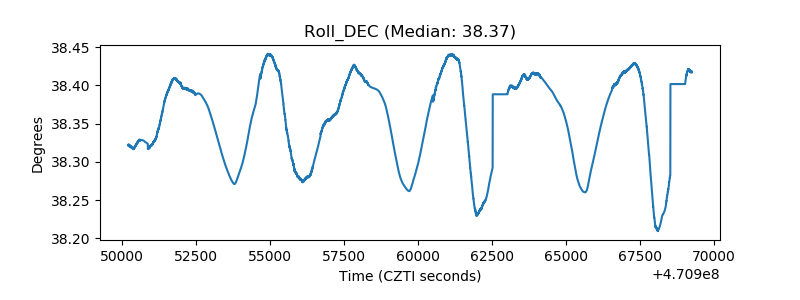 |
| _Roll_RA | 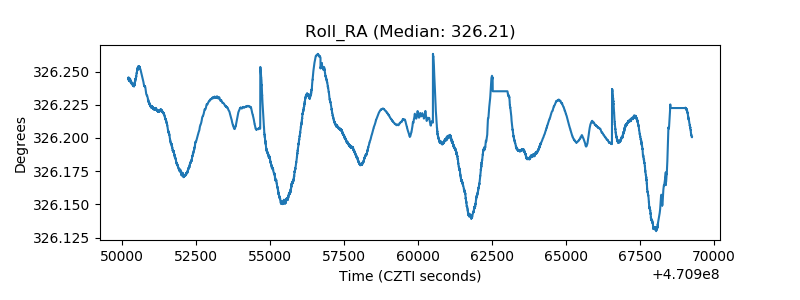 |
| Veto Counter | 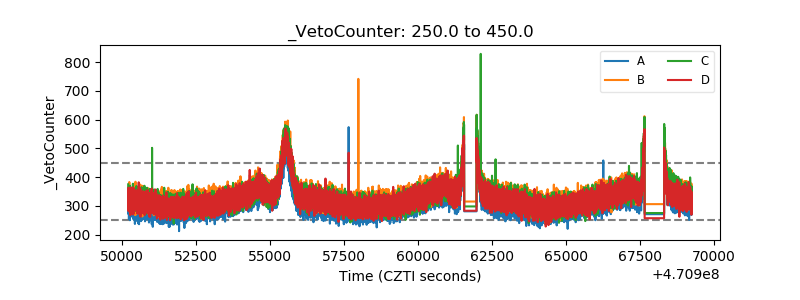 |