| Param | Original file | Final file |
|---|---|---|
| Filename | modeM0/AS1T05_233T01_9000006438_49675cztM0_level2.fits | modeM0/AS1T05_233T01_9000006438_49675cztM0_level2_quad_clean.evt |
| Size (bytes) | 1,162,595,520 | 52,099,200 |
| Size | 1.1 GB | 49.7 MB |
| Events in quadrant A | 15,124,841 | 351,379 |
| Events in quadrant B | 3,857,269 | 617,868 |
| Events in quadrant C | 7,710,331 | 9,130 |
| Events in quadrant D | 15,861,059 | 156,307 |
| Mode M9 | |||
|---|---|---|---|
| Quadrant | BADHDUFLAG | Total packets | Discarded packets |
| A | 0 | 8 | 0 |
| B | 0 | 8 | 0 |
| C | 0 | 8 | 0 |
| D | 0 | 8 | 0 |
| Mode SS | |||
|---|---|---|---|
| Quadrant | BADHDUFLAG | Total packets | Discarded packets |
| A | 0 | 126 | 0 |
| B | 0 | 126 | 0 |
| C | 0 | 126 | 0 |
| D | 0 | 126 | 0 |
| Mode M0 | |||
|---|---|---|---|
| Quadrant | BADHDUFLAG | Total packets | Discarded packets |
| A | 0 | 49180 | 0 |
| B | 0 | 15897 | 0 |
| C | 0 | 27308 | 0 |
| D | 0 | 51433 | 0 |
| Quadrant | Total seconds | Saturated seconds | Saturation percentage |
|---|---|---|---|
| A | 6219 | 5592 | 89.917993% |
| B | 6219 | 252 | 4.052098% |
| C | 6219 | 6219 | 100.000000% |
| D | 6220 | 6031 | 96.961415% |
Noise dominated data is calculated using 1-second bins in cleaned event files. If a bin has >2000 counts, and if more than 50% of those come from <1% of pixels, then it is considered to be noise-dominated and hence unusable.
| Quadrant | # 1 sec bins | Bins with >0 counts | Bins with >2000 counts | High rate bins dominated by noise | Noise dominated (total time) | Noise dominated (detector-on time) | Marked lightcurve |
|---|---|---|---|---|---|---|---|
| A | 7034 | 6220 | 5512 | 5512 | 78.36% | 88.62% | 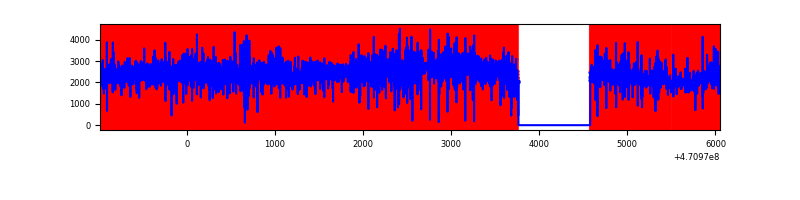 |
| B | 7034 | 6220 | 115 | 115 | 1.63% | 1.85% | 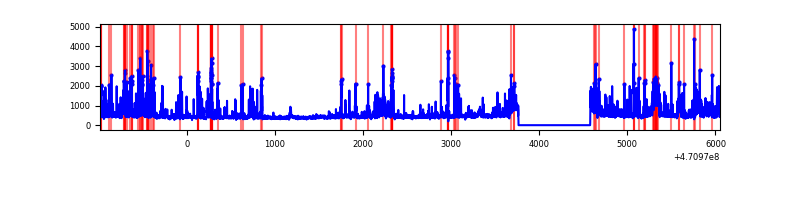 |
| C | 7033 | 6218 | 259 | 259 | 3.68% | 4.17% | 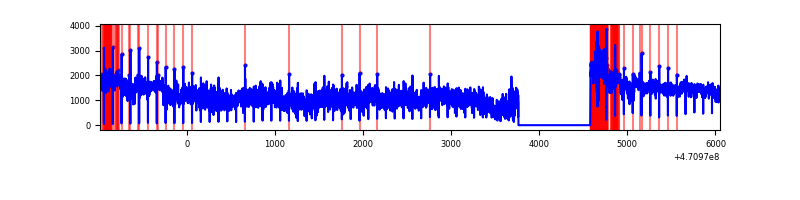 |
| D | 7034 | 6219 | 5625 | 5625 | 79.97% | 90.45% | 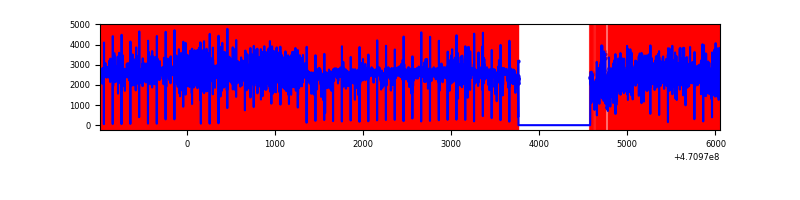 |
Top three noisy pixels from each quadrant. If the there are fewer than three noisy pixels in the level2.evt file, extra rows are filled as -1
| Pixel properties | Quadrant properties | ||||||
|---|---|---|---|---|---|---|---|
| Quadrant | DetID | PixID | Counts | Sigma | Mean | Median | Sigma |
| A | 10 | 83 | 6011522 | 50263.72 | 417 | 404 | 119.6 |
| A | 12 | 50 | 2030469 | 16974.98 | 417 | 404 | 119.6 |
| A | 0 | 99 | 1423958 | 11903.46 | 417 | 404 | 119.6 |
| B | 7 | 0 | 513494 | 3684.01 | 654 | 634 | 139.2 |
| B | 4 | 206 | 218060 | 1561.83 | 654 | 634 | 139.2 |
| B | 5 | 185 | 83059 | 592.08 | 654 | 634 | 139.2 |
| C | 15 | 190 | 2022970 | 133121.75 | 30 | 29 | 15.2 |
| C | 15 | 180 | 1815660 | 119479.5 | 30 | 29 | 15.2 |
| C | 15 | 163 | 786926 | 51782.58 | 30 | 29 | 15.2 |
| D | 15 | 40 | 4422295 | 56843.89 | 207 | 196 | 77.8 |
| D | 15 | 106 | 1758464 | 22601.66 | 207 | 196 | 77.8 |
| D | 15 | 140 | 1281988 | 16476.8 | 207 | 196 | 77.8 |
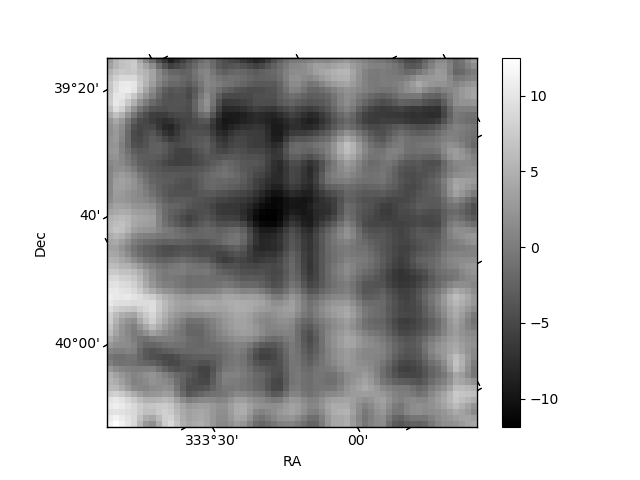
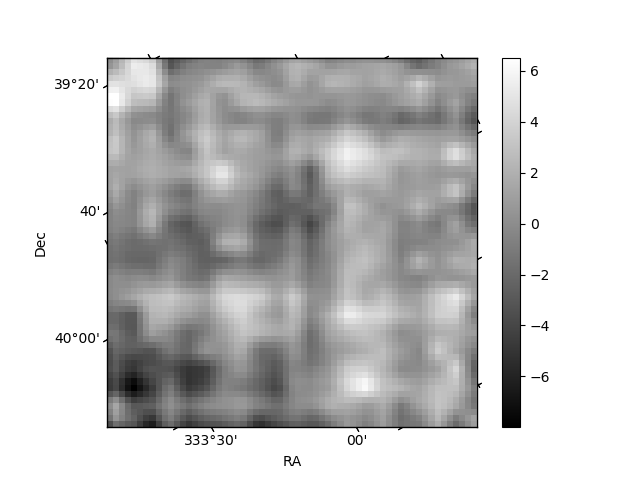
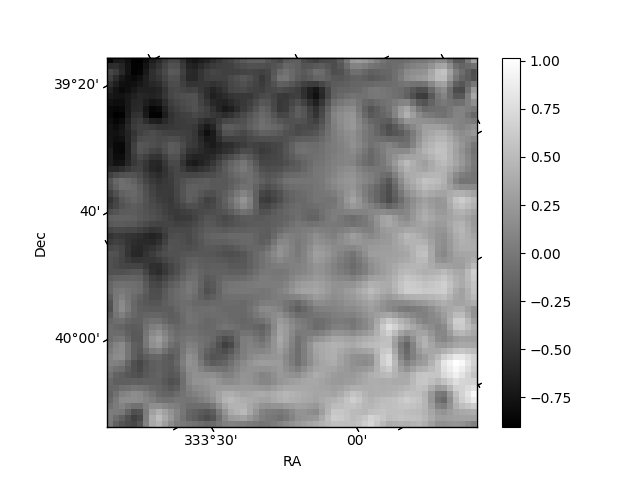
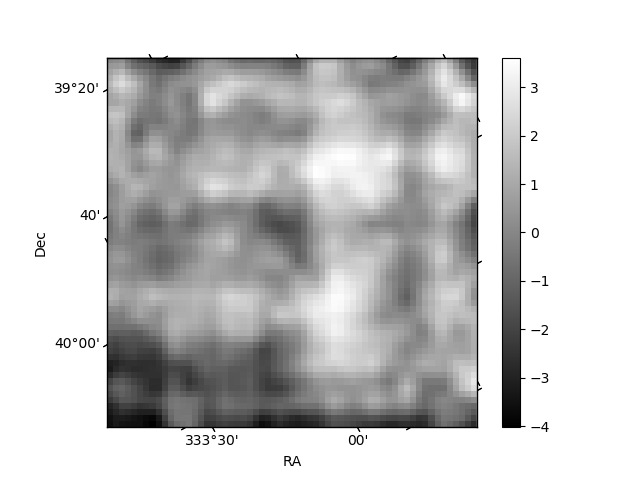
Histogram calculated using DETX and DETY for each event in the final _common_clean file
| Quadrant A | 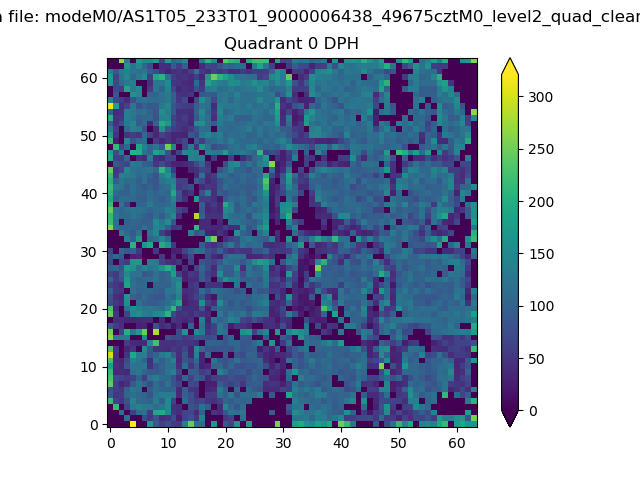 |
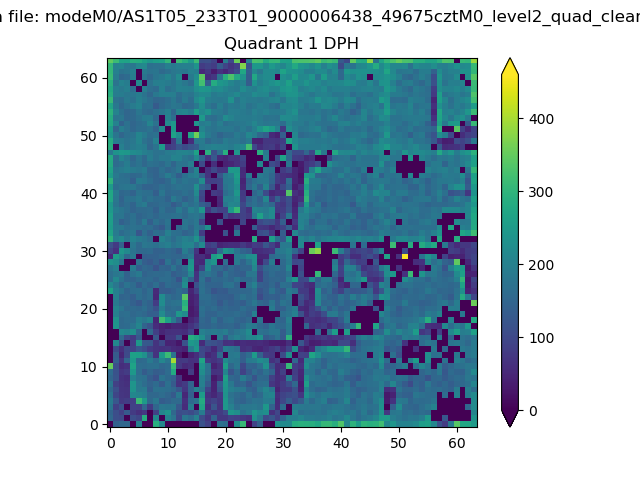 |
Quadrant B |
|---|---|---|---|
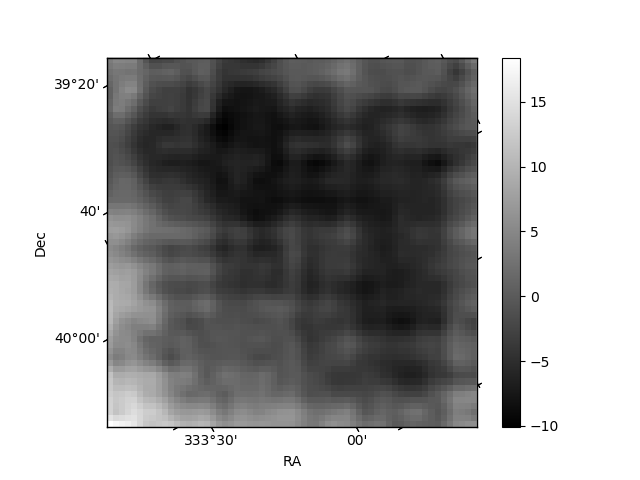
| Quadrant D | 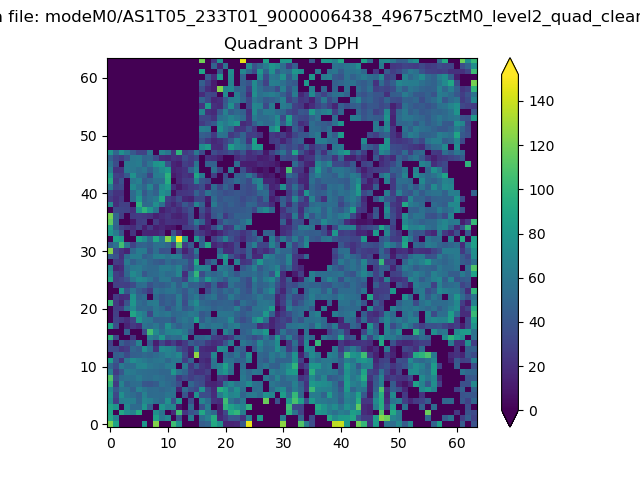 |
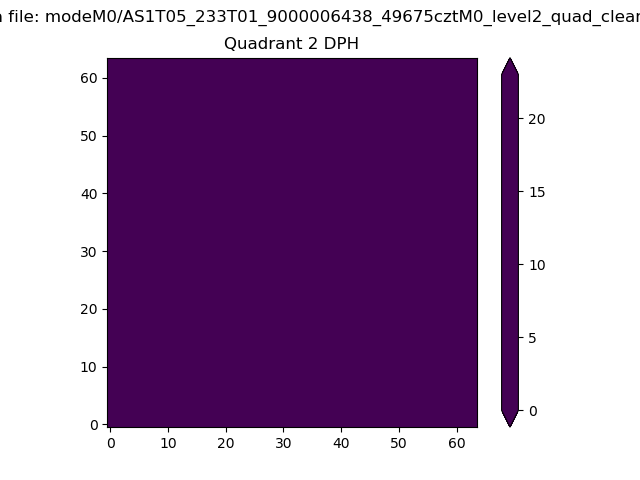 |
Quadrant C |
| Plot type | Count rate plots | Images |
|---|---|---|
| Comparison with Poisson distribution Blue bars denote a histogram of data divided into 1 sec bins. Red curve is a Poisson curve with rate = median count rate of data. |
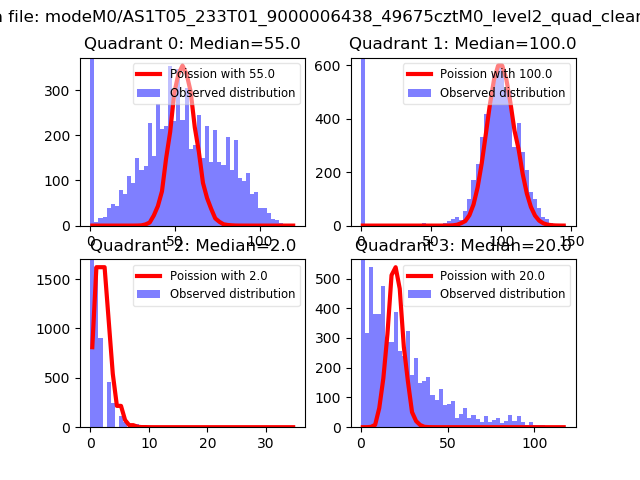 |
 |
| Quadrant-wise count rates Data is divided into 100 sec bins |
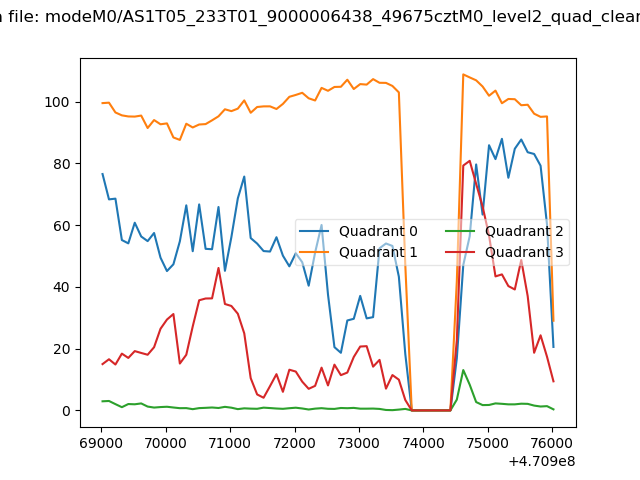 |
|
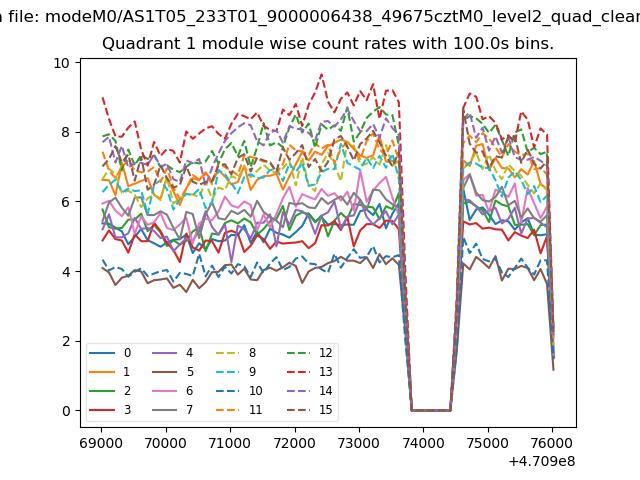
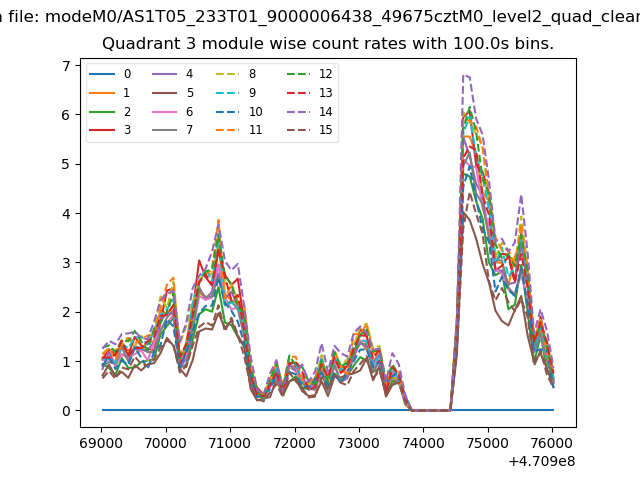
| Module-wise count rates for Quadrant A Data is divided into 100 sec bins |
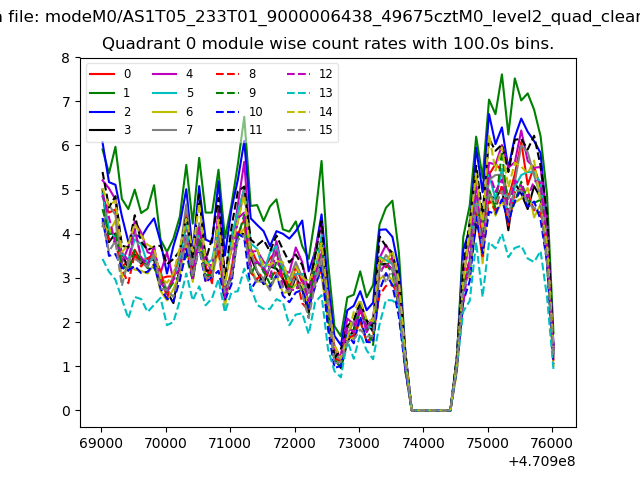 |
 |
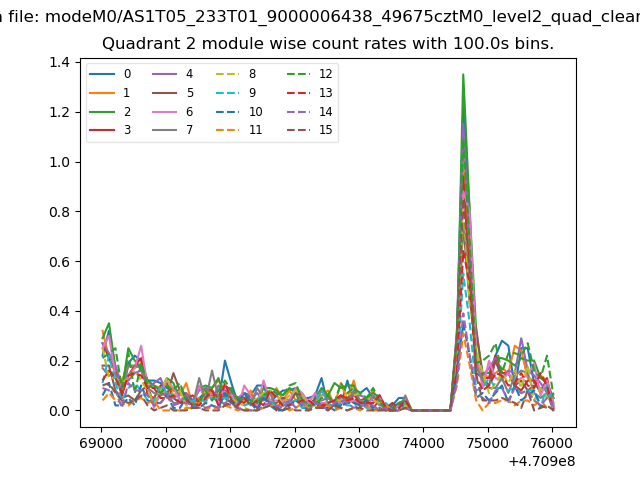
| Module-wise count rates for Quadrant B Data is divided into 100 sec bins |
 |
 |
| Module-wise count rates for Quadrant C Data is divided into 100 sec bins |
 |
 |
| Module-wise count rates for Quadrant D Data is divided into 100 sec bins |
 |
 |
| Parameter | Plot |
|---|---|
| CZT HV Monitor | 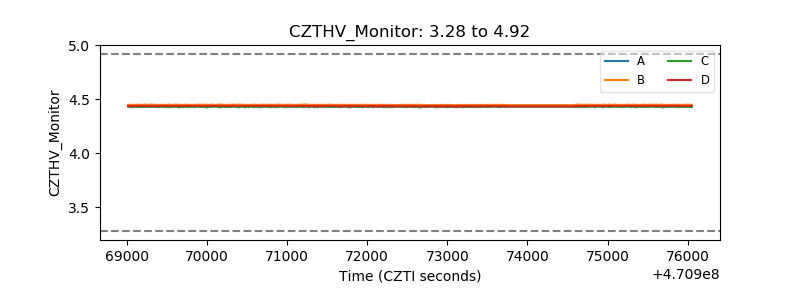 |
| D_VDD | 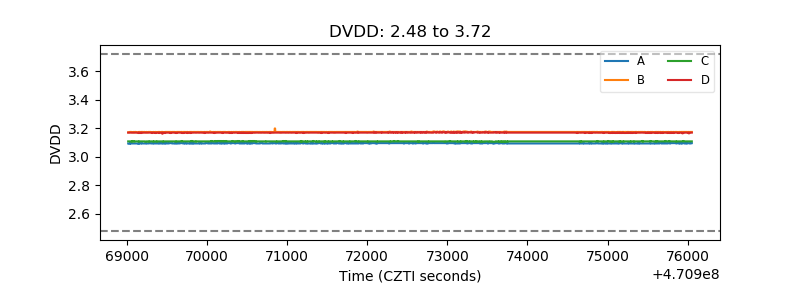 |
| Temperature 1 | 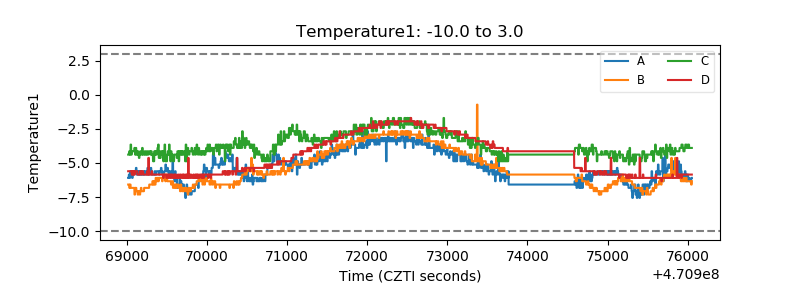 |
| Veto HV Monitor | 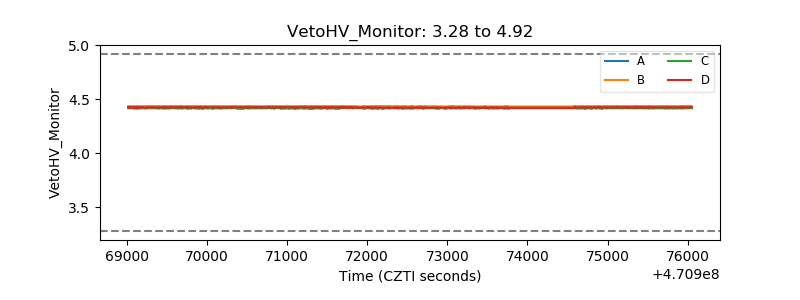 |
| Veto LLD | 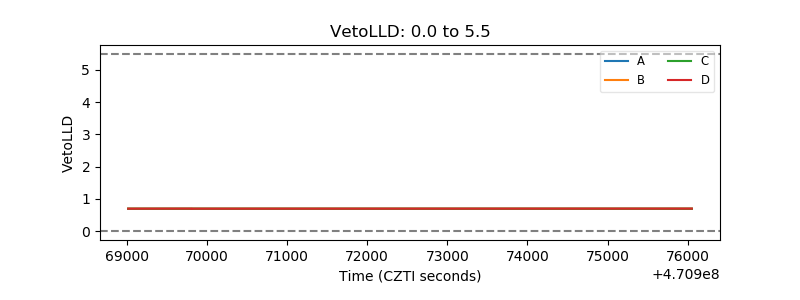 |
| Alpha Counter | 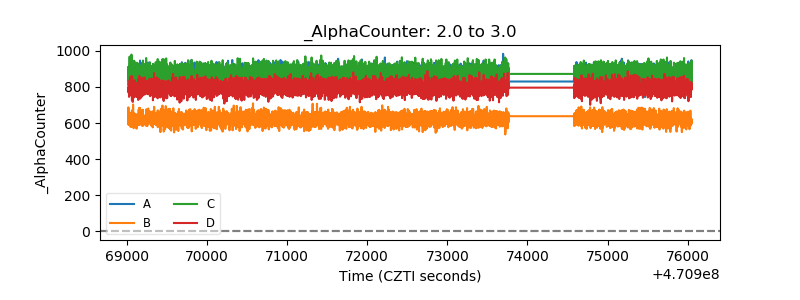 |
| _CPM_Rate | 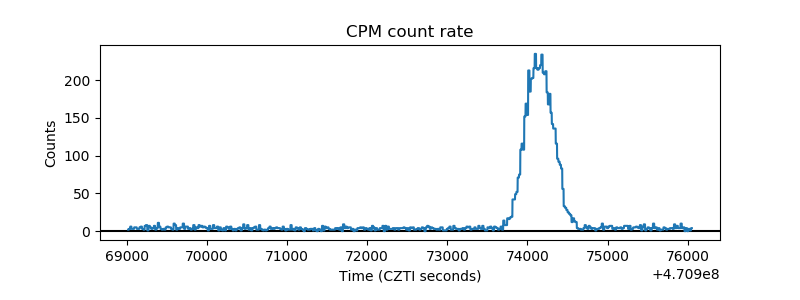 |
| CZT Counter | 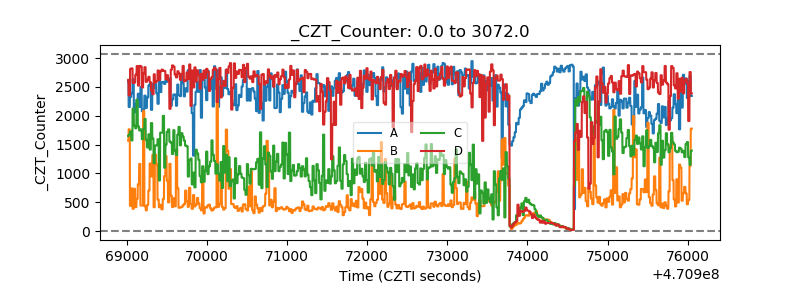 |
| +2.5 Volts monitor | 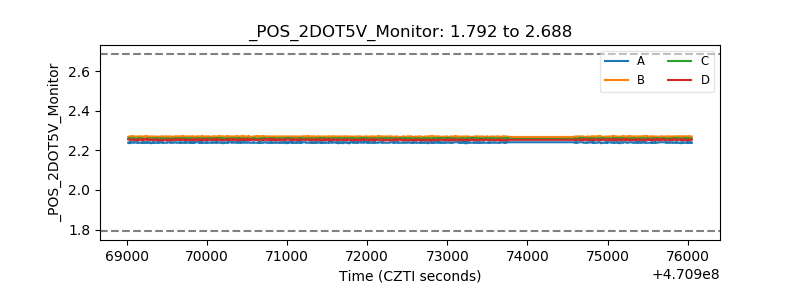 |
| +5 Volts monitor | 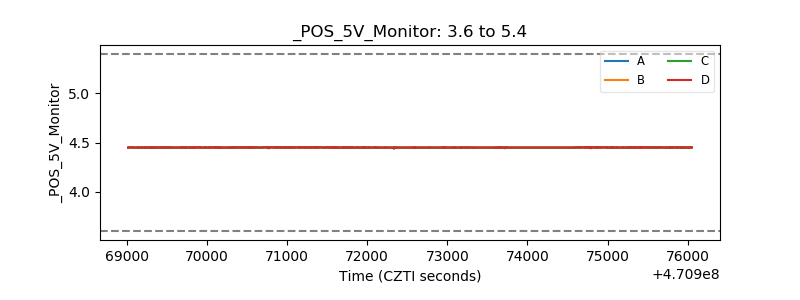 |
| _ROLL_ROT | 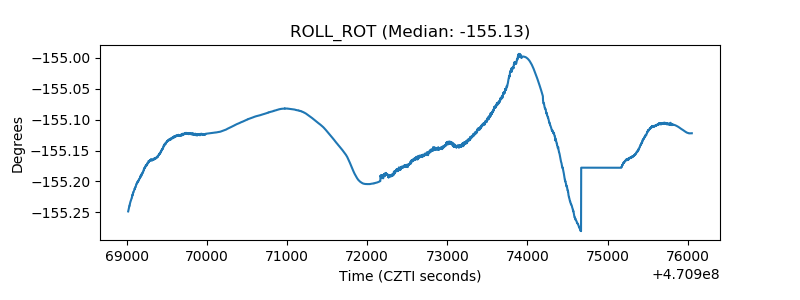 |
| _Roll_DEC | 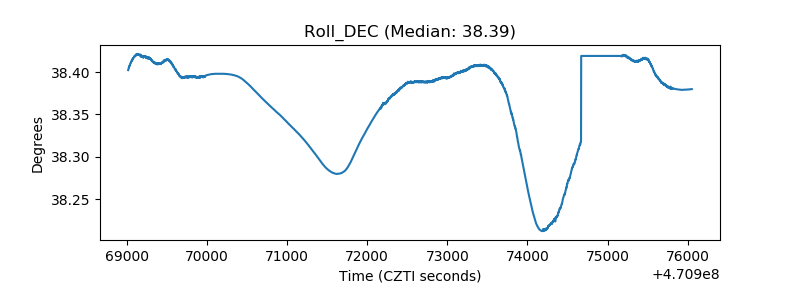 |
| _Roll_RA | 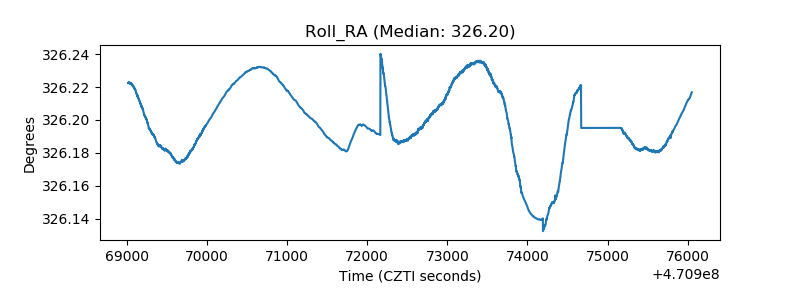 |
| Veto Counter | 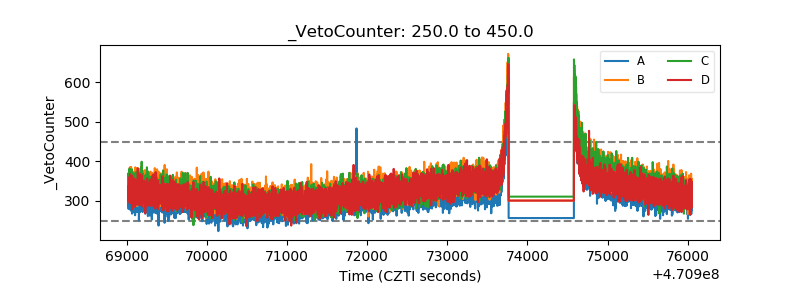 |