| Param | Original file | Final file |
|---|---|---|
| Filename | modeM0/AS1T05_233T01_9000006438_49676cztM0_level2.fits | modeM0/AS1T05_233T01_9000006438_49676cztM0_level2_quad_clean.evt |
| Size (bytes) | 1,160,752,320 | 54,455,040 |
| Size | 1.1 GB | 51.9 MB |
| Events in quadrant A | 14,143,803 | 411,346 |
| Events in quadrant B | 4,595,285 | 616,274 |
| Events in quadrant C | 8,131,198 | 20,420 |
| Events in quadrant D | 15,623,566 | 165,454 |
| Mode M9 | |||
|---|---|---|---|
| Quadrant | BADHDUFLAG | Total packets | Discarded packets |
| A | 0 | 9 | 0 |
| B | 0 | 9 | 0 |
| C | 0 | 9 | 0 |
| D | 0 | 9 | 0 |
| Mode SS | |||
|---|---|---|---|
| Quadrant | BADHDUFLAG | Total packets | Discarded packets |
| A | 0 | 124 | 0 |
| B | 0 | 124 | 0 |
| C | 0 | 124 | 0 |
| D | 0 | 124 | 0 |
| Mode M0 | |||
|---|---|---|---|
| Quadrant | BADHDUFLAG | Total packets | Discarded packets |
| A | 0 | 46167 | 0 |
| B | 0 | 17939 | 0 |
| C | 0 | 28451 | 0 |
| D | 0 | 50636 | 0 |
| Quadrant | Total seconds | Saturated seconds | Saturation percentage |
|---|---|---|---|
| A | 6115 | 4888 | 79.934587% |
| B | 6115 | 489 | 7.996729% |
| C | 6116 | 6116 | 100.000000% |
| D | 6116 | 6073 | 99.296926% |
Noise dominated data is calculated using 1-second bins in cleaned event files. If a bin has >2000 counts, and if more than 50% of those come from <1% of pixels, then it is considered to be noise-dominated and hence unusable.
| Quadrant | # 1 sec bins | Bins with >0 counts | Bins with >2000 counts | High rate bins dominated by noise | Noise dominated (total time) | Noise dominated (detector-on time) | Marked lightcurve |
|---|---|---|---|---|---|---|---|
| A | 7065 | 6115 | 4907 | 4907 | 69.46% | 80.25% | 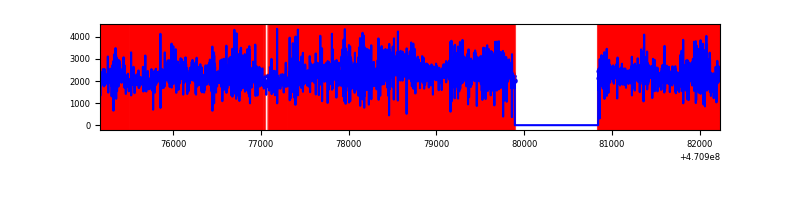 |
| B | 7065 | 6116 | 311 | 311 | 4.40% | 5.09% | 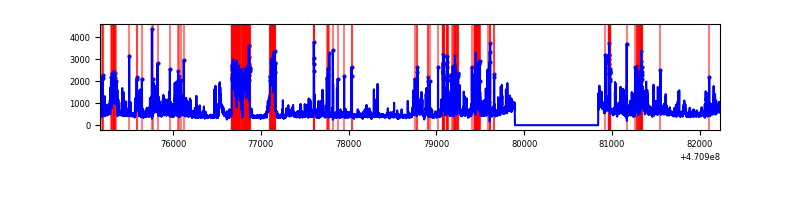 |
| C | 7065 | 6115 | 740 | 740 | 10.47% | 12.10% | 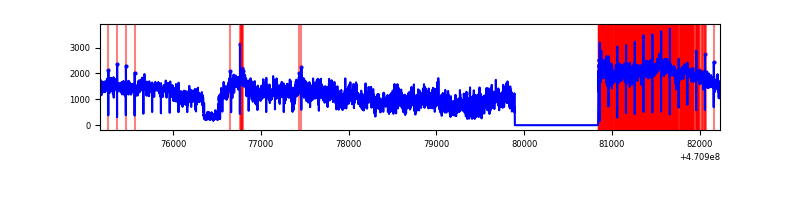 |
| D | 7066 | 6116 | 5530 | 5530 | 78.26% | 90.42% | 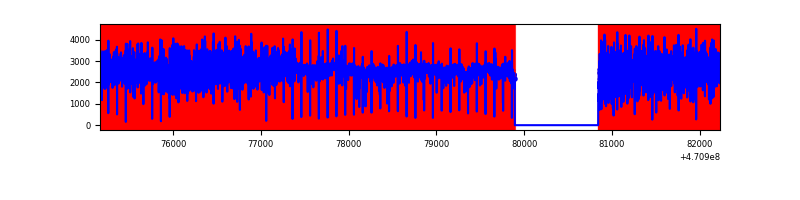 |
Top three noisy pixels from each quadrant. If the there are fewer than three noisy pixels in the level2.evt file, extra rows are filled as -1
| Pixel properties | Quadrant properties | ||||||
|---|---|---|---|---|---|---|---|
| Quadrant | DetID | PixID | Counts | Sigma | Mean | Median | Sigma |
| A | 10 | 83 | 6897337 | 51299.95 | 481 | 467 | 134.4 |
| A | 12 | 50 | 1021305 | 7593.15 | 481 | 467 | 134.4 |
| A | 0 | 99 | 808950 | 6013.62 | 481 | 467 | 134.4 |
| B | 7 | 0 | 708107 | 5172.58 | 643 | 622 | 136.8 |
| B | 5 | 49 | 555099 | 4053.9 | 643 | 622 | 136.8 |
| B | 4 | 206 | 251296 | 1832.73 | 643 | 622 | 136.8 |
| C | 15 | 190 | 2720923 | 119205.49 | 40 | 37 | 22.8 |
| C | 15 | 180 | 2250074 | 98576.99 | 40 | 37 | 22.8 |
| C | 15 | 181 | 1072840 | 47000.87 | 40 | 37 | 22.8 |
| D | 15 | 40 | 4462762 | 55627.32 | 217 | 205 | 80.2 |
| D | 7 | 30 | 1723185 | 21477.54 | 217 | 205 | 80.2 |
| D | 15 | 106 | 896039 | 11166.88 | 217 | 205 | 80.2 |
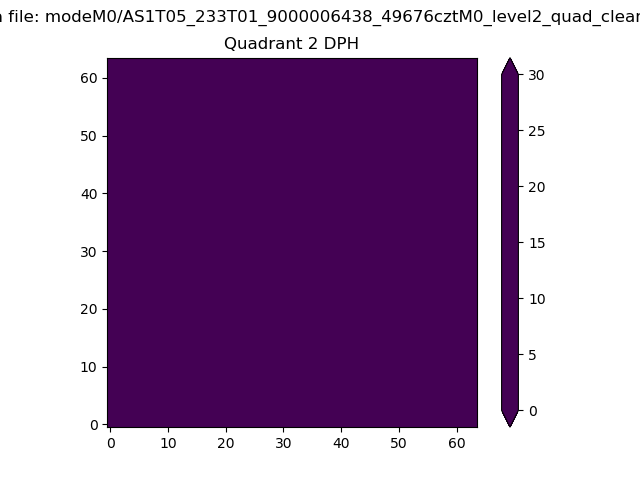
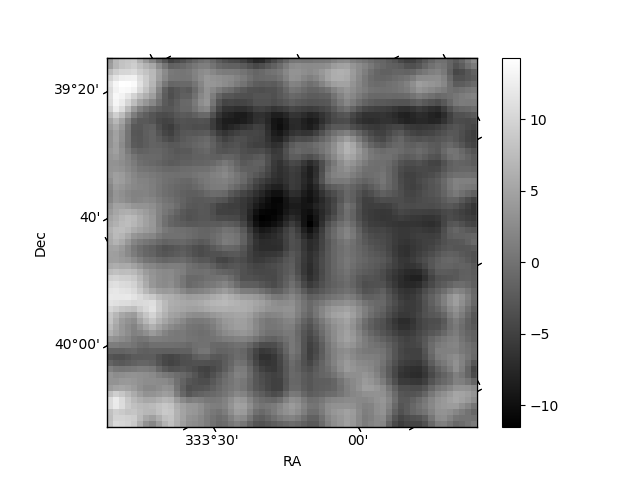
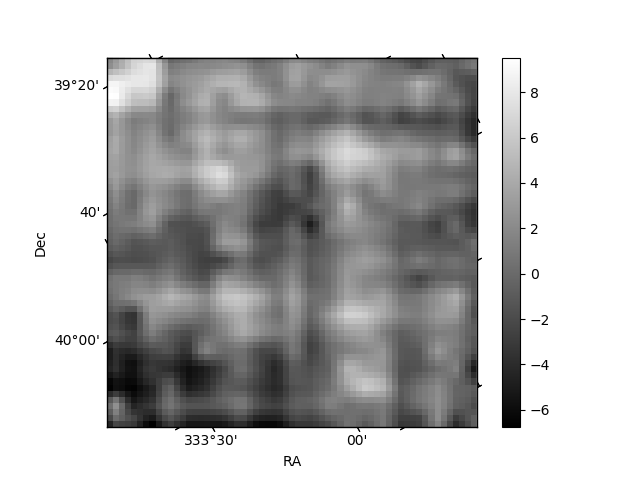
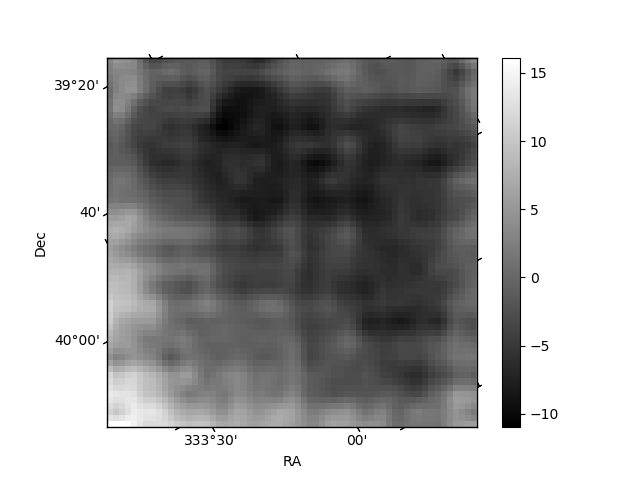
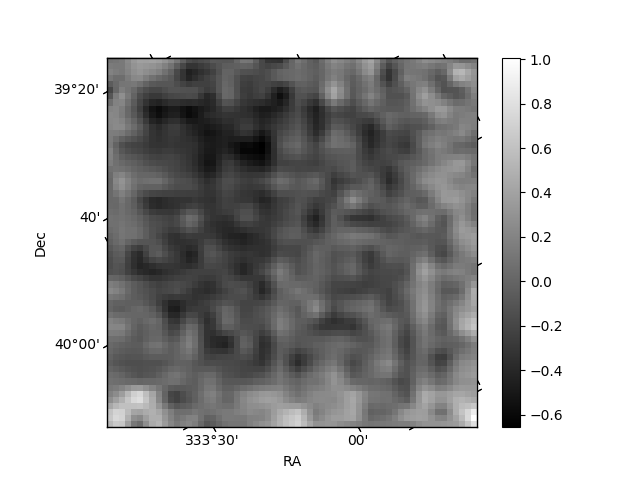
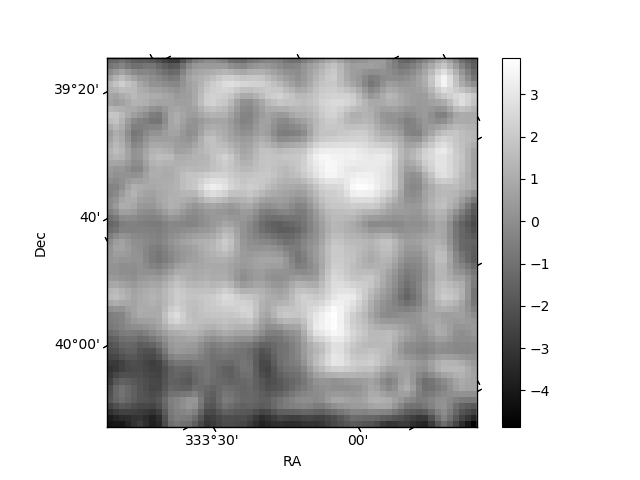
Histogram calculated using DETX and DETY for each event in the final _common_clean file
| Quadrant A | 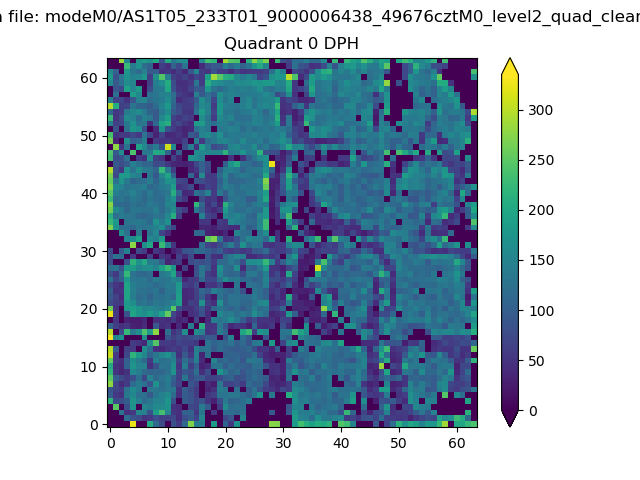 |
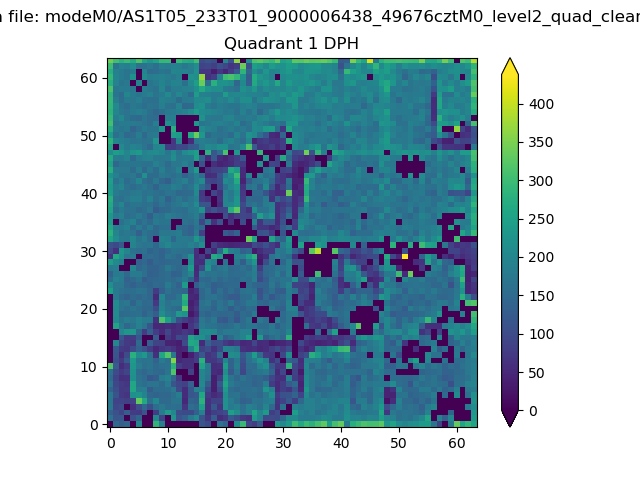 |
Quadrant B |
|---|---|---|---|
| Quadrant D | 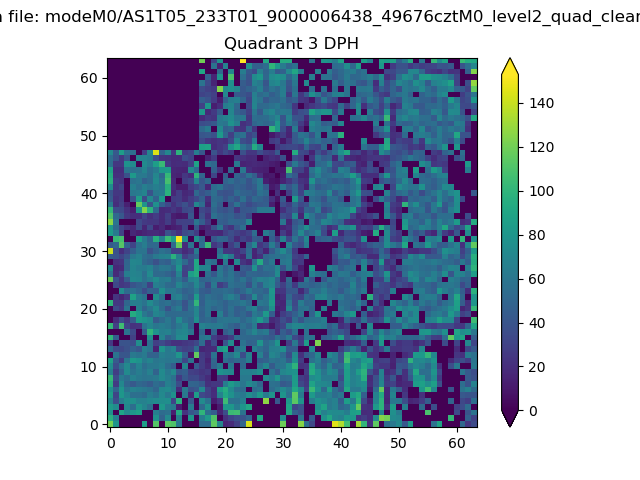 |
 |
Quadrant C |
| Plot type | Count rate plots | Images |
|---|---|---|
| Comparison with Poisson distribution Blue bars denote a histogram of data divided into 1 sec bins. Red curve is a Poisson curve with rate = median count rate of data. |
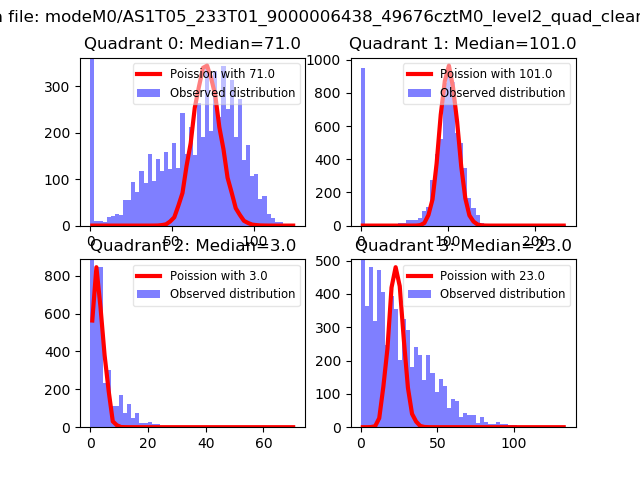 |
 |
| Quadrant-wise count rates Data is divided into 100 sec bins |
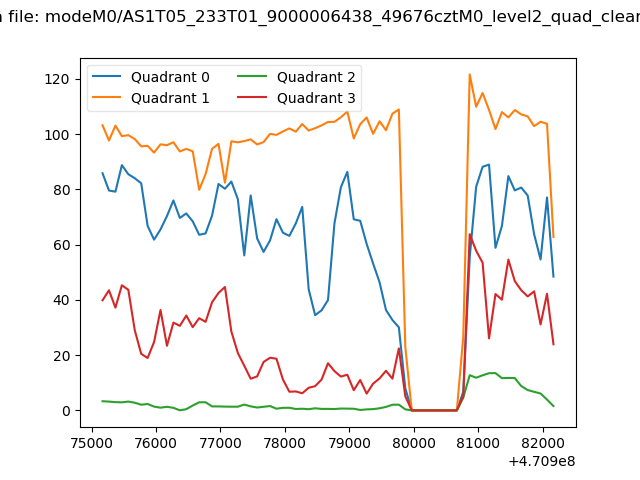 |
|
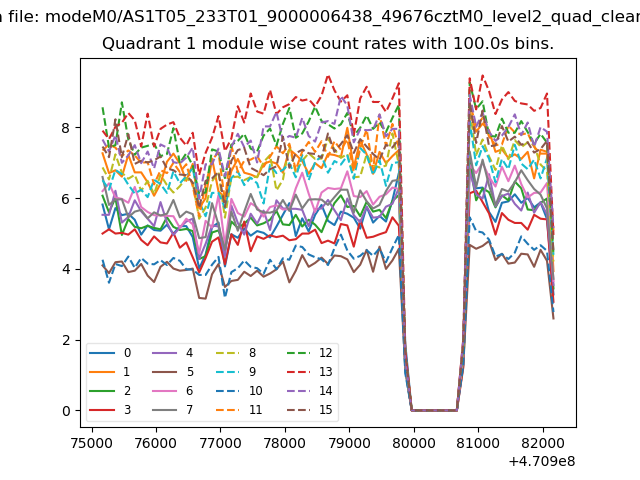
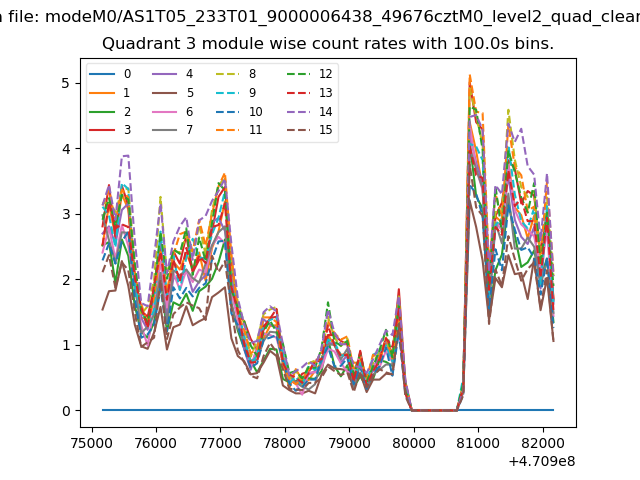
| Module-wise count rates for Quadrant A Data is divided into 100 sec bins |
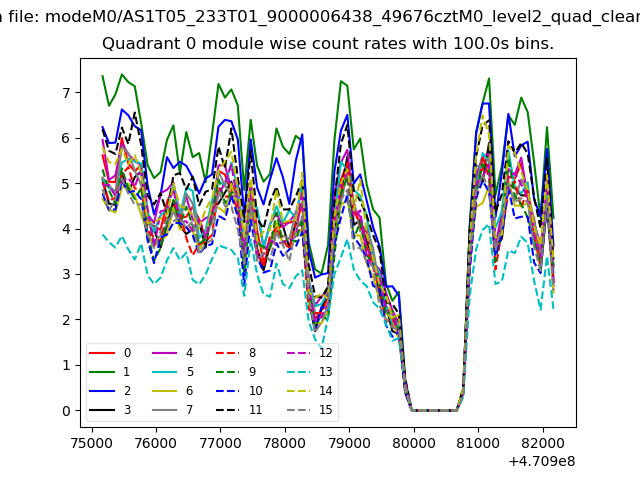 |
 |
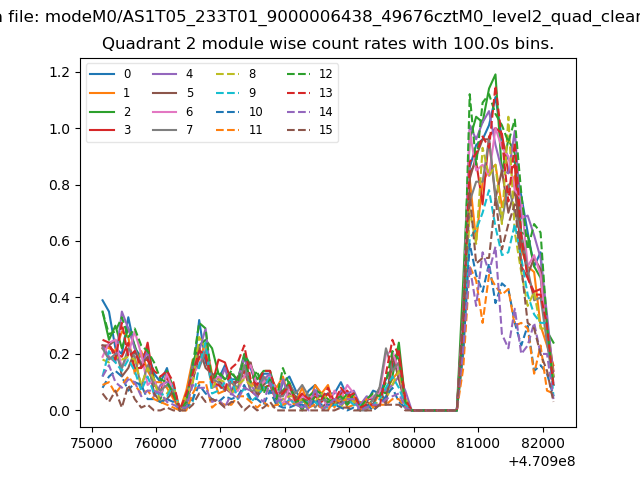
| Module-wise count rates for Quadrant B Data is divided into 100 sec bins |
 |
 |
| Module-wise count rates for Quadrant C Data is divided into 100 sec bins |
 |
 |
| Module-wise count rates for Quadrant D Data is divided into 100 sec bins |
 |
 |
| Parameter | Plot |
|---|---|
| CZT HV Monitor | 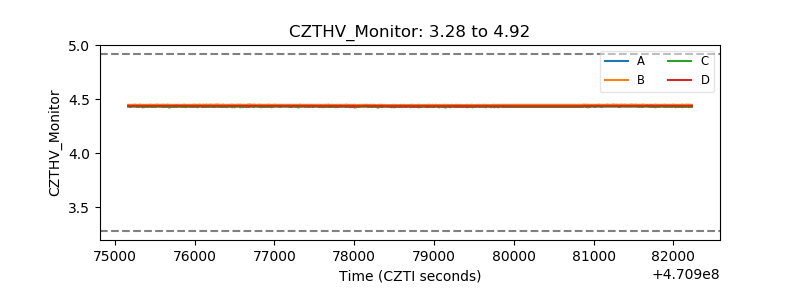 |
| D_VDD | 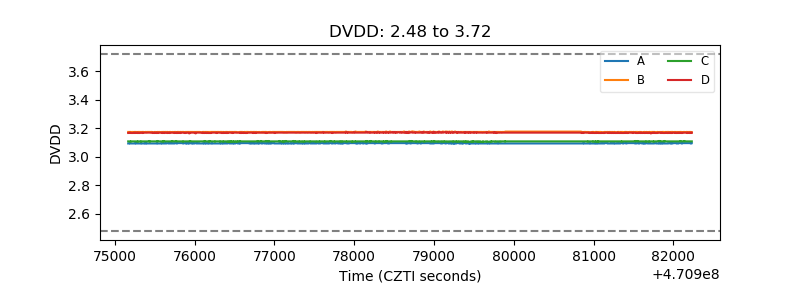 |
| Temperature 1 | 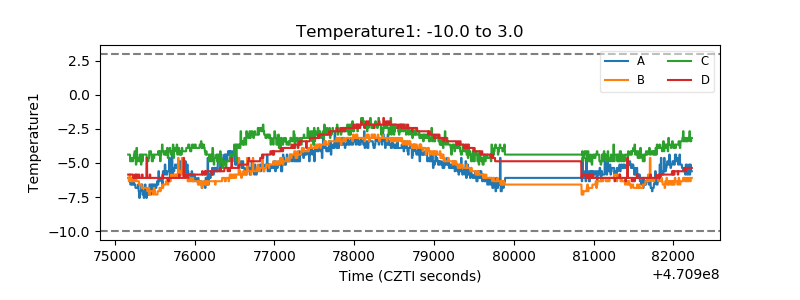 |
| Veto HV Monitor | 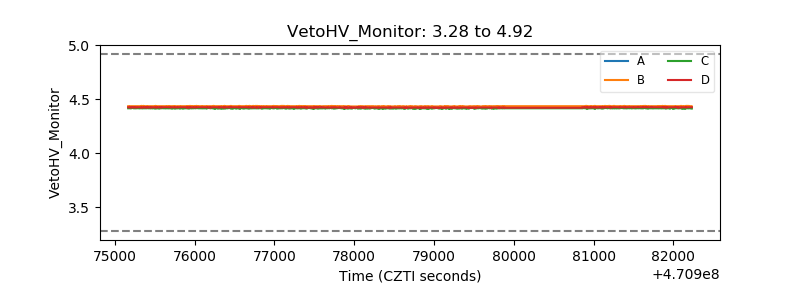 |
| Veto LLD | 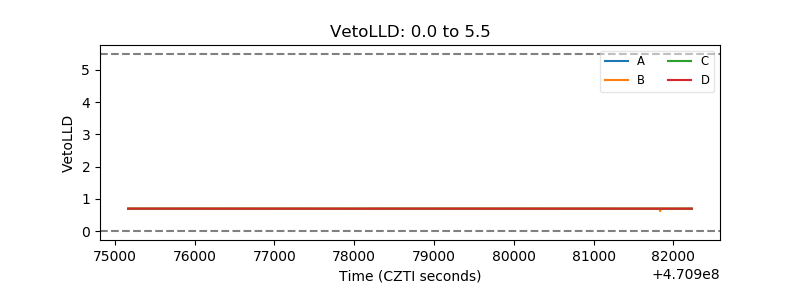 |
| Alpha Counter | 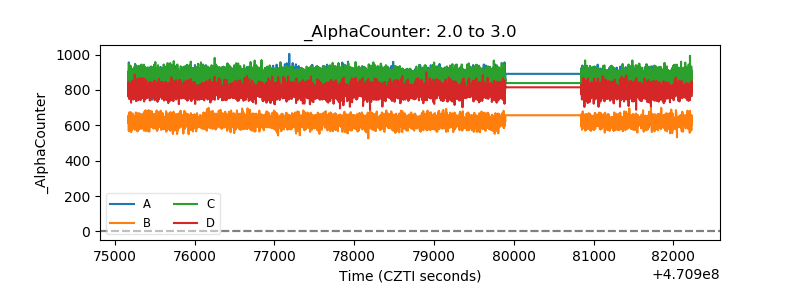 |
| _CPM_Rate | 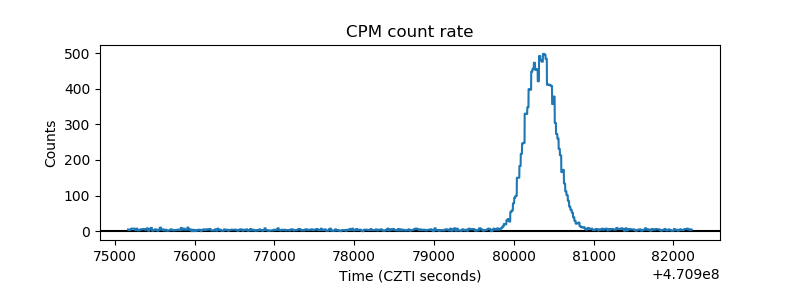 |
| CZT Counter | 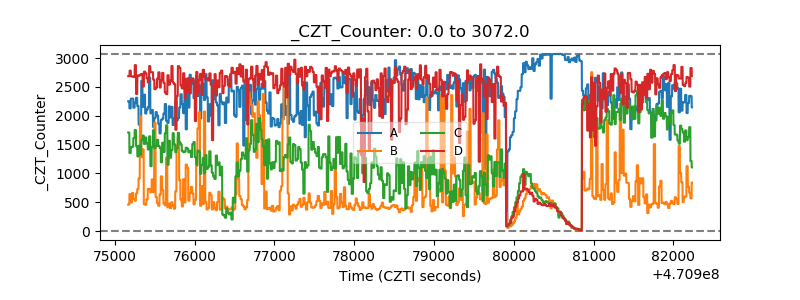 |
| +2.5 Volts monitor | 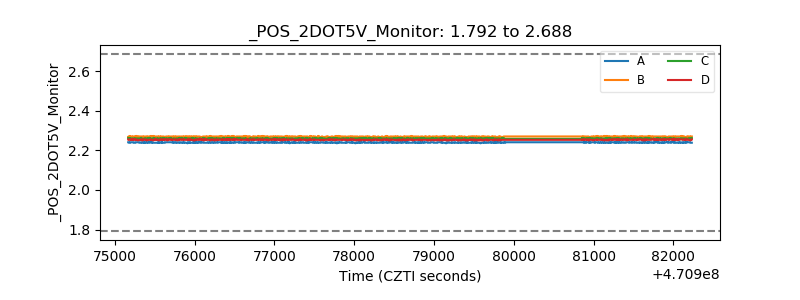 |
| +5 Volts monitor | 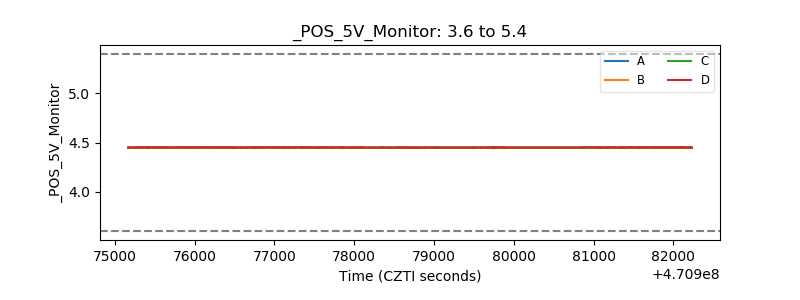 |
| _ROLL_ROT | 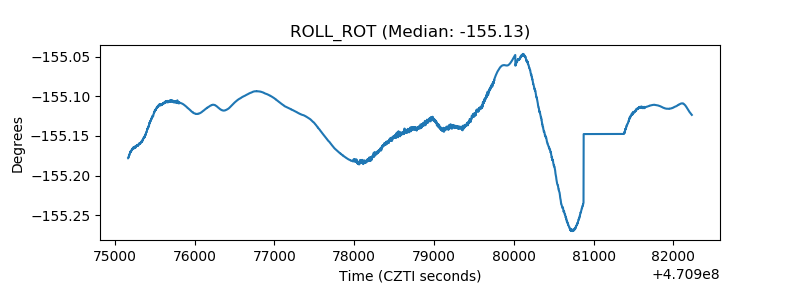 |
| _Roll_DEC | 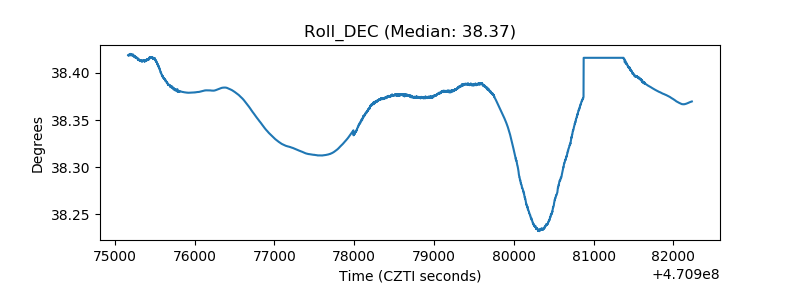 |
| _Roll_RA | 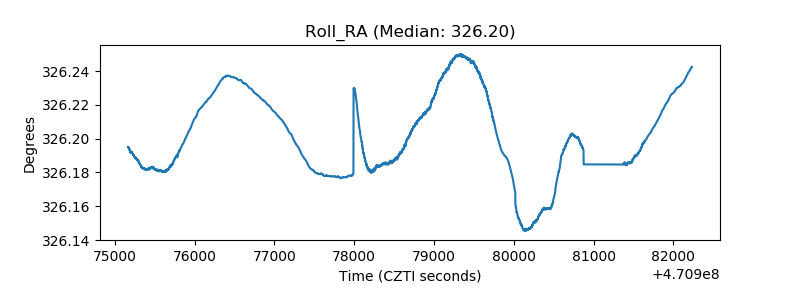 |
| Veto Counter | 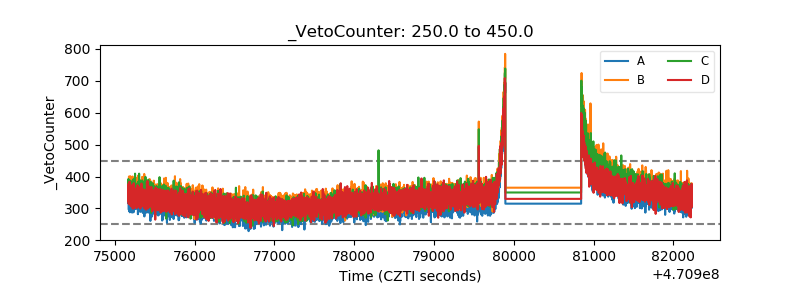 |