| Param | Original file | Final file |
|---|---|---|
| Filename | modeM0/AS1T05_233T01_9000006438_49678cztM0_level2.fits | modeM0/AS1T05_233T01_9000006438_49678cztM0_level2_quad_clean.evt |
| Size (bytes) | 1,127,030,400 | 52,087,680 |
| Size | 1.0 GB | 49.7 MB |
| Events in quadrant A | 14,477,748 | 328,912 |
| Events in quadrant B | 5,150,944 | 619,963 |
| Events in quadrant C | 6,155,680 | 6,459 |
| Events in quadrant D | 15,468,538 | 193,959 |
| Mode M9 | |||
|---|---|---|---|
| Quadrant | BADHDUFLAG | Total packets | Discarded packets |
| A | 0 | 11 | 0 |
| B | 0 | 11 | 0 |
| C | 0 | 11 | 0 |
| D | 0 | 11 | 0 |
| Mode SS | |||
|---|---|---|---|
| Quadrant | BADHDUFLAG | Total packets | Discarded packets |
| A | 0 | 120 | 0 |
| B | 0 | 120 | 0 |
| C | 0 | 120 | 0 |
| D | 0 | 120 | 0 |
| Mode M0 | |||
|---|---|---|---|
| Quadrant | BADHDUFLAG | Total packets | Discarded packets |
| A | 0 | 47065 | 0 |
| B | 0 | 19386 | 0 |
| C | 0 | 22494 | 0 |
| D | 0 | 50108 | 0 |
| Quadrant | Total seconds | Saturated seconds | Saturation percentage |
|---|---|---|---|
| A | 6007 | 5537 | 92.175795% |
| B | 6008 | 630 | 10.486019% |
| C | 6008 | 6008 | 100.000000% |
| D | 6008 | 5948 | 99.001332% |
Noise dominated data is calculated using 1-second bins in cleaned event files. If a bin has >2000 counts, and if more than 50% of those come from <1% of pixels, then it is considered to be noise-dominated and hence unusable.
| Quadrant | # 1 sec bins | Bins with >0 counts | Bins with >2000 counts | High rate bins dominated by noise | Noise dominated (total time) | Noise dominated (detector-on time) | Marked lightcurve |
|---|---|---|---|---|---|---|---|
| A | 7077 | 6007 | 5144 | 5144 | 72.69% | 85.63% | 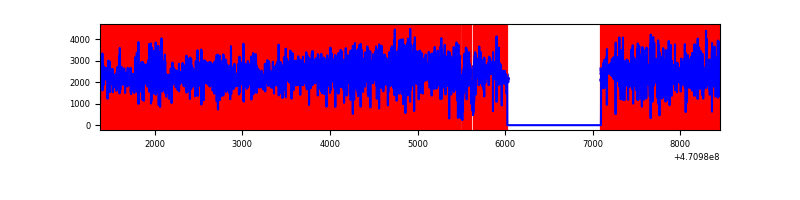 |
| B | 7078 | 6009 | 473 | 473 | 6.68% | 7.87% | 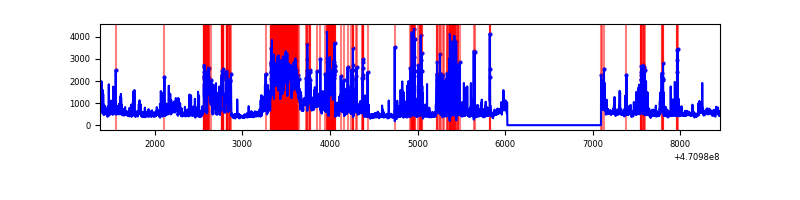 |
| C | 7077 | 6007 | 445 | 445 | 6.29% | 7.41% | 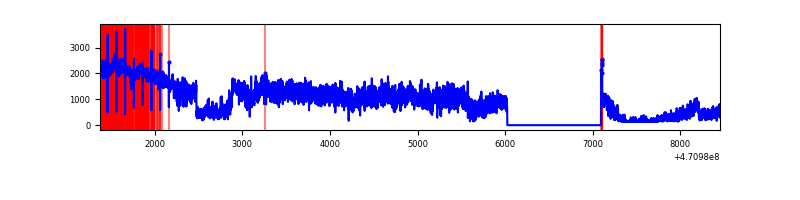 |
| D | 7078 | 6008 | 5455 | 5455 | 77.07% | 90.80% | 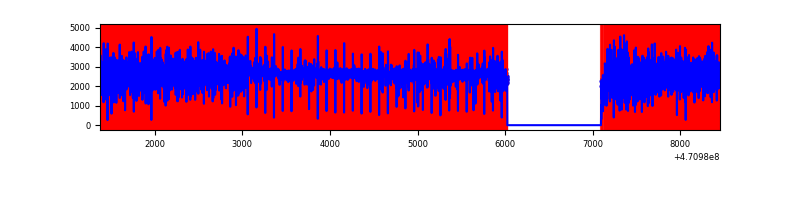 |
Top three noisy pixels from each quadrant. If the there are fewer than three noisy pixels in the level2.evt file, extra rows are filled as -1
| Pixel properties | Quadrant properties | ||||||
|---|---|---|---|---|---|---|---|
| Quadrant | DetID | PixID | Counts | Sigma | Mean | Median | Sigma |
| A | 10 | 83 | 5431357 | 47861.12 | 388 | 376 | 113.5 |
| A | 7 | 64 | 2119815 | 18677.79 | 388 | 376 | 113.5 |
| A | 12 | 50 | 1875965 | 16528.83 | 388 | 376 | 113.5 |
| B | 10 | 16 | 1375843 | 10168.02 | 636 | 615 | 135.3 |
| B | 7 | 0 | 367642 | 2713.69 | 636 | 615 | 135.3 |
| B | 4 | 206 | 262752 | 1938.16 | 636 | 615 | 135.3 |
| C | 15 | 190 | 1638110 | 91689.94 | 25 | 23 | 17.9 |
| C | 15 | 181 | 1411442 | 79002.47 | 25 | 23 | 17.9 |
| C | 15 | 180 | 782944 | 43823.05 | 25 | 23 | 17.9 |
| D | 15 | 40 | 4040261 | 45110.91 | 250 | 239 | 89.6 |
| D | 15 | 184 | 1801518 | 20113.09 | 250 | 239 | 89.6 |
| D | 12 | 191 | 1253405 | 13992.86 | 250 | 239 | 89.6 |
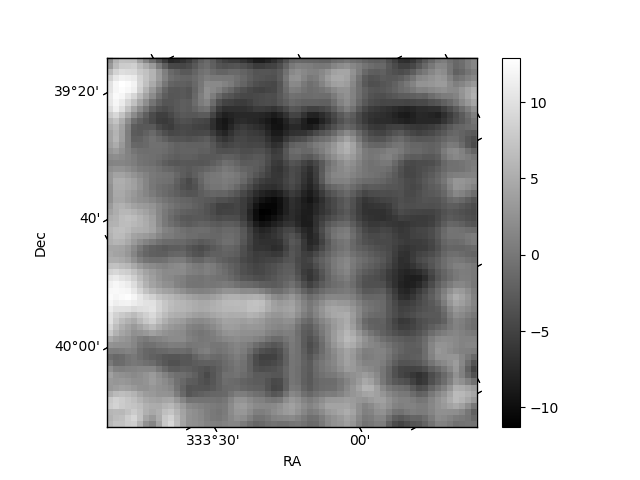
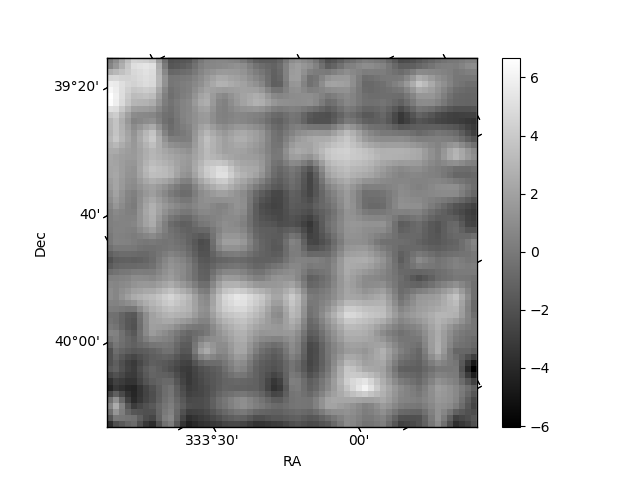
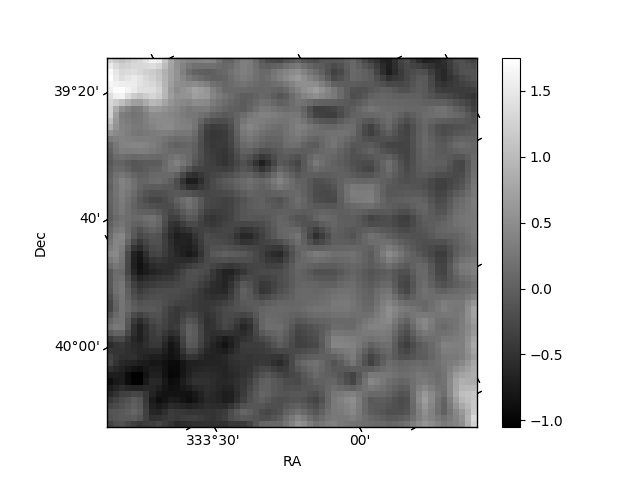
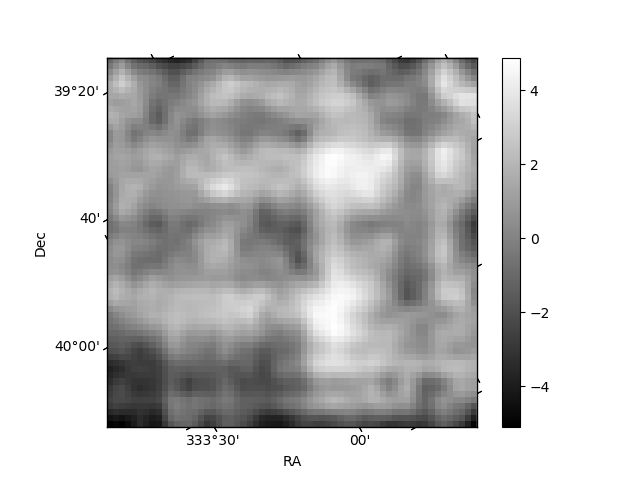
Histogram calculated using DETX and DETY for each event in the final _common_clean file
| Quadrant A | 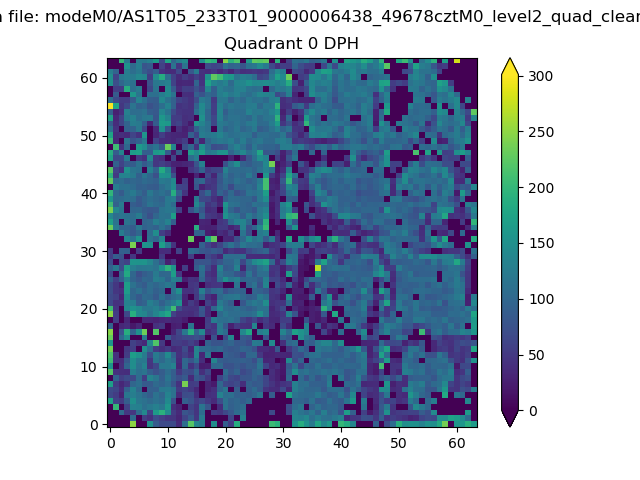 |
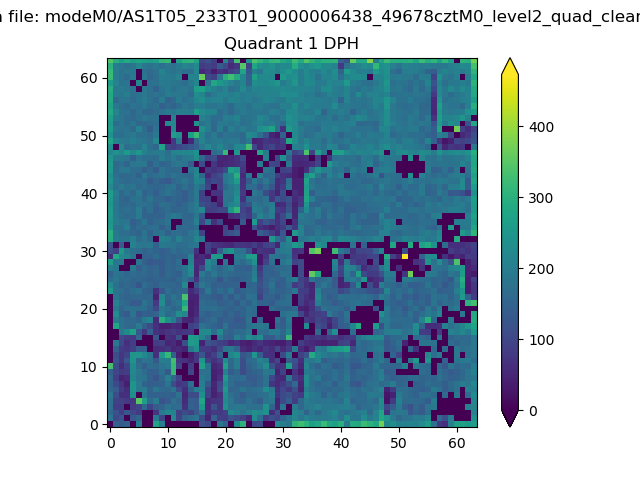 |
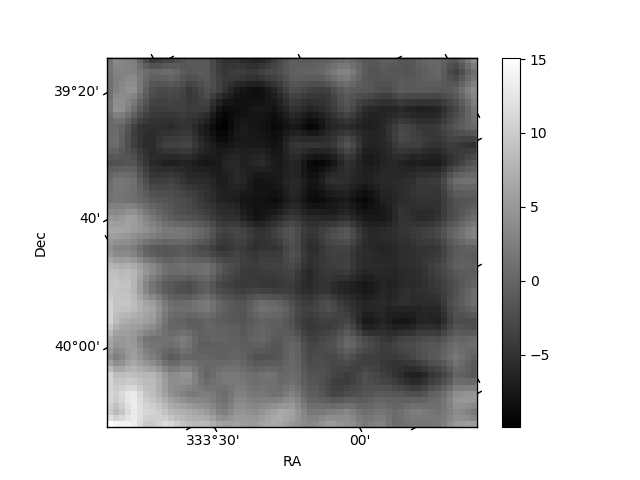
Quadrant B |
|---|---|---|---|
| Quadrant D | 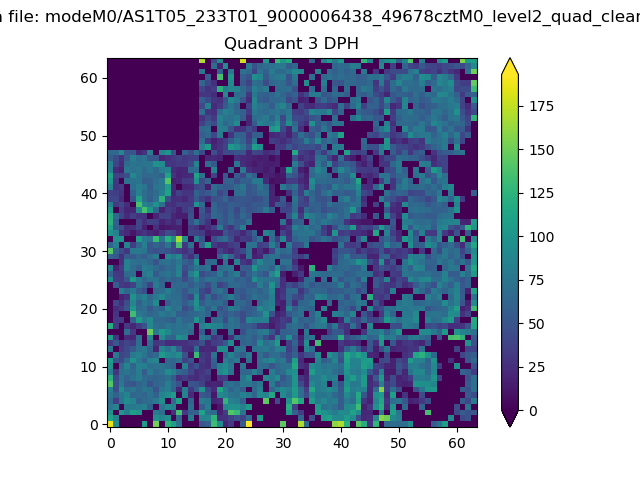 |
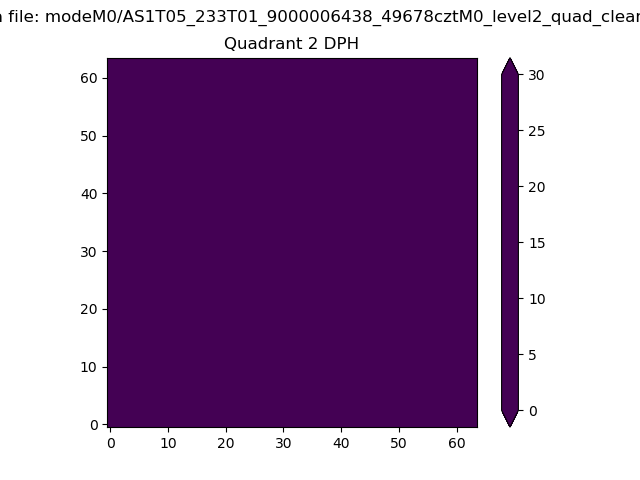 |
Quadrant C |
| Plot type | Count rate plots | Images |
|---|---|---|
| Comparison with Poisson distribution Blue bars denote a histogram of data divided into 1 sec bins. Red curve is a Poisson curve with rate = median count rate of data. |
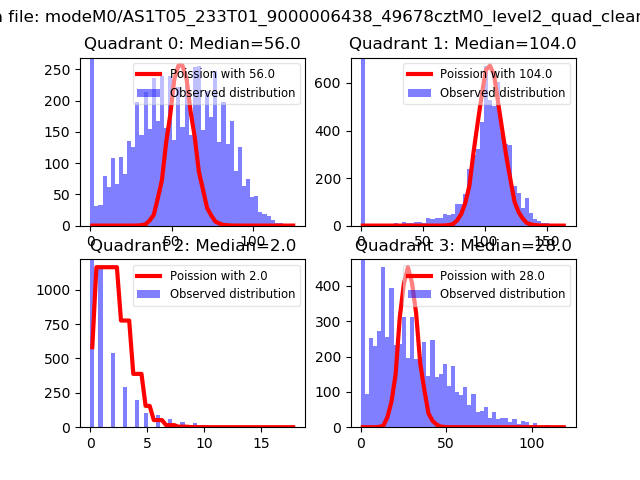 |
 |
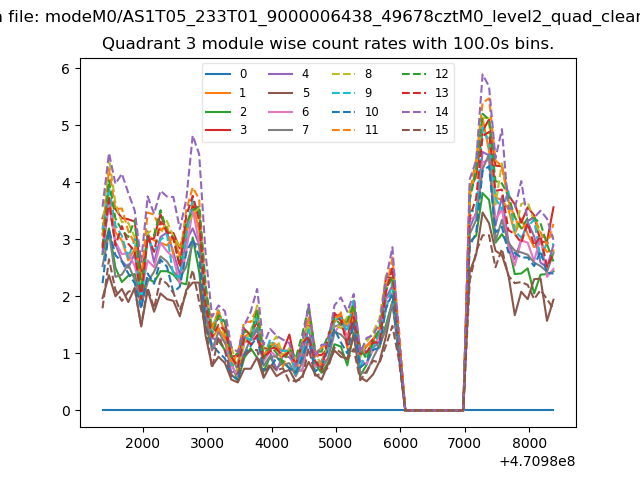
| Quadrant-wise count rates Data is divided into 100 sec bins |
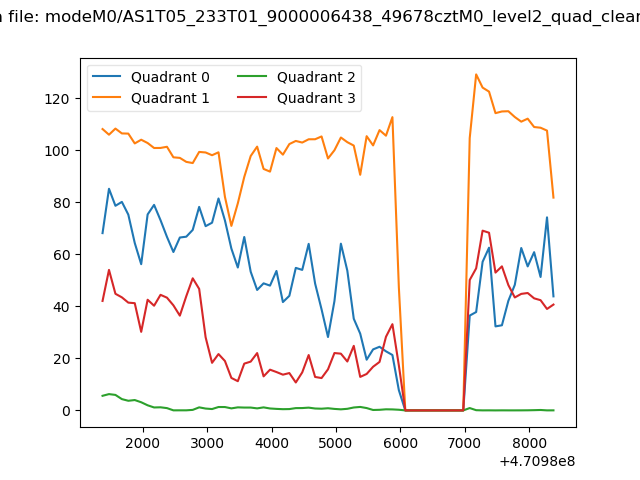 |
|
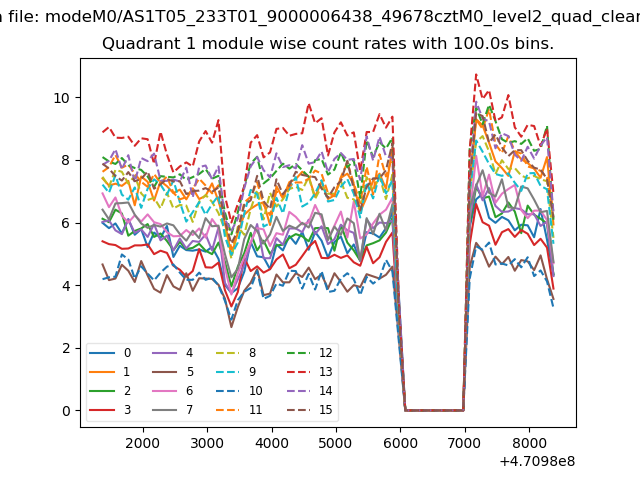
| Module-wise count rates for Quadrant A Data is divided into 100 sec bins |
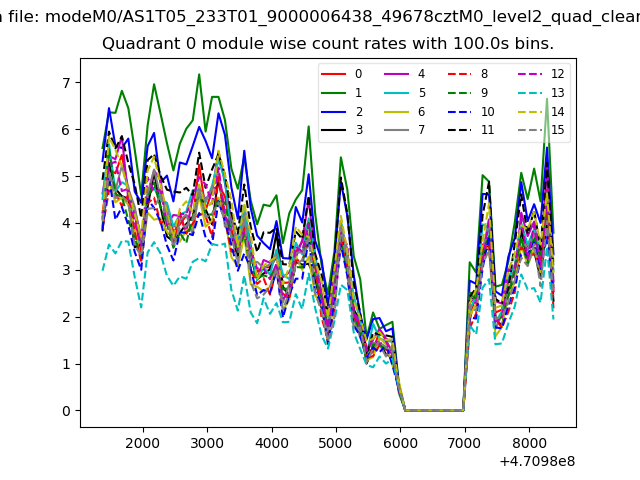 |
 |
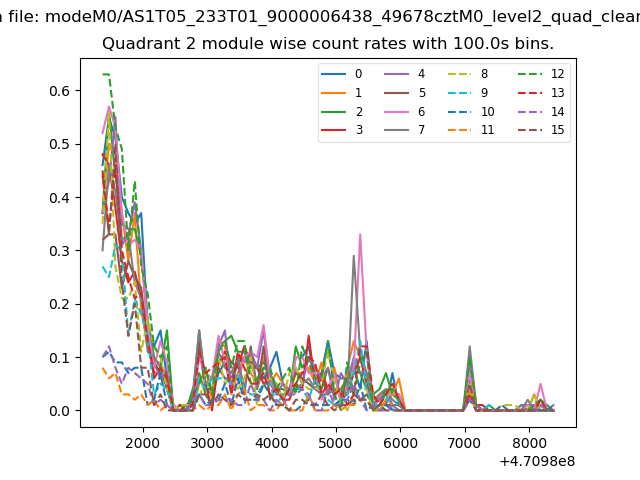
| Module-wise count rates for Quadrant B Data is divided into 100 sec bins |
 |
 |
| Module-wise count rates for Quadrant C Data is divided into 100 sec bins |
 |
 |
| Module-wise count rates for Quadrant D Data is divided into 100 sec bins |
 |
 |
| Parameter | Plot |
|---|---|
| CZT HV Monitor | 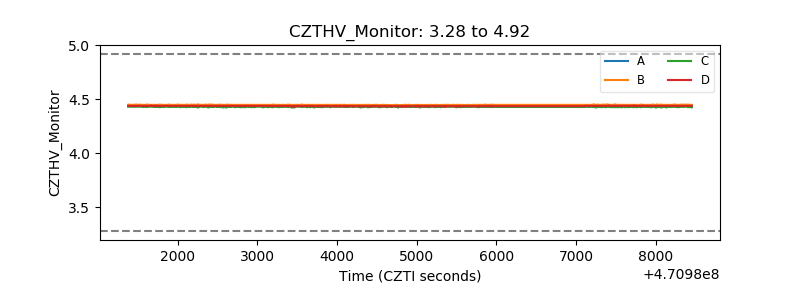 |
| D_VDD | 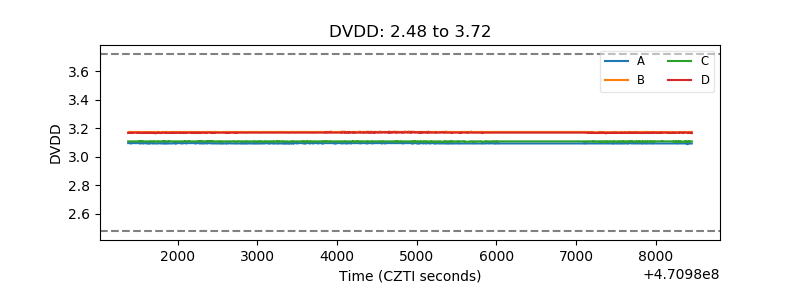 |
| Temperature 1 | 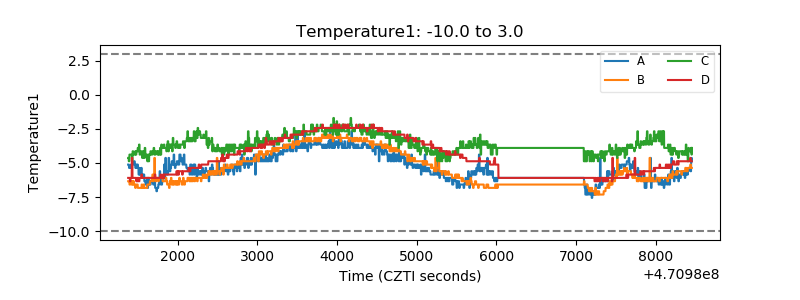 |
| Veto HV Monitor | 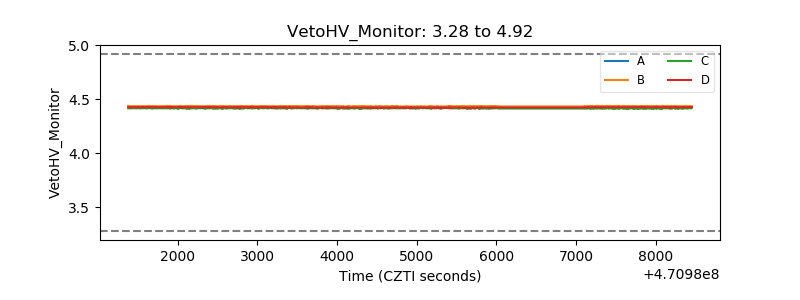 |
| Veto LLD | 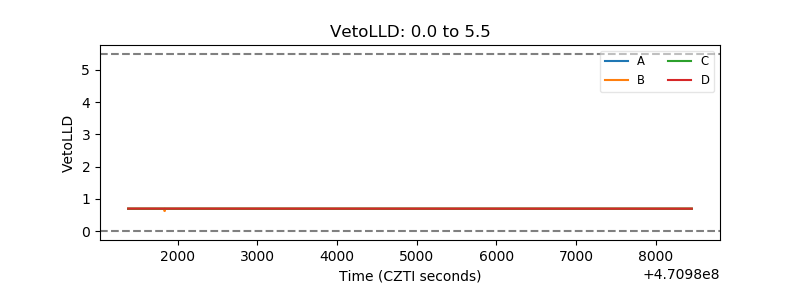 |
| Alpha Counter | 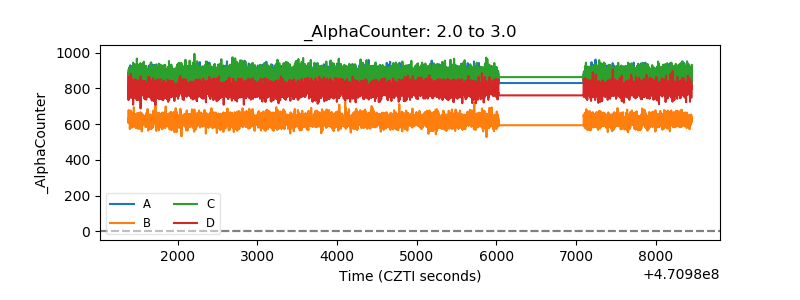 |
| _CPM_Rate | 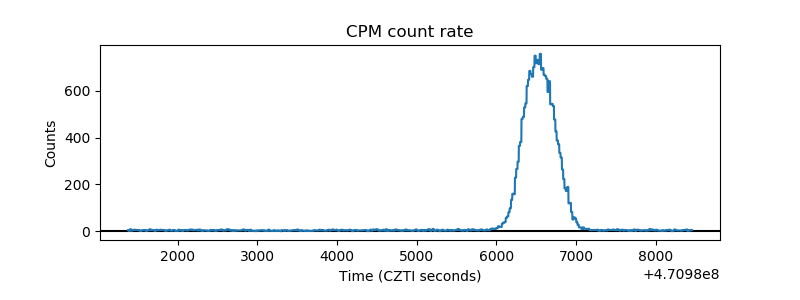 |
| CZT Counter | 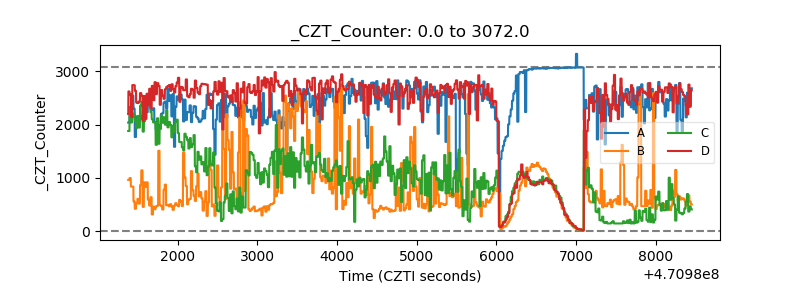 |
| +2.5 Volts monitor | 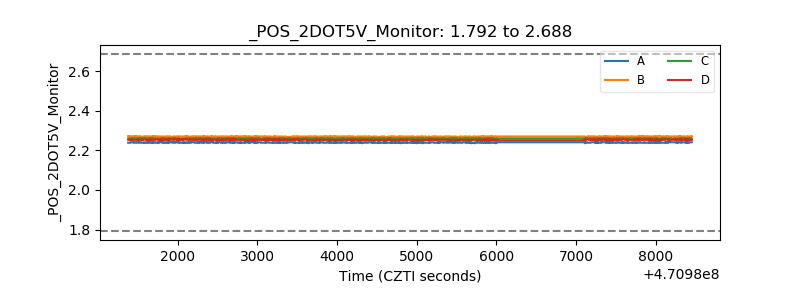 |
| +5 Volts monitor | 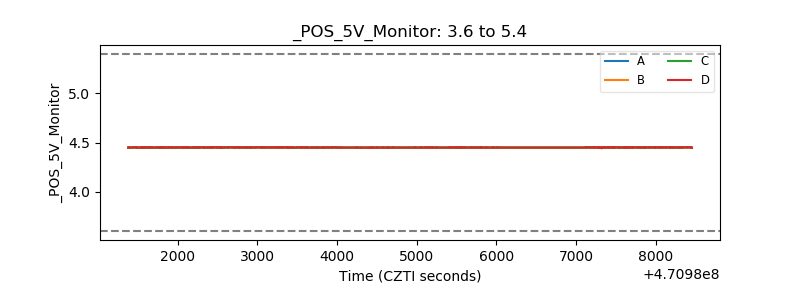 |
| _ROLL_ROT | 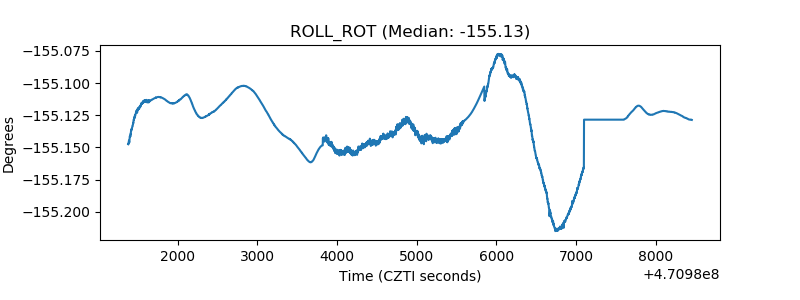 |
| _Roll_DEC | 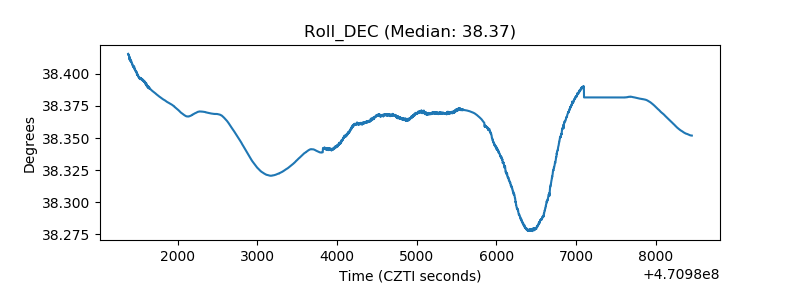 |
| _Roll_RA | 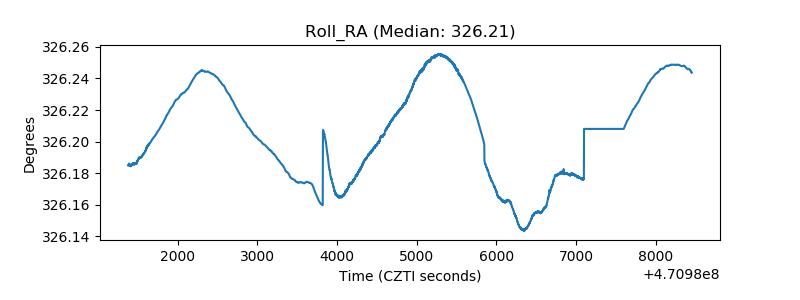 |
| Veto Counter | 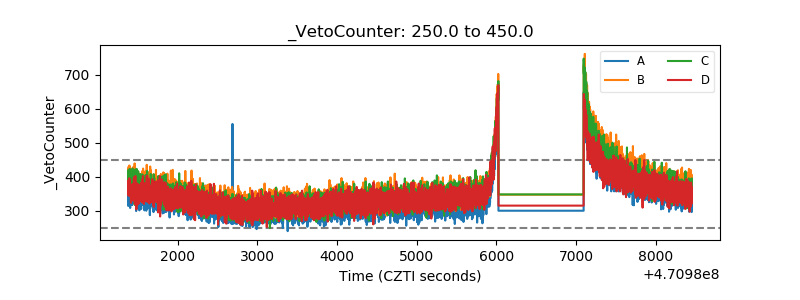 |