| Param | Original file | Final file |
|---|---|---|
| Filename | modeM0/AS1T05_233T01_9000006438_49679cztM0_level2.fits | modeM0/AS1T05_233T01_9000006438_49679cztM0_level2_quad_clean.evt |
| Size (bytes) | 1,090,768,320 | 51,451,200 |
| Size | 1.0 GB | 49.1 MB |
| Events in quadrant A | 14,535,619 | 295,038 |
| Events in quadrant B | 4,110,279 | 644,518 |
| Events in quadrant C | 6,100,738 | 5,133 |
| Events in quadrant D | 15,164,027 | 185,369 |
| Mode M9 | |||
|---|---|---|---|
| Quadrant | BADHDUFLAG | Total packets | Discarded packets |
| A | 0 | 11 | 0 |
| B | 0 | 11 | 0 |
| C | 0 | 11 | 0 |
| D | 0 | 11 | 0 |
| Mode SS | |||
|---|---|---|---|
| Quadrant | BADHDUFLAG | Total packets | Discarded packets |
| A | 0 | 122 | 0 |
| B | 0 | 122 | 0 |
| C | 0 | 122 | 0 |
| D | 0 | 122 | 0 |
| Mode M0 | |||
|---|---|---|---|
| Quadrant | BADHDUFLAG | Total packets | Discarded packets |
| A | 0 | 47269 | 0 |
| B | 0 | 16309 | 0 |
| C | 0 | 22362 | 0 |
| D | 0 | 49194 | 0 |
| Quadrant | Total seconds | Saturated seconds | Saturation percentage |
|---|---|---|---|
| A | 6001 | 5666 | 94.417597% |
| B | 6001 | 447 | 7.448759% |
| C | 6000 | 6000 | 100.000000% |
| D | 6001 | 5837 | 97.267122% |
Noise dominated data is calculated using 1-second bins in cleaned event files. If a bin has >2000 counts, and if more than 50% of those come from <1% of pixels, then it is considered to be noise-dominated and hence unusable.
| Quadrant | # 1 sec bins | Bins with >0 counts | Bins with >2000 counts | High rate bins dominated by noise | Noise dominated (total time) | Noise dominated (detector-on time) | Marked lightcurve |
|---|---|---|---|---|---|---|---|
| A | 7081 | 6001 | 5079 | 5079 | 71.73% | 84.64% | 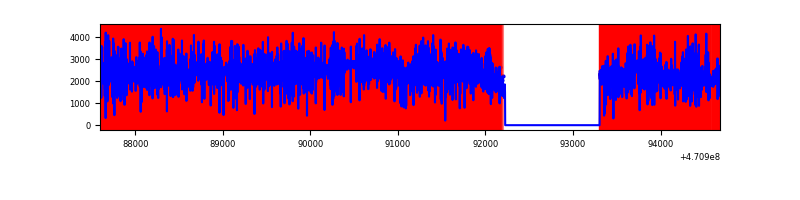 |
| B | 7081 | 6002 | 222 | 222 | 3.14% | 3.70% | 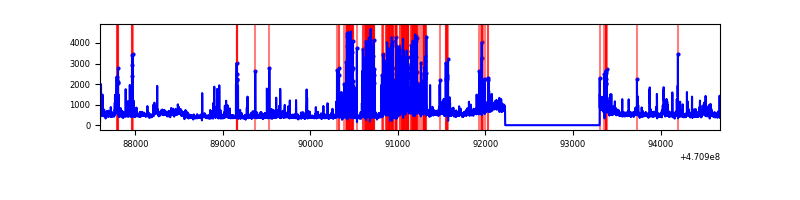 |
| C | 7079 | 5999 | 161 | 161 | 2.27% | 2.68% | 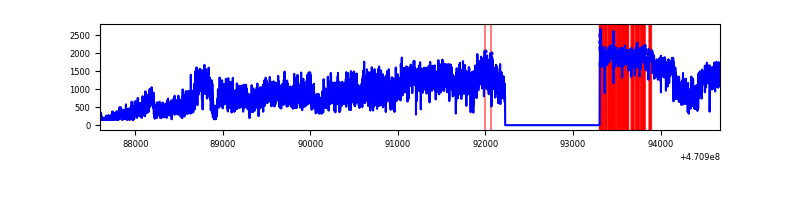 |
| D | 7080 | 6000 | 5405 | 5405 | 76.34% | 90.08% | 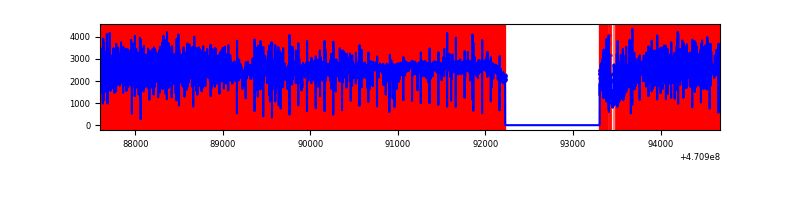 |
Top three noisy pixels from each quadrant. If the there are fewer than three noisy pixels in the level2.evt file, extra rows are filled as -1
| Pixel properties | Quadrant properties | ||||||
|---|---|---|---|---|---|---|---|
| Quadrant | DetID | PixID | Counts | Sigma | Mean | Median | Sigma |
| A | 10 | 83 | 4807934 | 42416.69 | 359 | 344 | 113.3 |
| A | 7 | 64 | 3565353 | 31453.57 | 359 | 344 | 113.3 |
| A | 3 | 130 | 1169599 | 10316.17 | 359 | 344 | 113.3 |
| B | 3 | 232 | 623359 | 4464.78 | 653 | 633 | 139.5 |
| B | 4 | 206 | 264938 | 1895.0 | 653 | 633 | 139.5 |
| B | 5 | 173 | 234869 | 1679.41 | 653 | 633 | 139.5 |
| C | 15 | 190 | 1066431 | 59166.76 | 25 | 23 | 18.0 |
| C | 15 | 181 | 900857 | 49980.34 | 25 | 23 | 18.0 |
| C | 15 | 180 | 884354 | 49064.71 | 25 | 23 | 18.0 |
| D | 15 | 40 | 3123925 | 33096.92 | 243 | 230 | 94.4 |
| D | 15 | 184 | 1975550 | 20929.38 | 243 | 230 | 94.4 |
| D | 12 | 191 | 1704062 | 18052.85 | 243 | 230 | 94.4 |
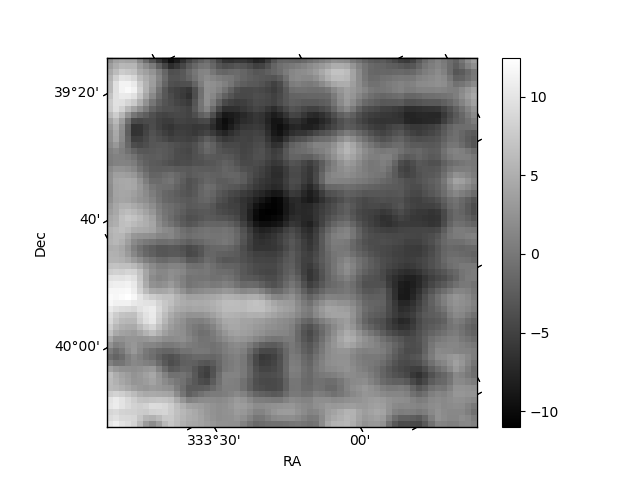
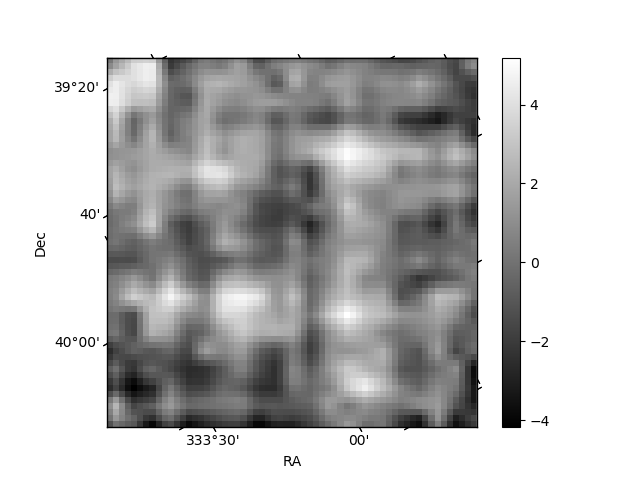
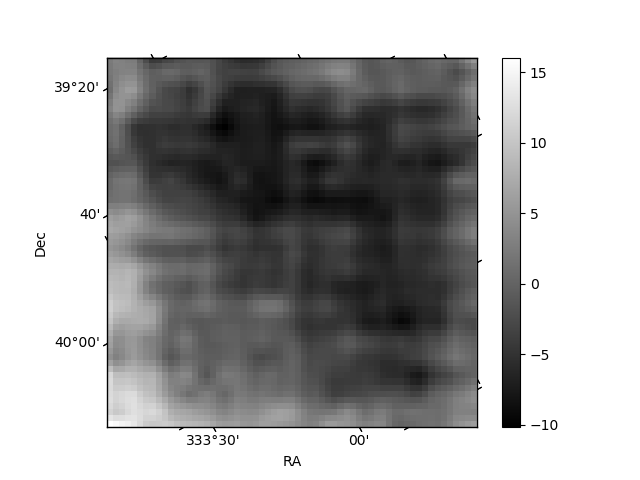
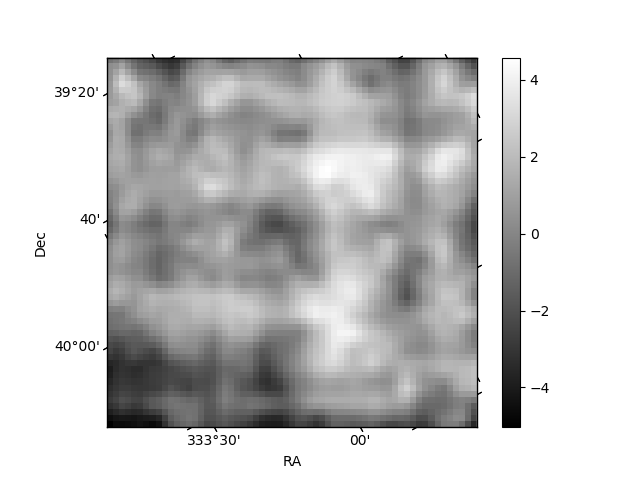
Histogram calculated using DETX and DETY for each event in the final _common_clean file
| Quadrant A | 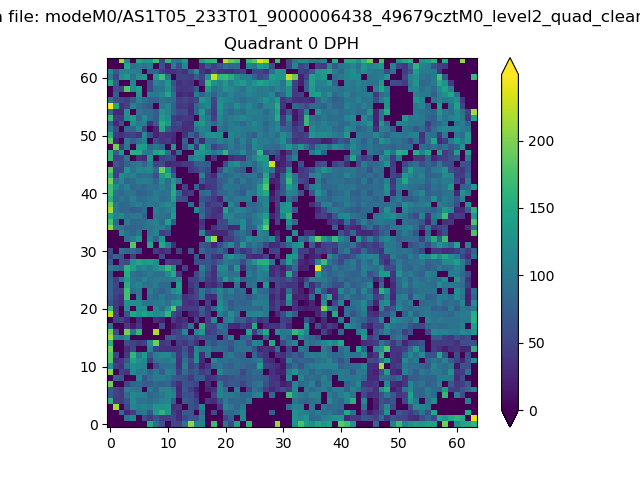 |
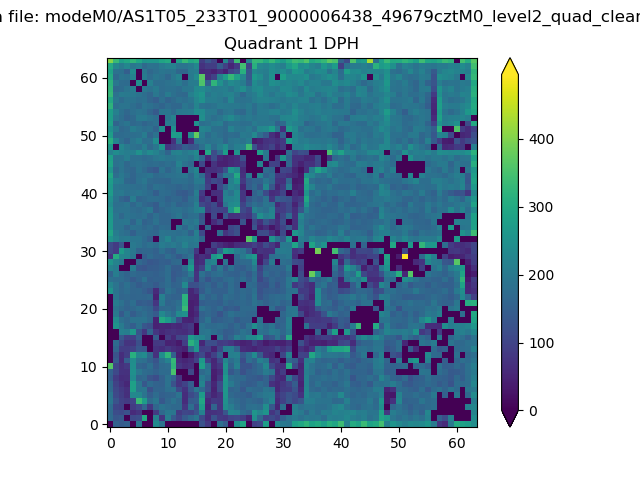 |
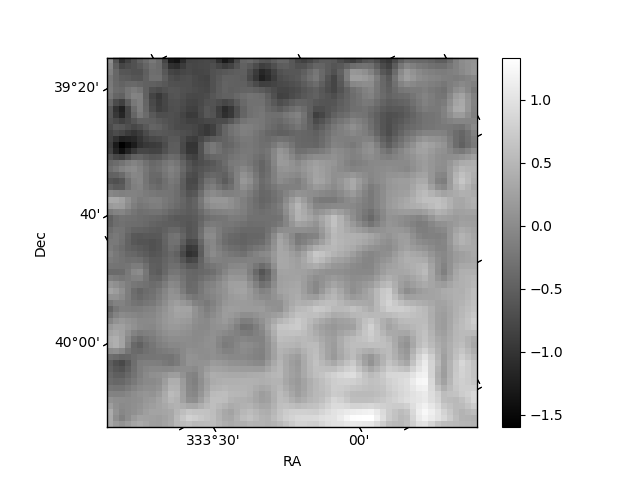
Quadrant B |
|---|---|---|---|
| Quadrant D | 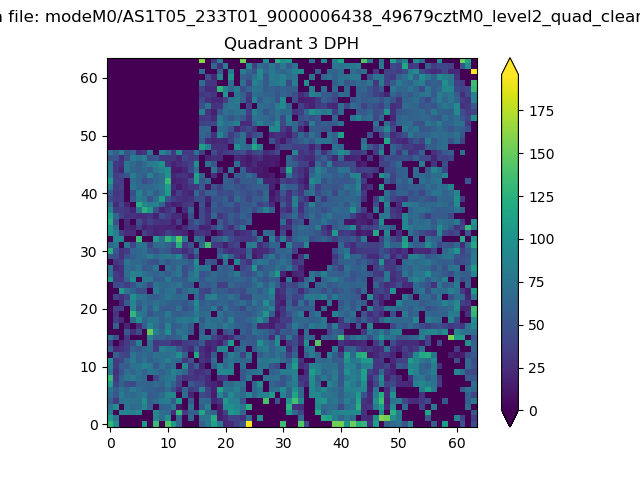 |
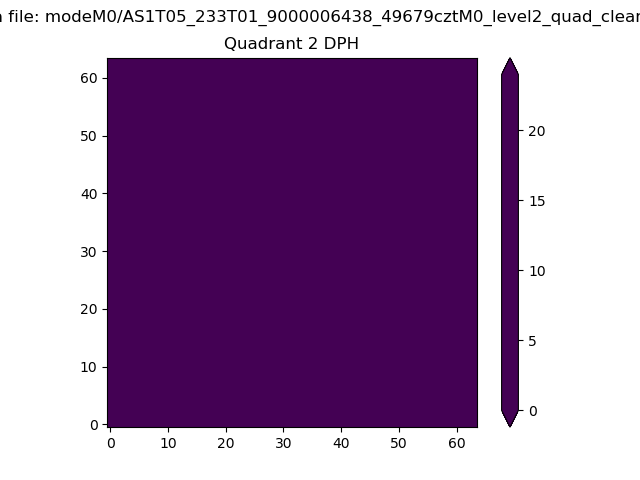 |
Quadrant C |
| Plot type | Count rate plots | Images |
|---|---|---|
| Comparison with Poisson distribution Blue bars denote a histogram of data divided into 1 sec bins. Red curve is a Poisson curve with rate = median count rate of data. |
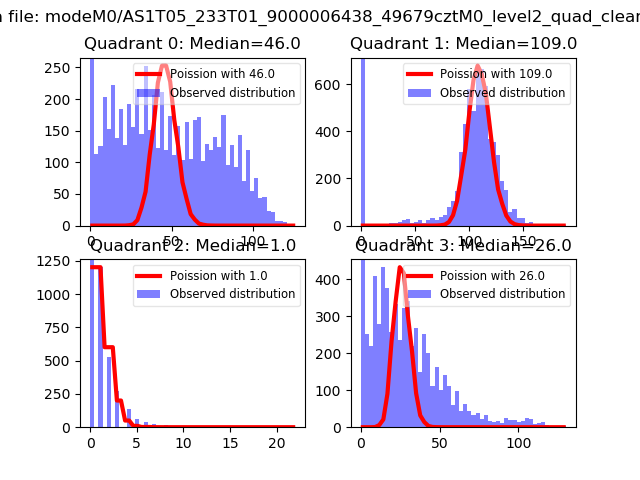 |
 |
| Quadrant-wise count rates Data is divided into 100 sec bins |
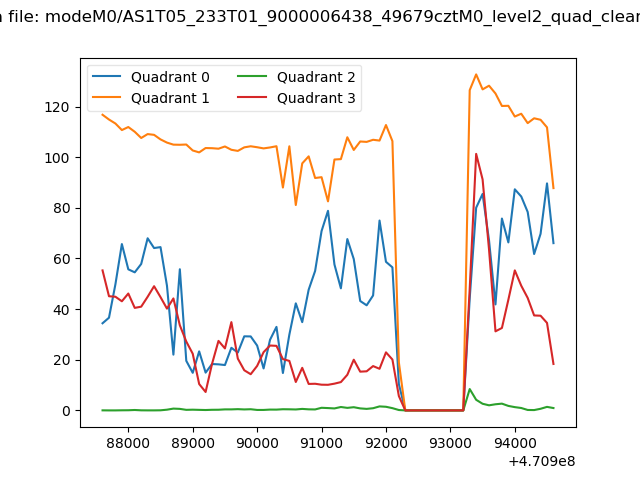 |
|
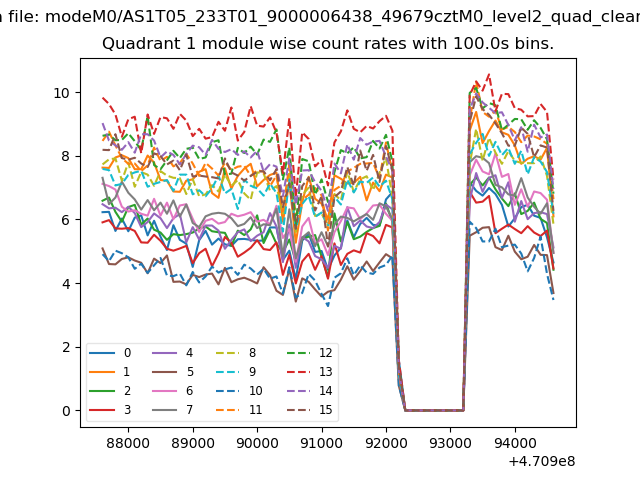
| Module-wise count rates for Quadrant A Data is divided into 100 sec bins |
 |
 |
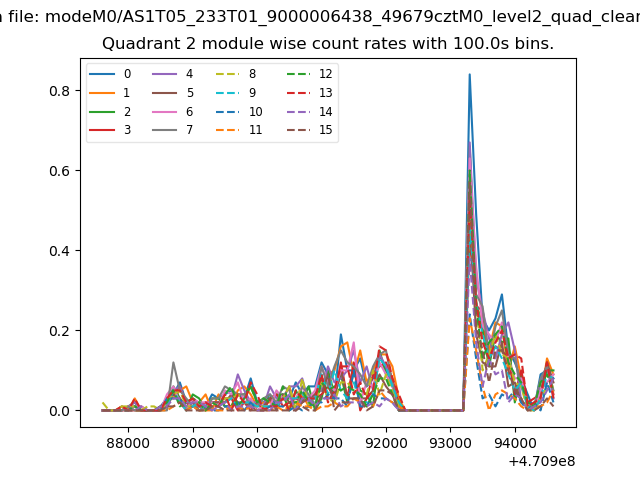
| Module-wise count rates for Quadrant B Data is divided into 100 sec bins |
 |
 |
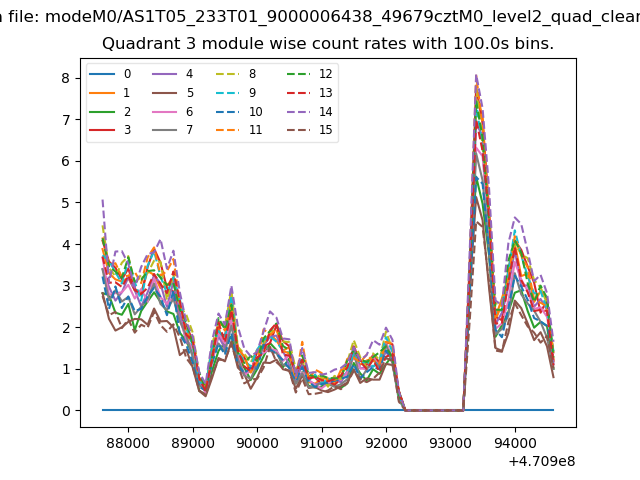
| Module-wise count rates for Quadrant C Data is divided into 100 sec bins |
 |
 |
| Module-wise count rates for Quadrant D Data is divided into 100 sec bins |
 |
 |
| Parameter | Plot |
|---|---|
| CZT HV Monitor | 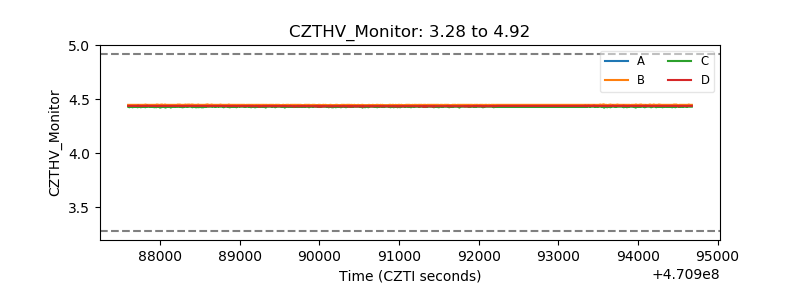 |
| D_VDD | 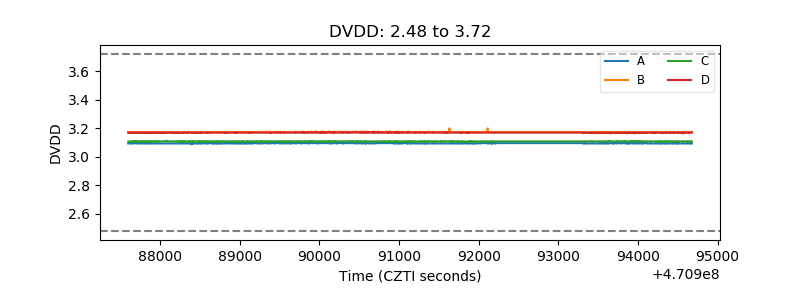 |
| Temperature 1 | 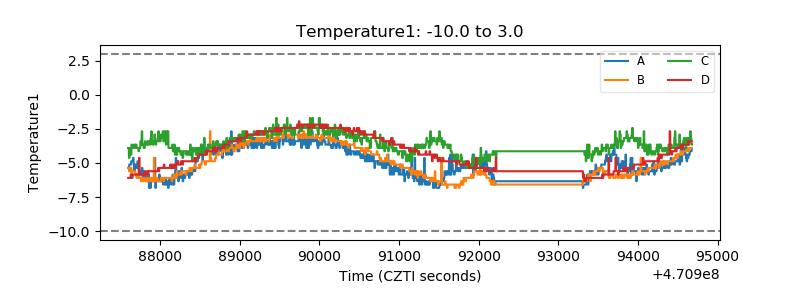 |
| Veto HV Monitor | 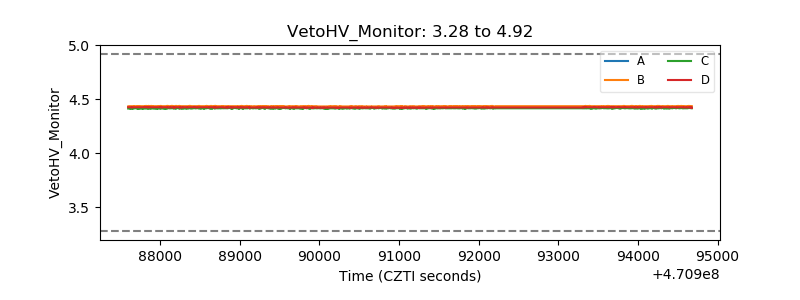 |
| Veto LLD | 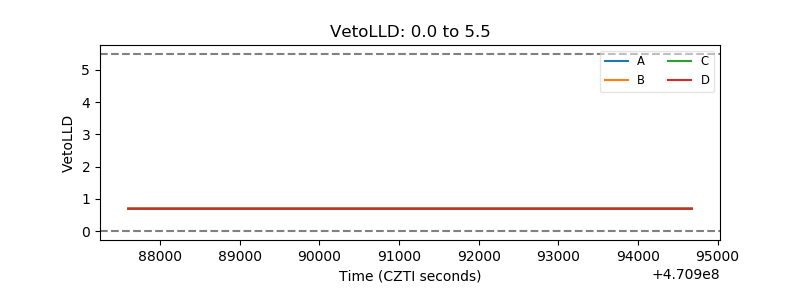 |
| Alpha Counter | 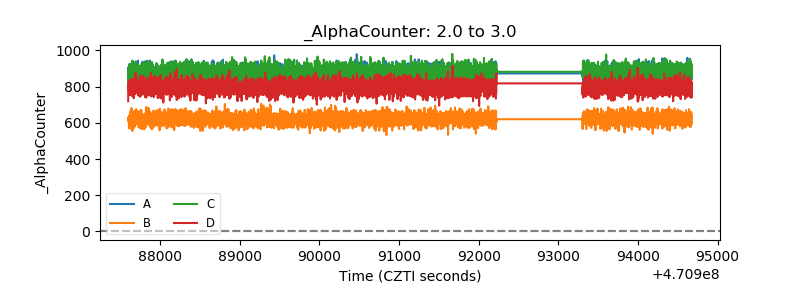 |
| _CPM_Rate | 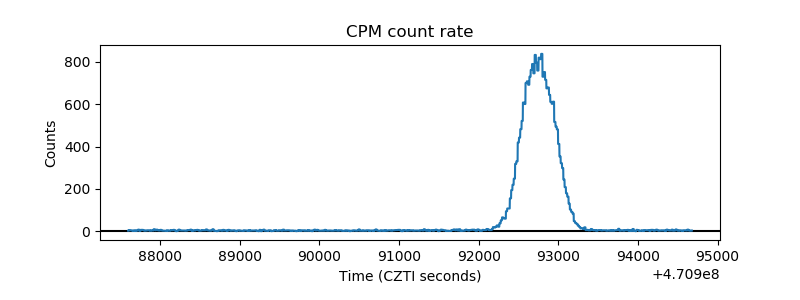 |
| CZT Counter | 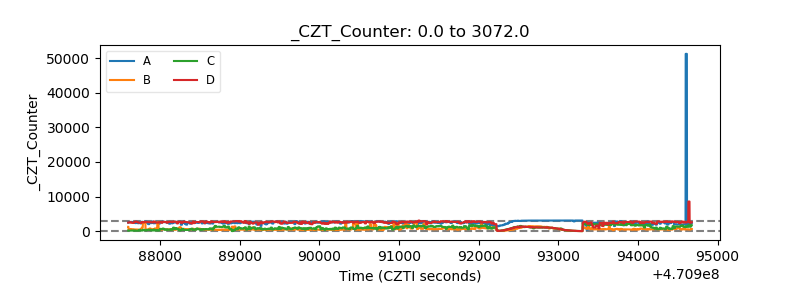 |
| +2.5 Volts monitor | 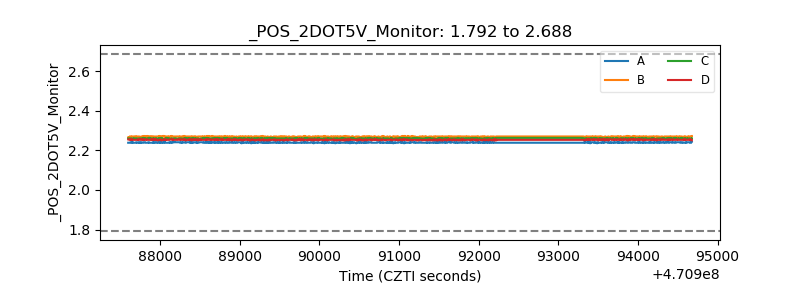 |
| +5 Volts monitor |  |
| _ROLL_ROT | 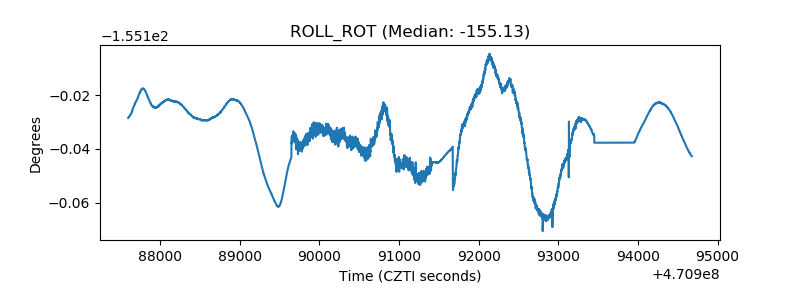 |
| _Roll_DEC | 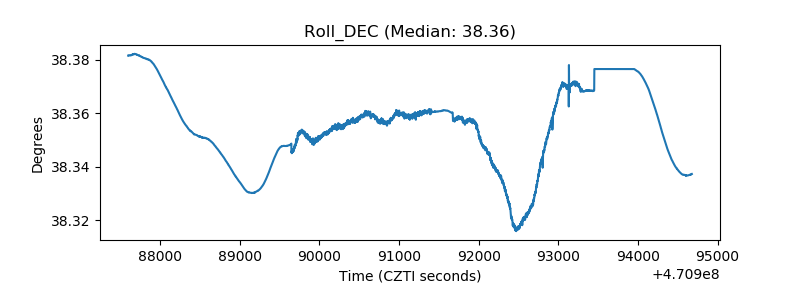 |
| _Roll_RA | 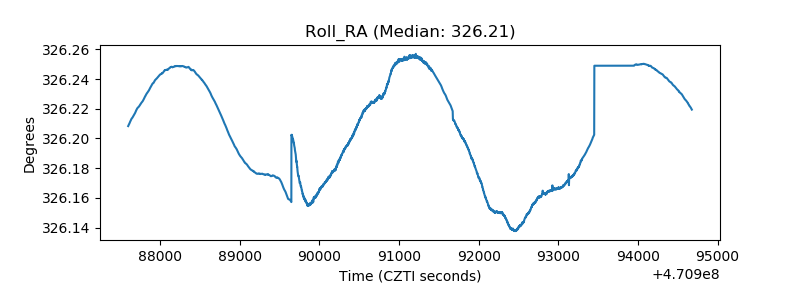 |
| Veto Counter | 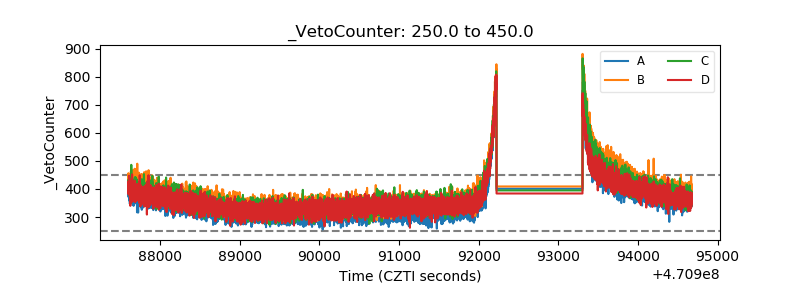 |