| Param | Original file | Final file |
|---|---|---|
| Filename | modeM0/AS1T05_233T01_9000006438_49680cztM0_level2.fits | modeM0/AS1T05_233T01_9000006438_49680cztM0_level2_quad_clean.evt |
| Size (bytes) | 1,148,440,320 | 51,871,680 |
| Size | 1.1 GB | 49.5 MB |
| Events in quadrant A | 14,241,925 | 332,370 |
| Events in quadrant B | 4,601,801 | 631,931 |
| Events in quadrant C | 7,945,662 | 25,021 |
| Events in quadrant D | 15,265,721 | 160,935 |
| Mode M9 | |||
|---|---|---|---|
| Quadrant | BADHDUFLAG | Total packets | Discarded packets |
| A | 0 | 11 | 0 |
| B | 0 | 11 | 0 |
| C | 0 | 11 | 0 |
| D | 0 | 11 | 0 |
| Mode SS | |||
|---|---|---|---|
| Quadrant | BADHDUFLAG | Total packets | Discarded packets |
| A | 0 | 120 | 0 |
| B | 0 | 120 | 0 |
| C | 0 | 120 | 0 |
| D | 0 | 120 | 0 |
| Mode M0 | |||
|---|---|---|---|
| Quadrant | BADHDUFLAG | Total packets | Discarded packets |
| A | 0 | 46290 | 0 |
| B | 0 | 17738 | 0 |
| C | 0 | 27772 | 0 |
| D | 0 | 49428 | 0 |
| Quadrant | Total seconds | Saturated seconds | Saturation percentage |
|---|---|---|---|
| A | 5895 | 5382 | 91.297710% |
| B | 5896 | 568 | 9.633650% |
| C | 5896 | 5896 | 100.000000% |
| D | 5896 | 5856 | 99.321574% |
Noise dominated data is calculated using 1-second bins in cleaned event files. If a bin has >2000 counts, and if more than 50% of those come from <1% of pixels, then it is considered to be noise-dominated and hence unusable.
| Quadrant | # 1 sec bins | Bins with >0 counts | Bins with >2000 counts | High rate bins dominated by noise | Noise dominated (total time) | Noise dominated (detector-on time) | Marked lightcurve |
|---|---|---|---|---|---|---|---|
| A | 6970 | 5895 | 4968 | 4968 | 71.28% | 84.27% | 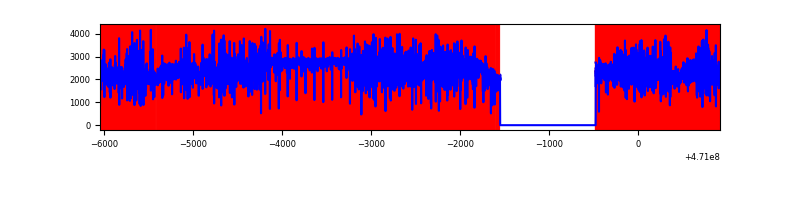 |
| B | 6971 | 5897 | 270 | 270 | 3.87% | 4.58% | 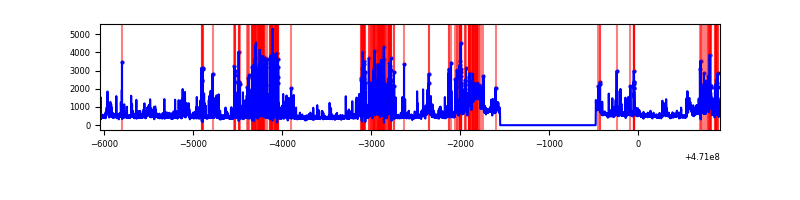 |
| C | 6970 | 5895 | 317 | 317 | 4.55% | 5.38% | 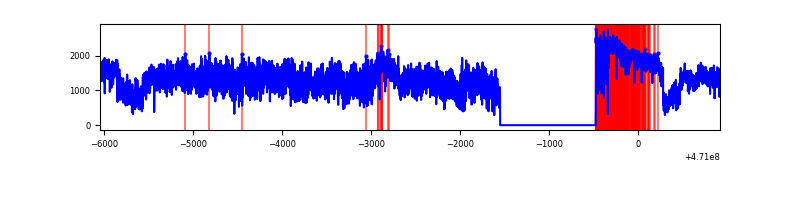 |
| D | 6970 | 5895 | 5564 | 5564 | 79.83% | 94.39% |  |
Top three noisy pixels from each quadrant. If the there are fewer than three noisy pixels in the level2.evt file, extra rows are filled as -1
| Pixel properties | Quadrant properties | ||||||
|---|---|---|---|---|---|---|---|
| Quadrant | DetID | PixID | Counts | Sigma | Mean | Median | Sigma |
| A | 10 | 83 | 5330649 | 47985.73 | 386 | 373 | 111.1 |
| A | 3 | 130 | 1793938 | 16146.54 | 386 | 373 | 111.1 |
| A | 7 | 64 | 1149642 | 10346.27 | 386 | 373 | 111.1 |
| B | 3 | 232 | 525169 | 3858.59 | 640 | 619 | 135.9 |
| B | 10 | 45 | 290653 | 2133.49 | 640 | 619 | 135.9 |
| B | 4 | 206 | 268533 | 1970.77 | 640 | 619 | 135.9 |
| C | 15 | 180 | 1347527 | 59035.79 | 43 | 41 | 22.8 |
| C | 15 | 190 | 1152151 | 50476.02 | 43 | 41 | 22.8 |
| C | 15 | 181 | 1071114 | 46925.64 | 43 | 41 | 22.8 |
| D | 15 | 40 | 3128643 | 35826.31 | 213 | 201 | 87.3 |
| D | 15 | 184 | 1520661 | 17412.01 | 213 | 201 | 87.3 |
| D | 7 | 60 | 1358993 | 15560.62 | 213 | 201 | 87.3 |
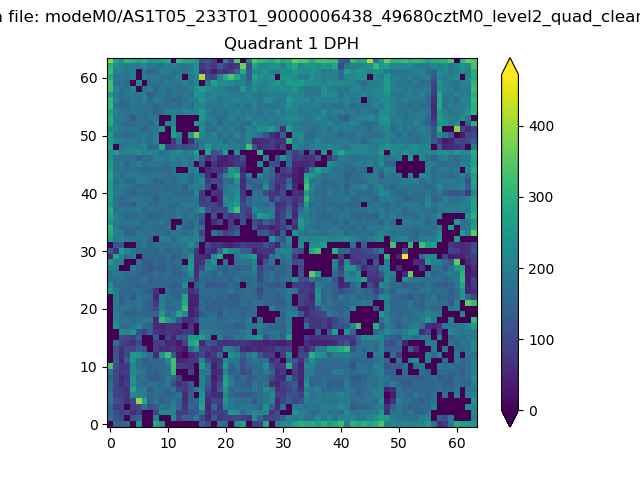
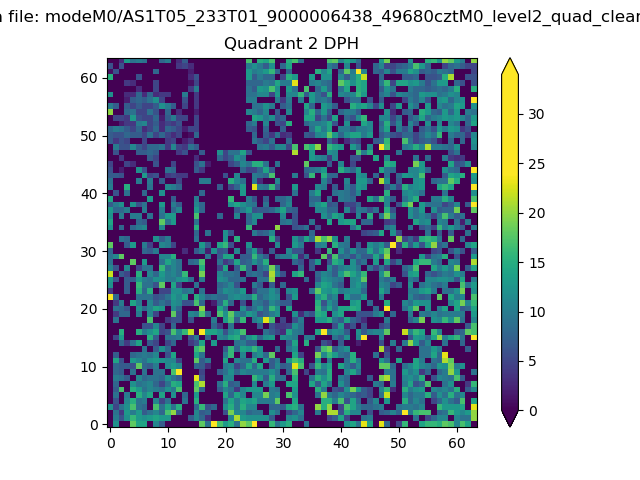
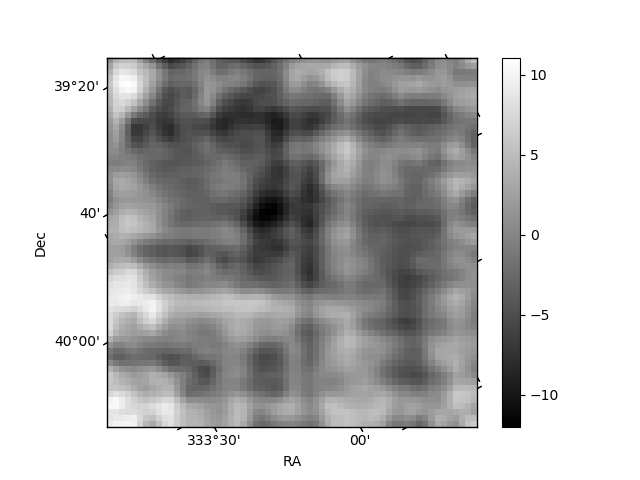
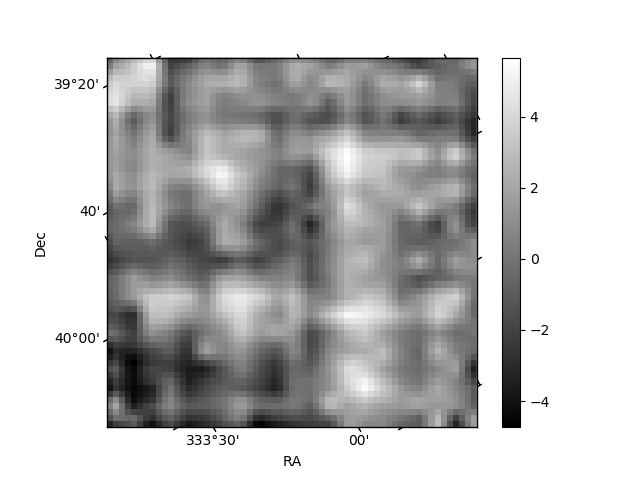
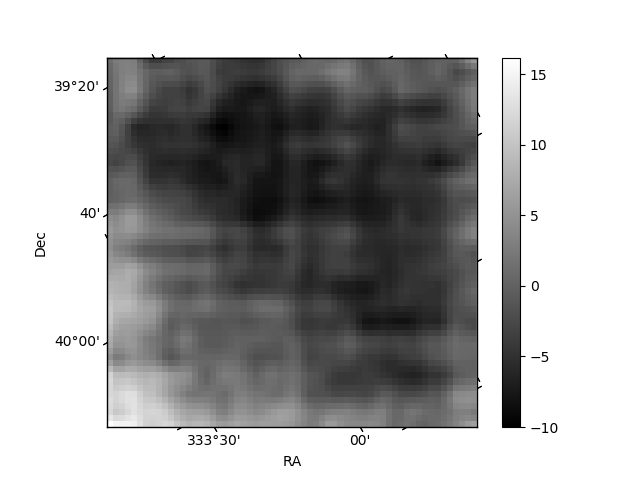
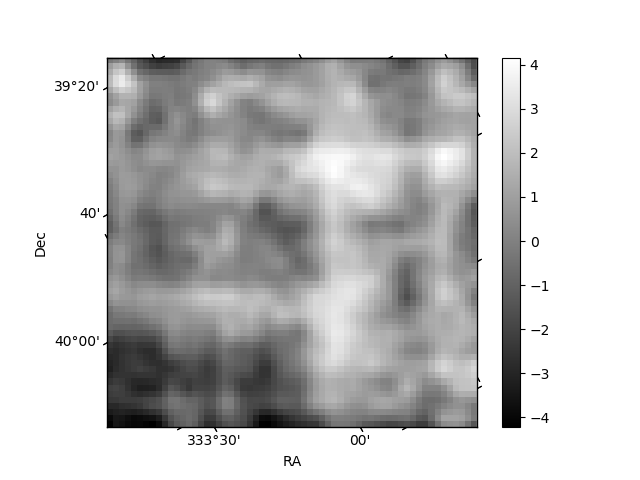
Histogram calculated using DETX and DETY for each event in the final _common_clean file
| Quadrant A | 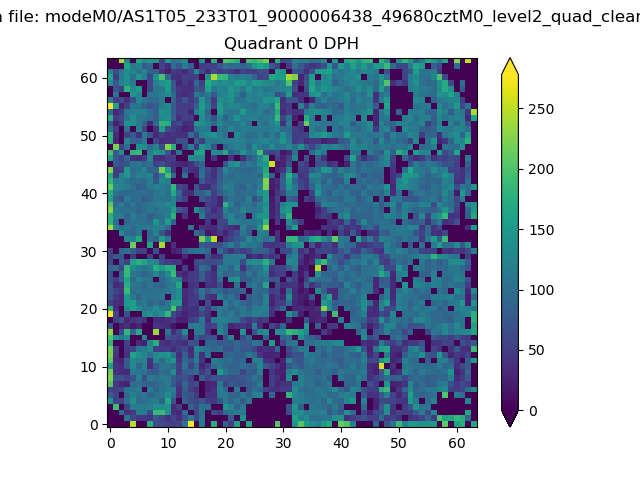 |
 |
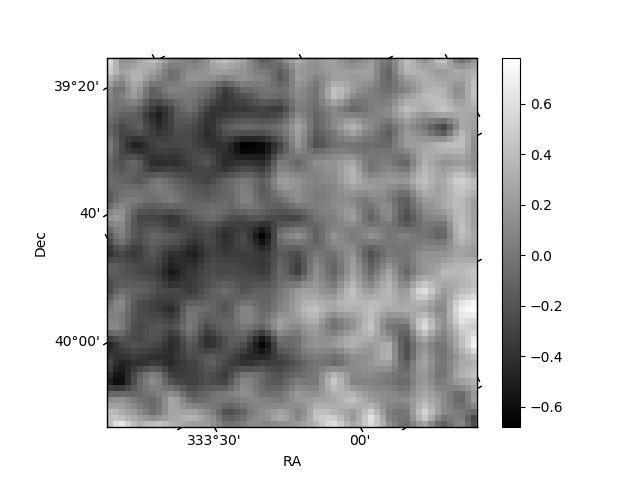
Quadrant B |
|---|---|---|---|
| Quadrant D | 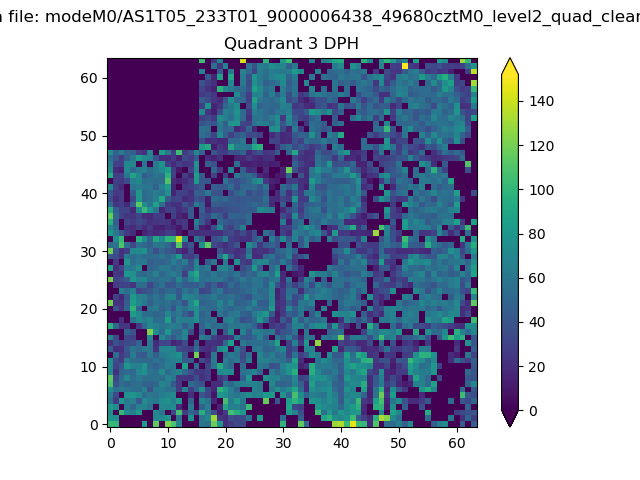 |
 |
Quadrant C |
| Plot type | Count rate plots | Images |
|---|---|---|
| Comparison with Poisson distribution Blue bars denote a histogram of data divided into 1 sec bins. Red curve is a Poisson curve with rate = median count rate of data. |
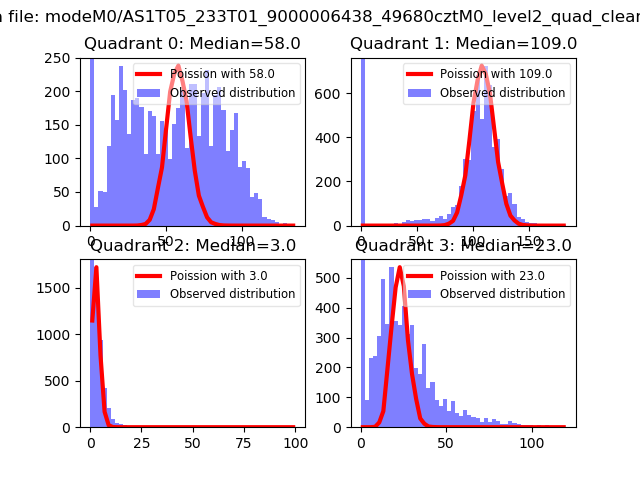 |
 |
| Quadrant-wise count rates Data is divided into 100 sec bins |
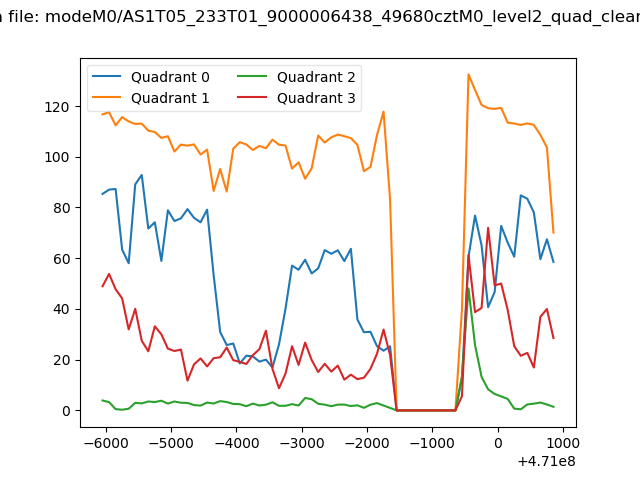 |
|
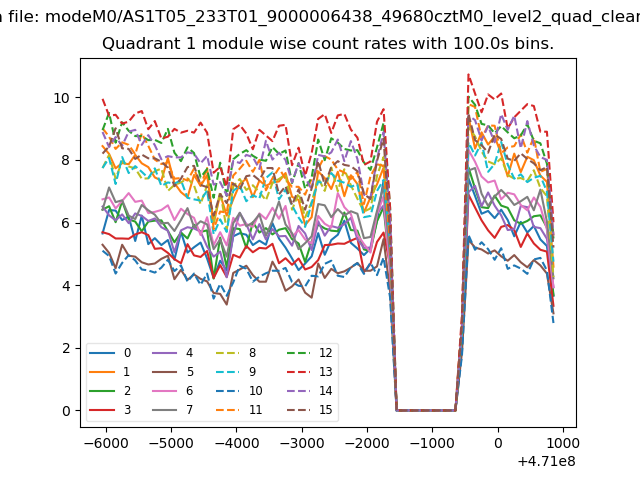
| Module-wise count rates for Quadrant A Data is divided into 100 sec bins |
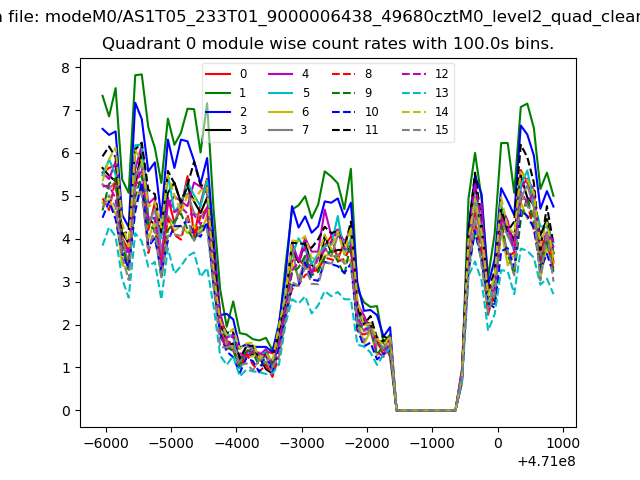 |
 |
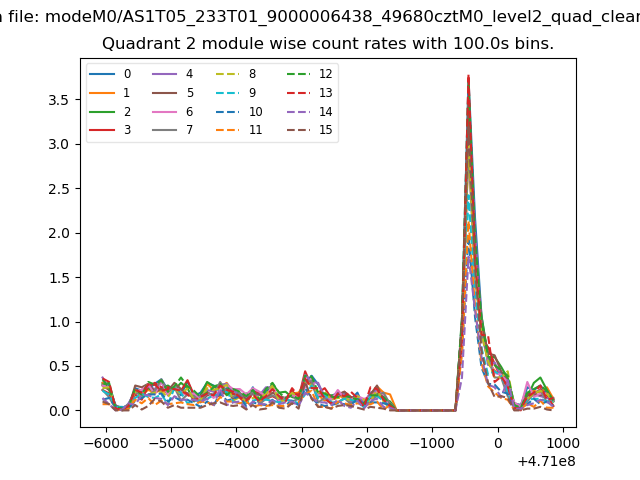
| Module-wise count rates for Quadrant B Data is divided into 100 sec bins |
 |
 |
| Module-wise count rates for Quadrant C Data is divided into 100 sec bins |
 |
 |
| Module-wise count rates for Quadrant D Data is divided into 100 sec bins |
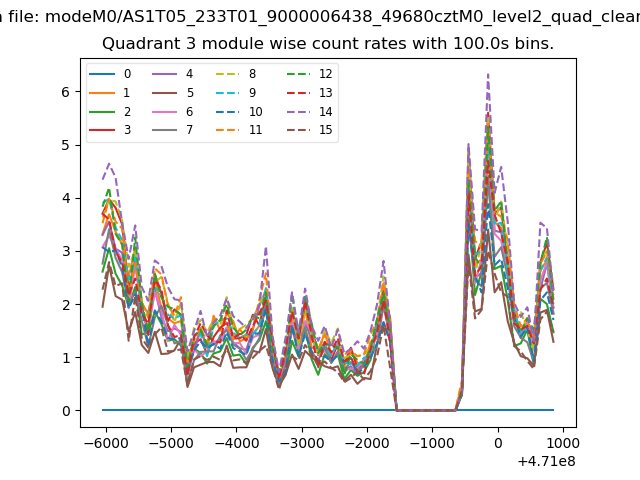 |
 |
| Parameter | Plot |
|---|---|
| CZT HV Monitor | 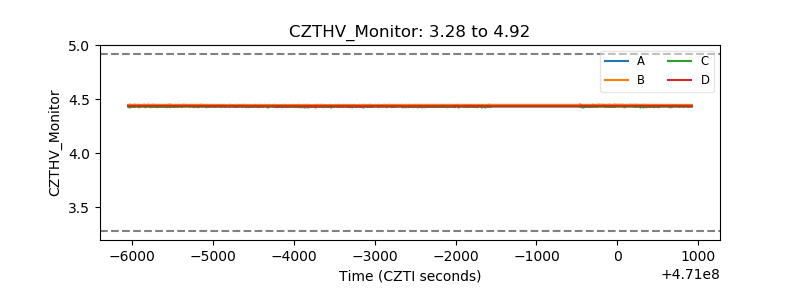 |
| D_VDD | 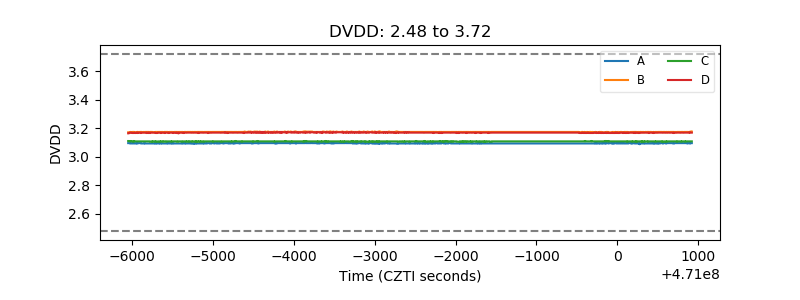 |
| Temperature 1 | 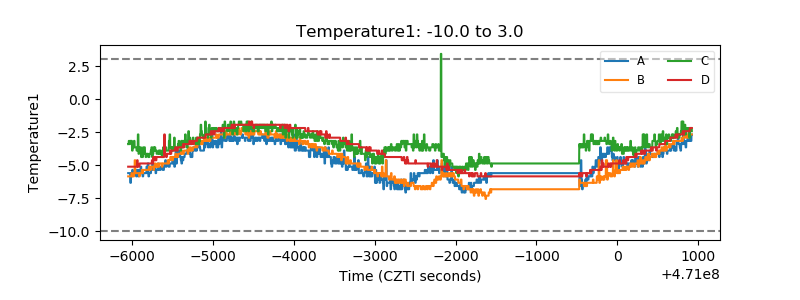 |
| Veto HV Monitor | 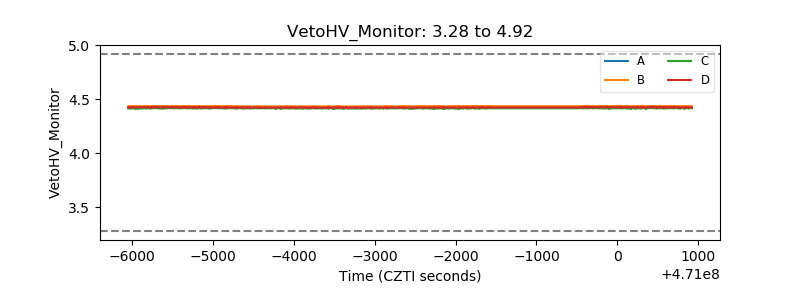 |
| Veto LLD | 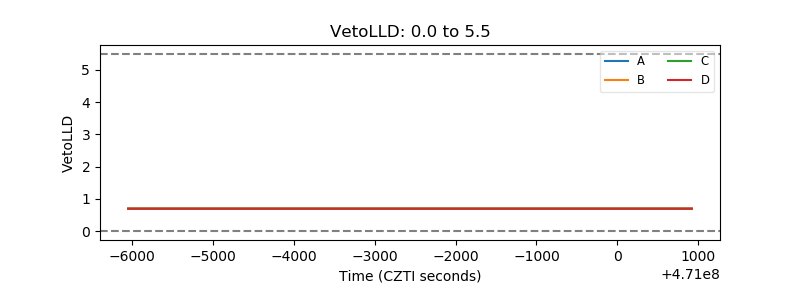 |
| Alpha Counter | 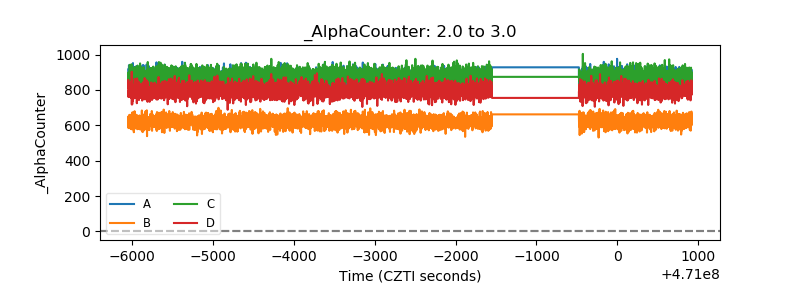 |
| _CPM_Rate | 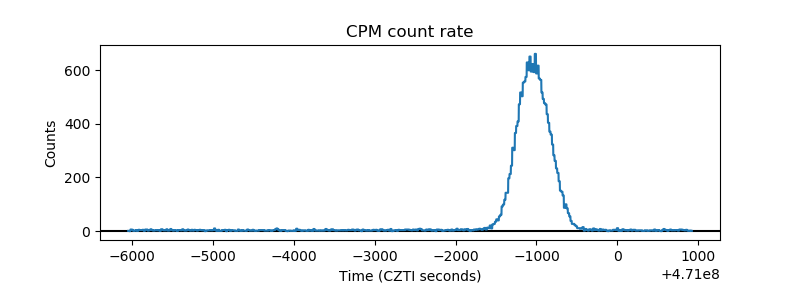 |
| CZT Counter | 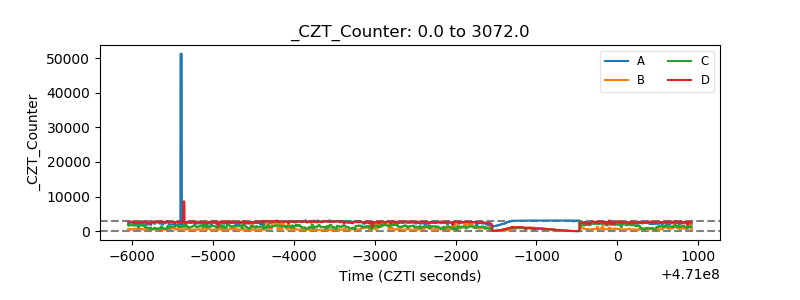 |
| +2.5 Volts monitor | 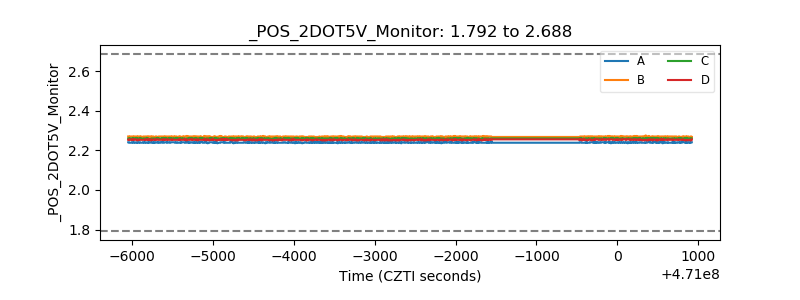 |
| +5 Volts monitor |  |
| _ROLL_ROT | 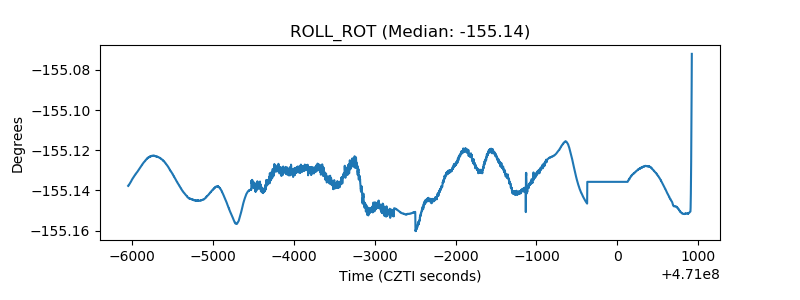 |
| _Roll_DEC | 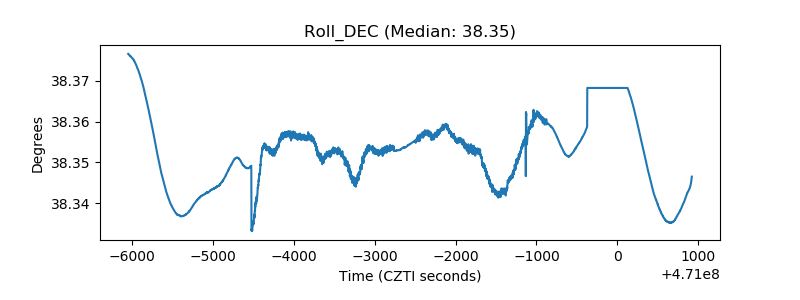 |
| _Roll_RA | 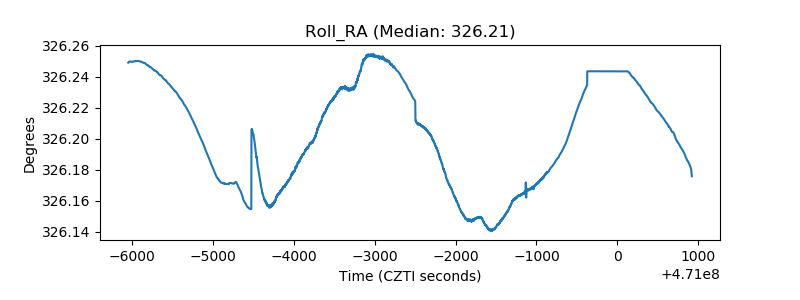 |
| Veto Counter | 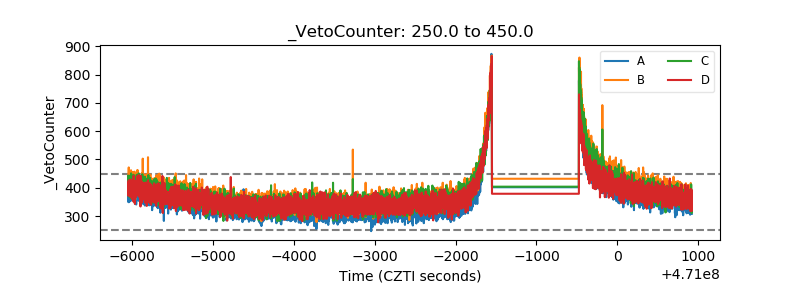 |