| Param | Original file | Final file |
|---|---|---|
| Filename | modeM0/AS1T05_233T01_9000006438_49681cztM0_level2.fits | modeM0/AS1T05_233T01_9000006438_49681cztM0_level2_quad_clean.evt |
| Size (bytes) | 1,163,301,120 | 49,184,640 |
| Size | 1.1 GB | 46.9 MB |
| Events in quadrant A | 15,097,628 | 270,989 |
| Events in quadrant B | 4,366,361 | 635,284 |
| Events in quadrant C | 7,881,832 | 19,285 |
| Events in quadrant D | 15,248,778 | 133,659 |
| Mode M9 | |||
|---|---|---|---|
| Quadrant | BADHDUFLAG | Total packets | Discarded packets |
| A | 0 | 10 | 0 |
| B | 0 | 10 | 0 |
| C | 0 | 10 | 0 |
| D | 0 | 10 | 0 |
| Mode SS | |||
|---|---|---|---|
| Quadrant | BADHDUFLAG | Total packets | Discarded packets |
| A | 0 | 124 | 0 |
| B | 0 | 124 | 0 |
| C | 0 | 124 | 0 |
| D | 0 | 124 | 0 |
| Mode M0 | |||
|---|---|---|---|
| Quadrant | BADHDUFLAG | Total packets | Discarded packets |
| A | 0 | 48943 | 0 |
| B | 0 | 17125 | 0 |
| C | 0 | 27671 | 0 |
| D | 0 | 49427 | 0 |
| Quadrant | Total seconds | Saturated seconds | Saturation percentage |
|---|---|---|---|
| A | 6027 | 5841 | 96.913888% |
| B | 6027 | 469 | 7.781649% |
| C | 6028 | 6028 | 100.000000% |
| D | 6028 | 5951 | 98.722628% |
Noise dominated data is calculated using 1-second bins in cleaned event files. If a bin has >2000 counts, and if more than 50% of those come from <1% of pixels, then it is considered to be noise-dominated and hence unusable.
| Quadrant | # 1 sec bins | Bins with >0 counts | Bins with >2000 counts | High rate bins dominated by noise | Noise dominated (total time) | Noise dominated (detector-on time) | Marked lightcurve |
|---|---|---|---|---|---|---|---|
| A | 7037 | 6027 | 5426 | 5426 | 77.11% | 90.03% | 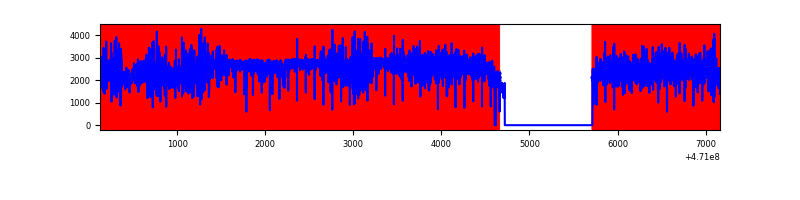 |
| B | 7037 | 6029 | 241 | 241 | 3.42% | 4.00% | 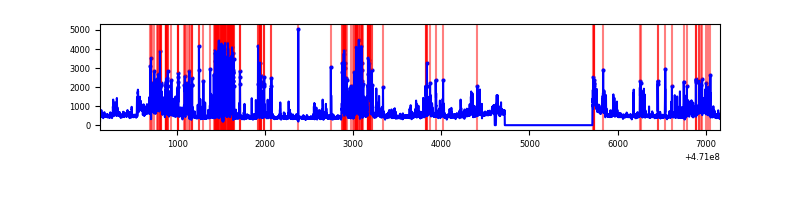 |
| C | 7037 | 6027 | 413 | 413 | 5.87% | 6.85% | 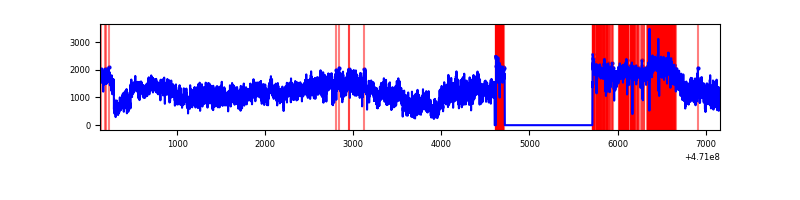 |
| D | 7038 | 6028 | 5567 | 5567 | 79.10% | 92.35% | 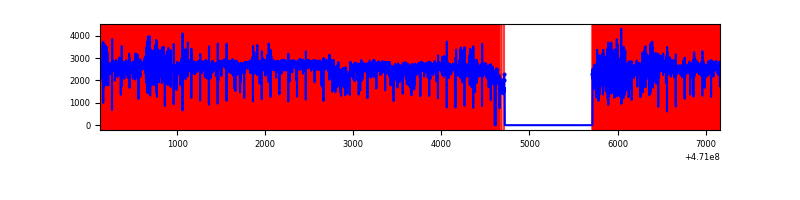 |
Top three noisy pixels from each quadrant. If the there are fewer than three noisy pixels in the level2.evt file, extra rows are filled as -1
| Pixel properties | Quadrant properties | ||||||
|---|---|---|---|---|---|---|---|
| Quadrant | DetID | PixID | Counts | Sigma | Mean | Median | Sigma |
| A | 10 | 83 | 4517492 | 45252.41 | 322 | 310 | 99.8 |
| A | 3 | 130 | 2151280 | 21548.08 | 322 | 310 | 99.8 |
| A | 4 | 60 | 1796269 | 17991.63 | 322 | 310 | 99.8 |
| B | 3 | 232 | 342657 | 2498.55 | 649 | 629 | 136.9 |
| B | 4 | 206 | 337374 | 2459.96 | 649 | 629 | 136.9 |
| B | 5 | 173 | 183304 | 1334.46 | 649 | 629 | 136.9 |
| C | 15 | 180 | 1887326 | 79091.86 | 41 | 38 | 23.9 |
| C | 15 | 163 | 1197921 | 50200.49 | 41 | 38 | 23.9 |
| C | 15 | 190 | 1130770 | 47386.35 | 41 | 38 | 23.9 |
| D | 15 | 40 | 3348361 | 46825.18 | 184 | 174 | 71.5 |
| D | 12 | 191 | 1407153 | 19676.93 | 184 | 174 | 71.5 |
| D | 7 | 45 | 1227234 | 17160.72 | 184 | 174 | 71.5 |
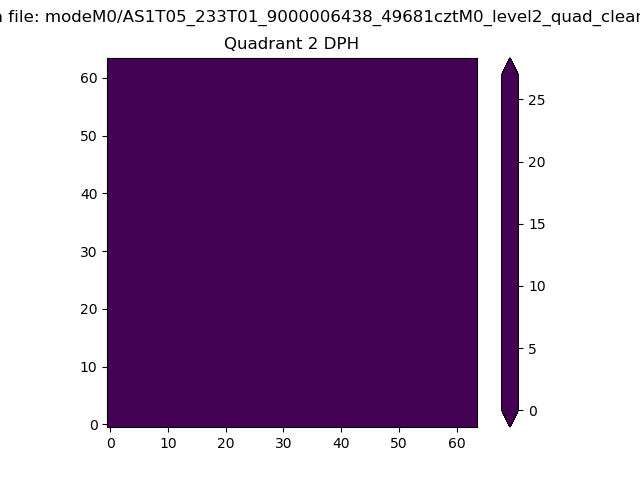
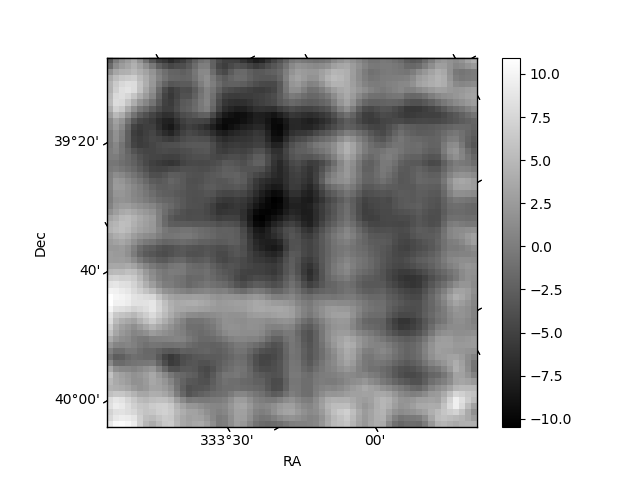
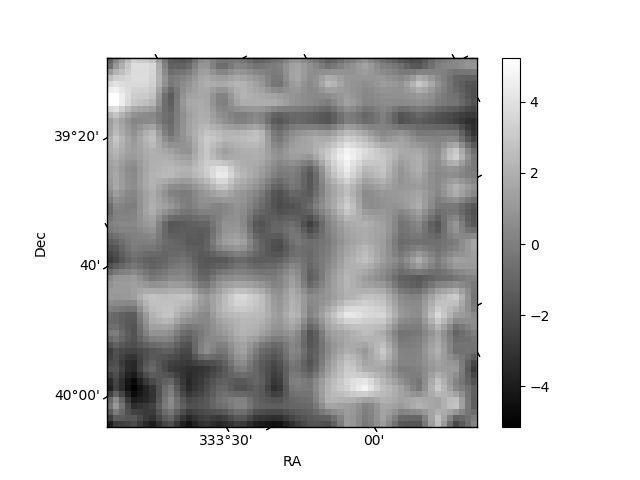
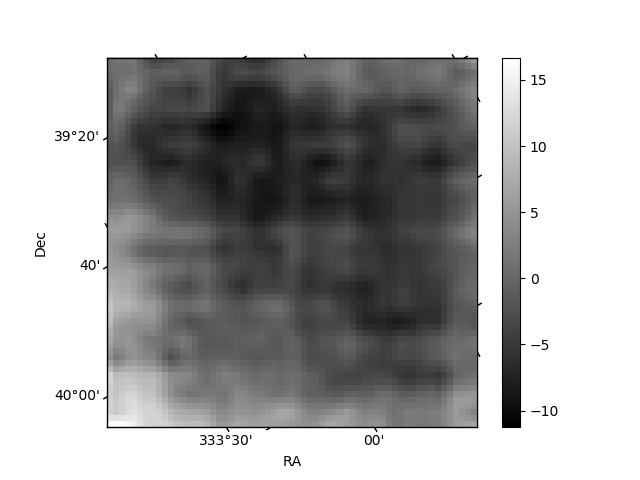
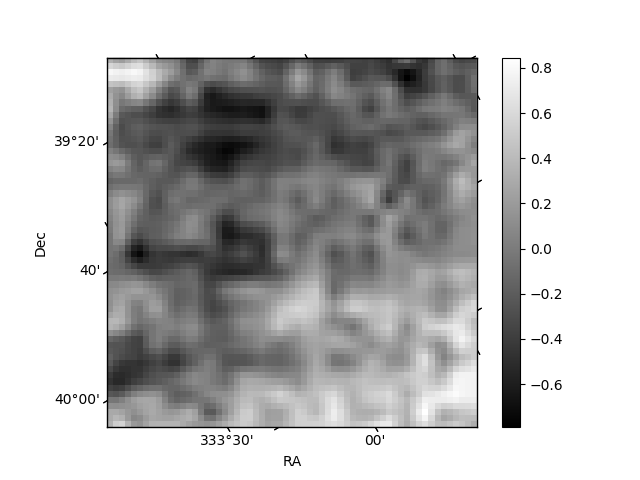
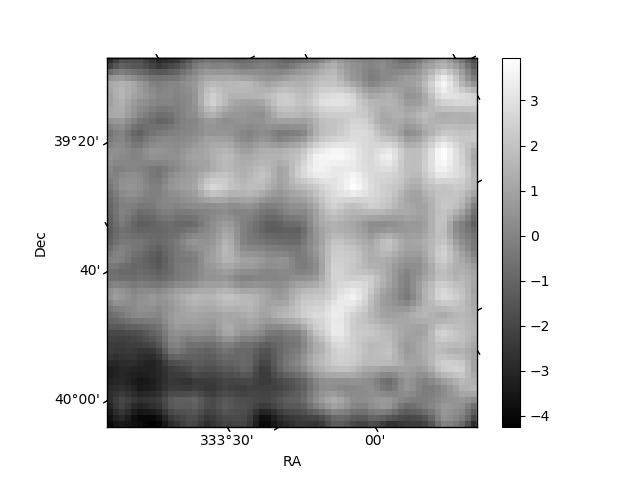
Histogram calculated using DETX and DETY for each event in the final _common_clean file
| Quadrant A | 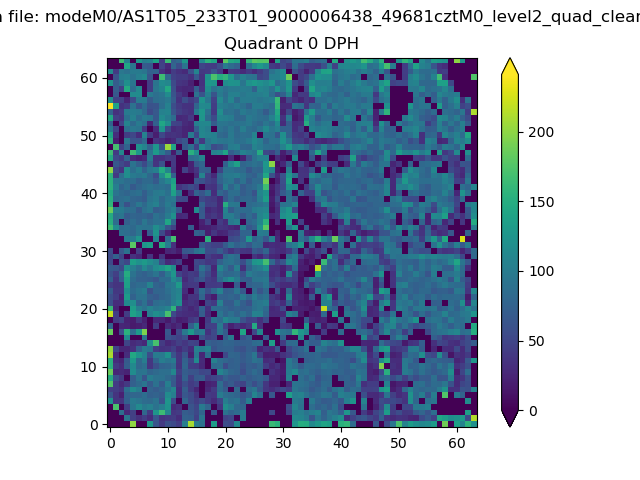 |
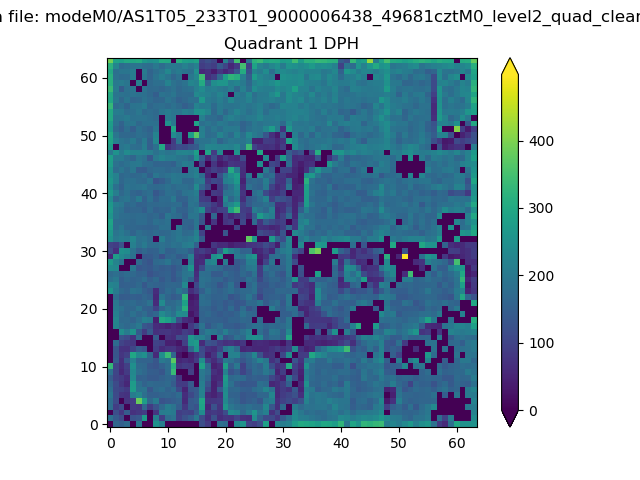 |
Quadrant B |
|---|---|---|---|
| Quadrant D | 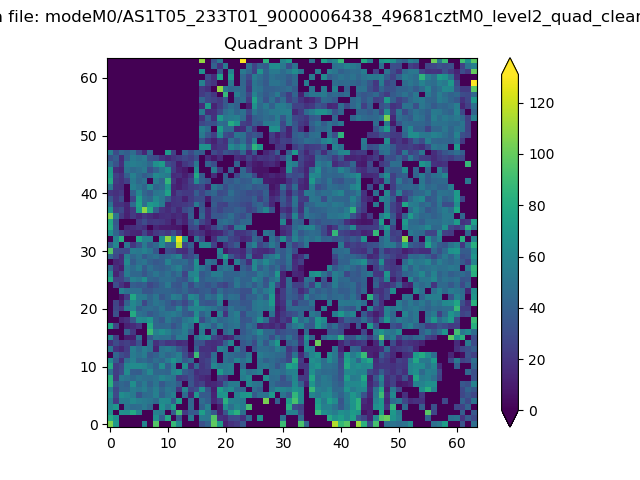 |
 |
Quadrant C |
| Plot type | Count rate plots | Images |
|---|---|---|
| Comparison with Poisson distribution Blue bars denote a histogram of data divided into 1 sec bins. Red curve is a Poisson curve with rate = median count rate of data. |
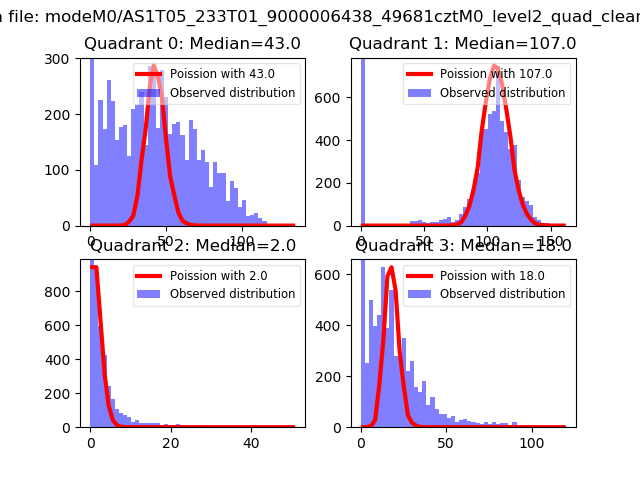 |
 |
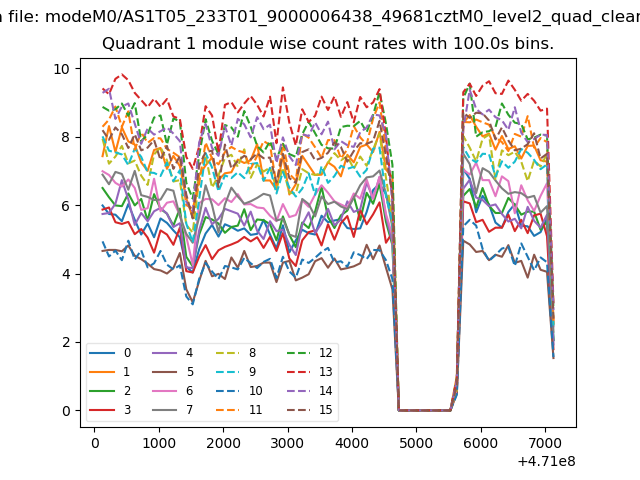
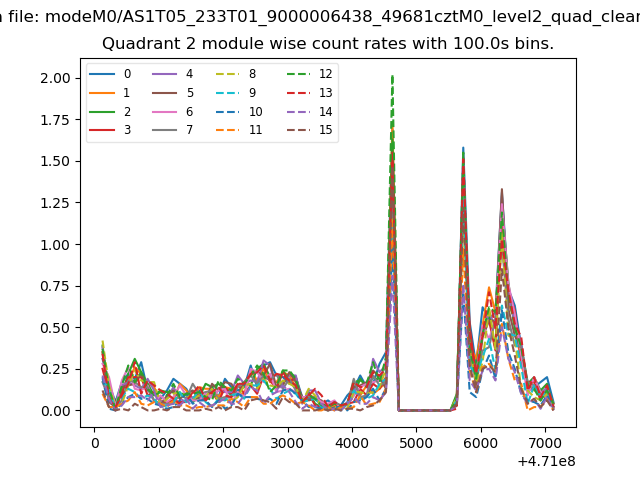
| Quadrant-wise count rates Data is divided into 100 sec bins |
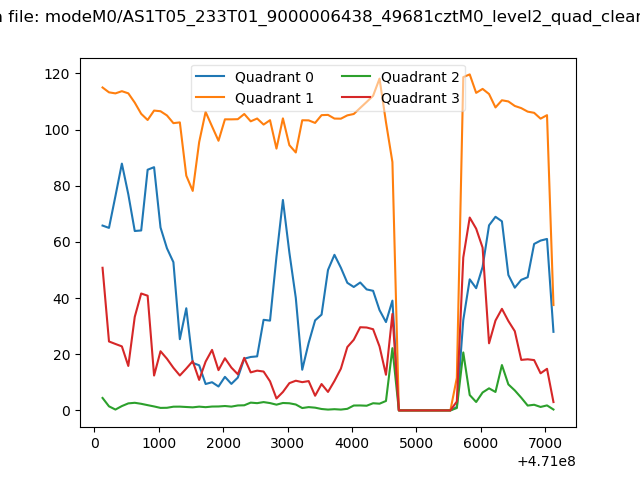 |
|
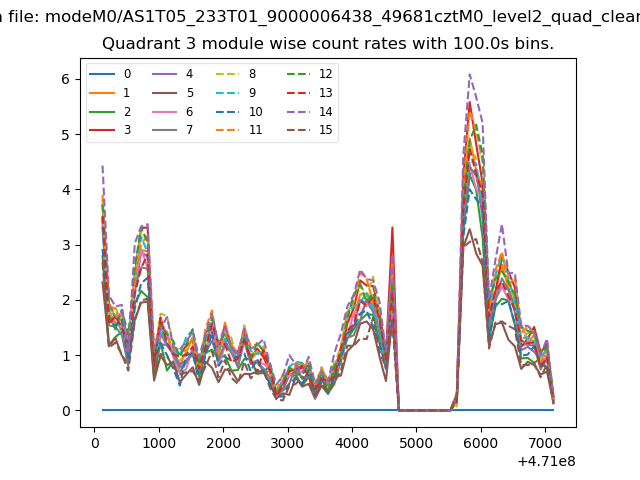
| Module-wise count rates for Quadrant A Data is divided into 100 sec bins |
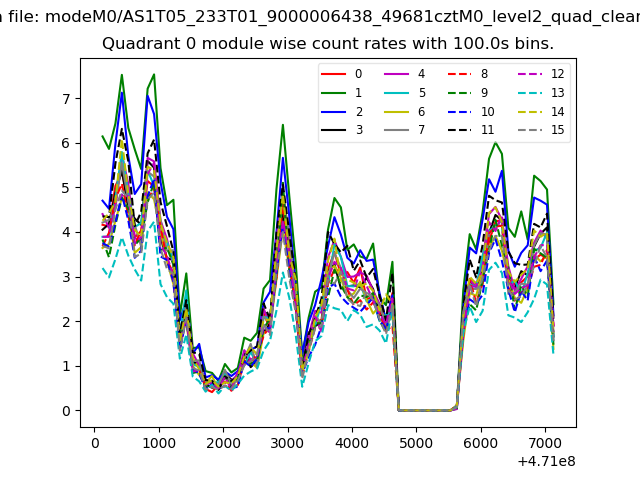 |
 |
| Module-wise count rates for Quadrant B Data is divided into 100 sec bins |
 |
 |
| Module-wise count rates for Quadrant C Data is divided into 100 sec bins |
 |
 |
| Module-wise count rates for Quadrant D Data is divided into 100 sec bins |
 |
 |
| Parameter | Plot |
|---|---|
| CZT HV Monitor | 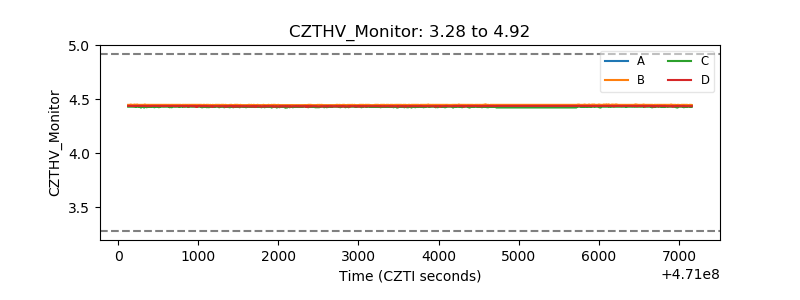 |
| D_VDD | 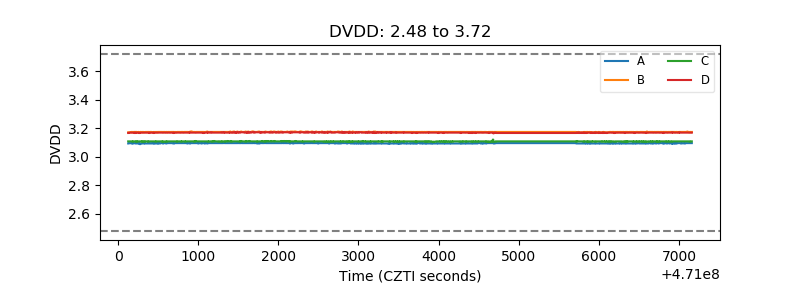 |
| Temperature 1 | 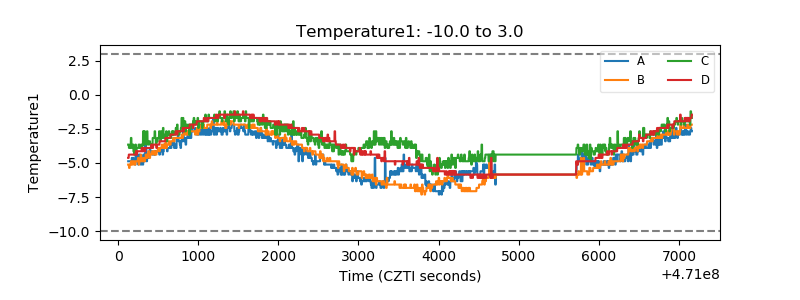 |
| Veto HV Monitor |  |
| Veto LLD | 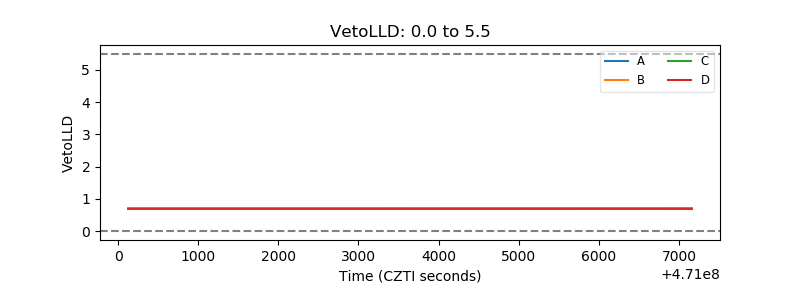 |
| Alpha Counter | 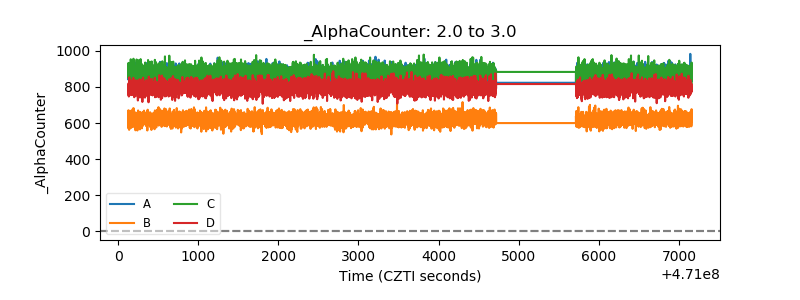 |
| _CPM_Rate | 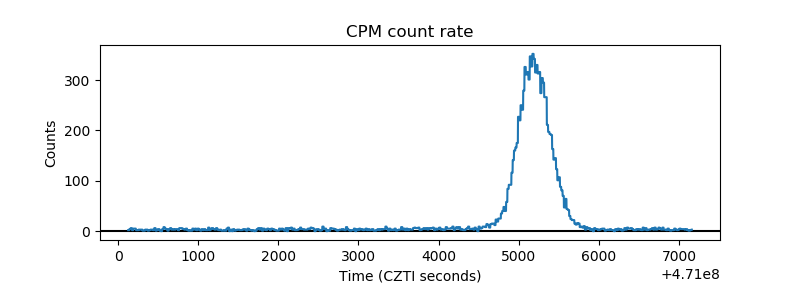 |
| CZT Counter | 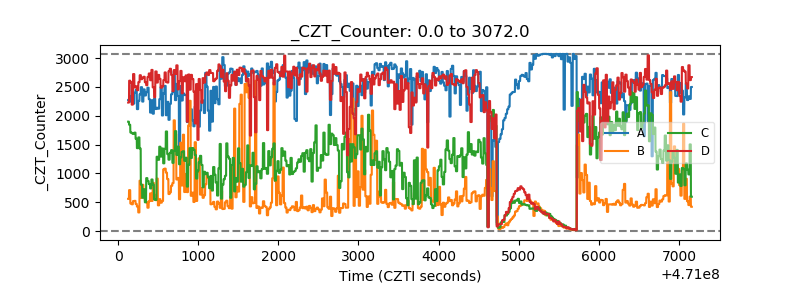 |
| +2.5 Volts monitor | 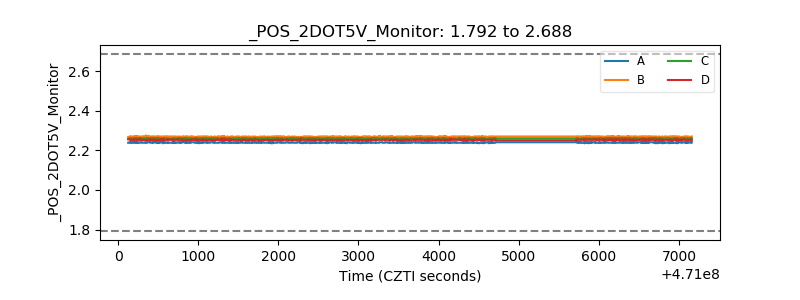 |
| +5 Volts monitor | 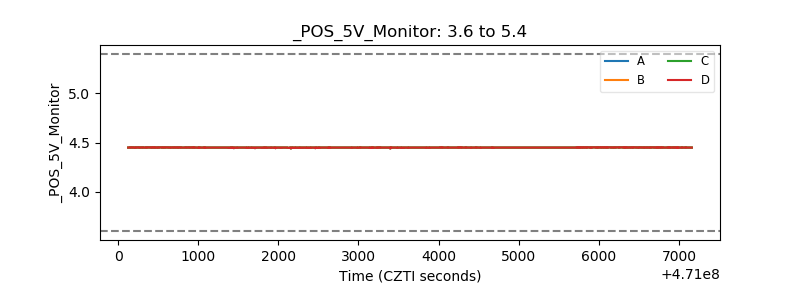 |
| _ROLL_ROT | 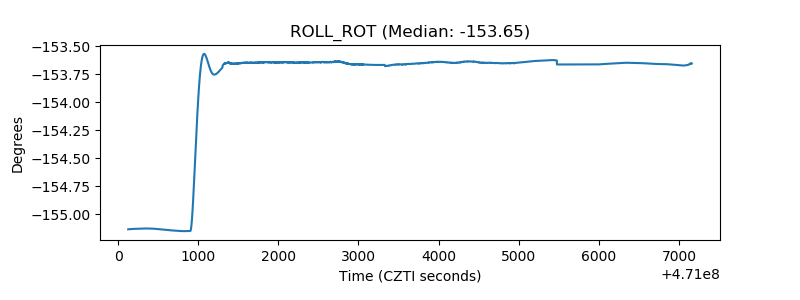 |
| _Roll_DEC | 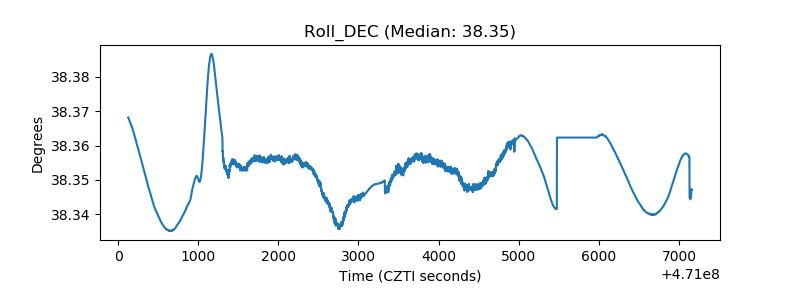 |
| _Roll_RA | 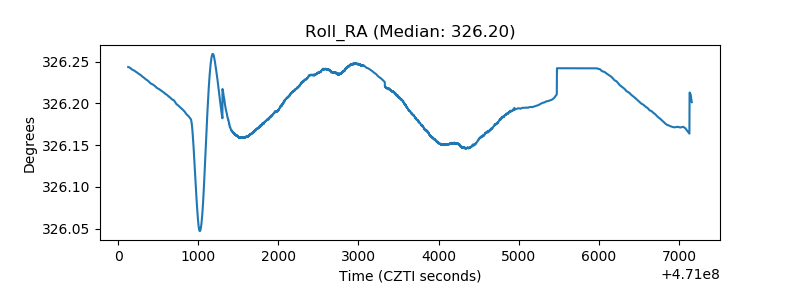 |
| Veto Counter | 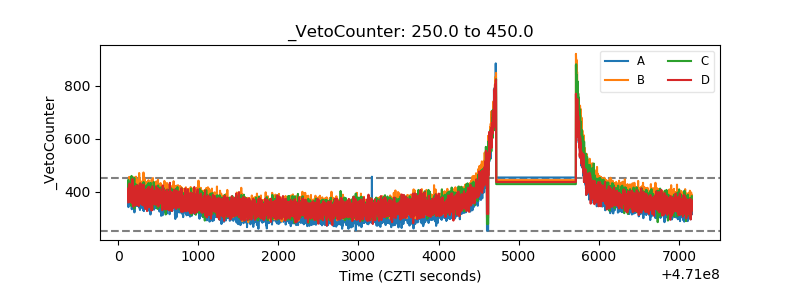 |