| Param | Original file | Final file |
|---|---|---|
| Filename | modeM0/AS1T05_233T01_9000006438_49682cztM0_level2.fits | modeM0/AS1T05_233T01_9000006438_49682cztM0_level2_quad_clean.evt |
| Size (bytes) | 1,275,621,120 | 38,324,160 |
| Size | 1.2 GB | 36.5 MB |
| Events in quadrant A | 16,484,682 | 20,326 |
| Events in quadrant B | 4,540,091 | 670,652 |
| Events in quadrant C | 9,129,943 | 694 |
| Events in quadrant D | 16,554,344 | 9,134 |
| Mode M9 | |||
|---|---|---|---|
| Quadrant | BADHDUFLAG | Total packets | Discarded packets |
| A | 0 | 9 | 0 |
| B | 0 | 9 | 0 |
| C | 0 | 9 | 0 |
| D | 0 | 9 | 0 |
| Mode SS | |||
|---|---|---|---|
| Quadrant | BADHDUFLAG | Total packets | Discarded packets |
| A | 0 | 132 | 0 |
| B | 0 | 132 | 0 |
| C | 0 | 132 | 0 |
| D | 0 | 132 | 0 |
| Mode M0 | |||
|---|---|---|---|
| Quadrant | BADHDUFLAG | Total packets | Discarded packets |
| A | 0 | 53440 | 1 |
| B | 0 | 17981 | 1 |
| C | 0 | 31731 | 2 |
| D | 0 | 53668 | 1 |
| Quadrant | Total seconds | Saturated seconds | Saturation percentage |
|---|---|---|---|
| A | 6594 | 6462 | 97.998180% |
| B | 6595 | 339 | 5.140258% |
| C | 6594 | 6590 | 99.939339% |
| D | 6594 | 6519 | 98.862602% |
Noise dominated data is calculated using 1-second bins in cleaned event files. If a bin has >2000 counts, and if more than 50% of those come from <1% of pixels, then it is considered to be noise-dominated and hence unusable.
| Quadrant | # 1 sec bins | Bins with >0 counts | Bins with >2000 counts | High rate bins dominated by noise | Noise dominated (total time) | Noise dominated (detector-on time) | Marked lightcurve |
|---|---|---|---|---|---|---|---|
| A | 7478 | 6593 | 5941 | 5941 | 79.45% | 90.11% | 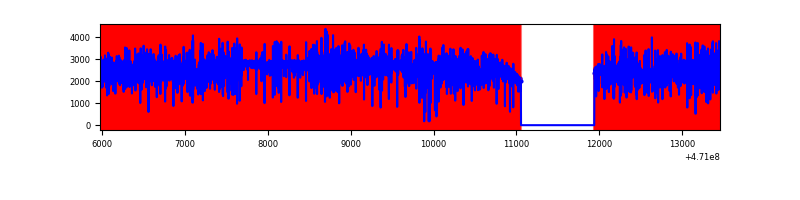 |
| B | 7480 | 6596 | 187 | 187 | 2.50% | 2.84% | 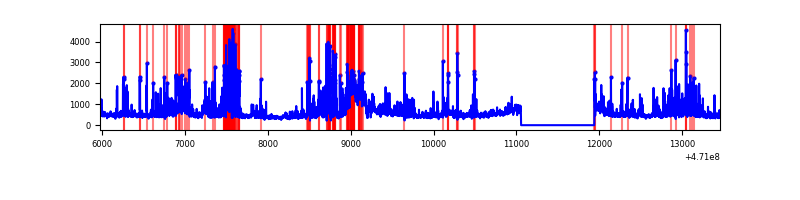 |
| C | 7478 | 6593 | 712 | 712 | 9.52% | 10.80% | 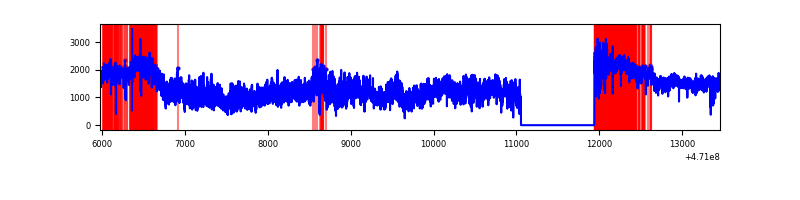 |
| D | 7478 | 6593 | 6165 | 6165 | 82.44% | 93.51% |  |
Top three noisy pixels from each quadrant. If the there are fewer than three noisy pixels in the level2.evt file, extra rows are filled as -1
| Pixel properties | Quadrant properties | ||||||
|---|---|---|---|---|---|---|---|
| Quadrant | DetID | PixID | Counts | Sigma | Mean | Median | Sigma |
| A | 10 | 83 | 5534860 | 44735.16 | 386 | 370 | 123.7 |
| A | 3 | 130 | 1759047 | 14215.35 | 386 | 370 | 123.7 |
| A | 4 | 60 | 1701819 | 13752.78 | 386 | 370 | 123.7 |
| B | 5 | 173 | 300898 | 1976.1 | 707 | 686 | 151.9 |
| B | 3 | 232 | 283747 | 1863.21 | 707 | 686 | 151.9 |
| B | 10 | 45 | 279929 | 1838.08 | 707 | 686 | 151.9 |
| C | 15 | 180 | 2426691 | 95153.06 | 53 | 50 | 25.5 |
| C | 15 | 190 | 1291501 | 50640.17 | 53 | 50 | 25.5 |
| C | 15 | 181 | 1065198 | 41766.41 | 53 | 50 | 25.5 |
| D | 15 | 40 | 3292497 | 39863.52 | 195 | 184 | 82.6 |
| D | 7 | 45 | 2208636 | 26740.06 | 195 | 184 | 82.6 |
| D | 7 | 60 | 1541465 | 18661.92 | 195 | 184 | 82.6 |
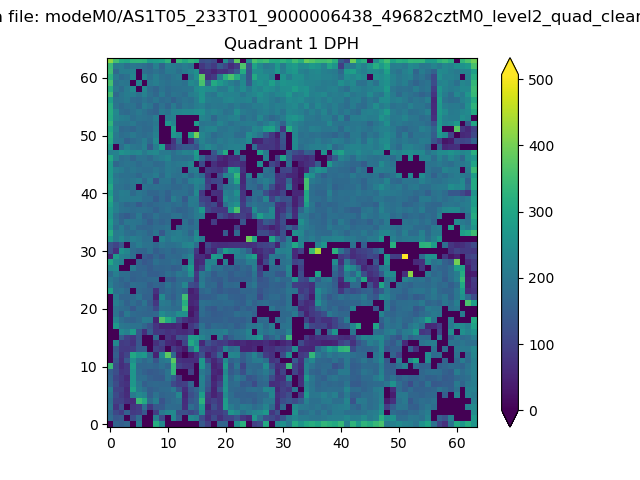
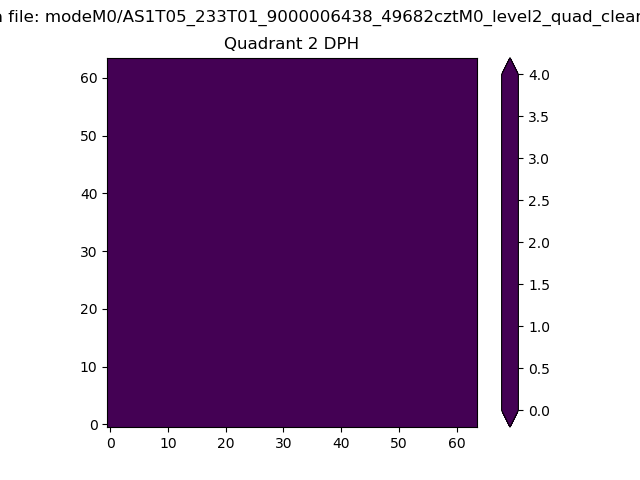
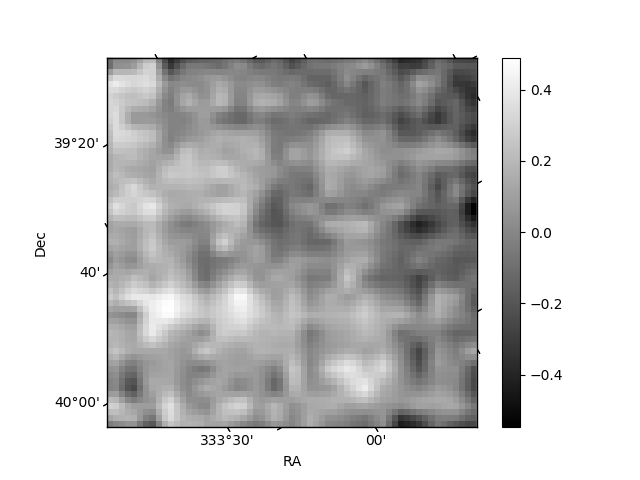
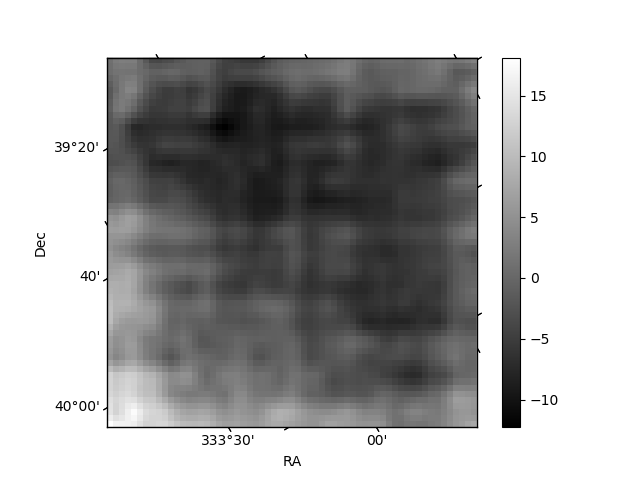
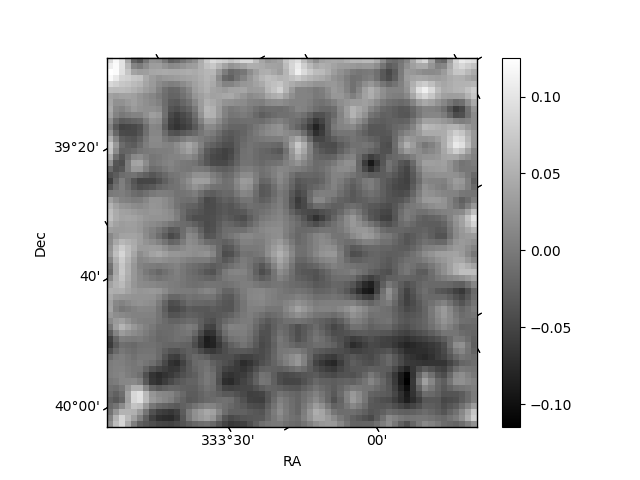
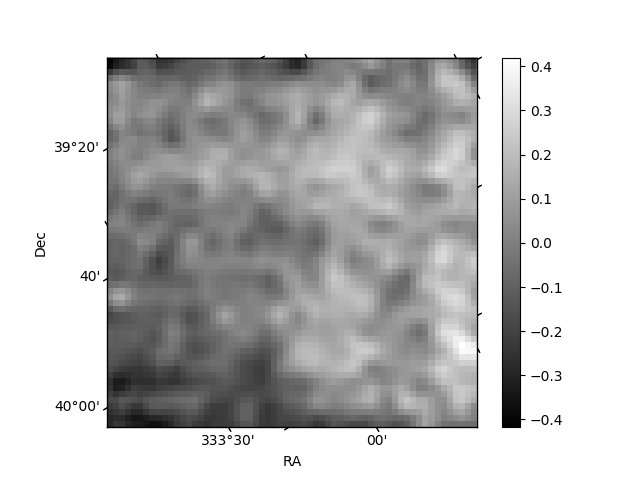
Histogram calculated using DETX and DETY for each event in the final _common_clean file
| Quadrant A | 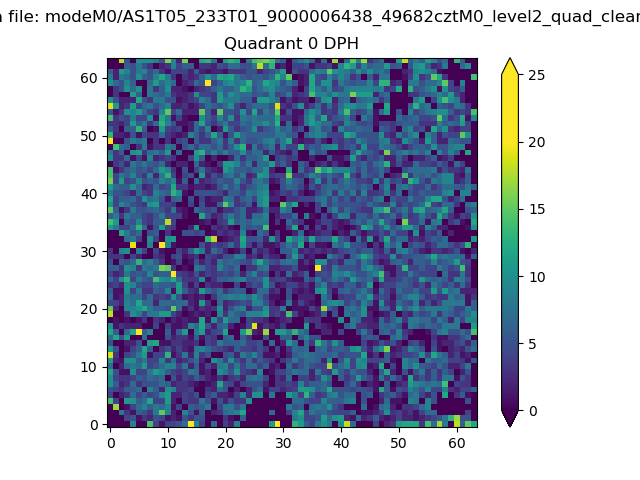 |
 |
Quadrant B |
|---|---|---|---|
| Quadrant D | 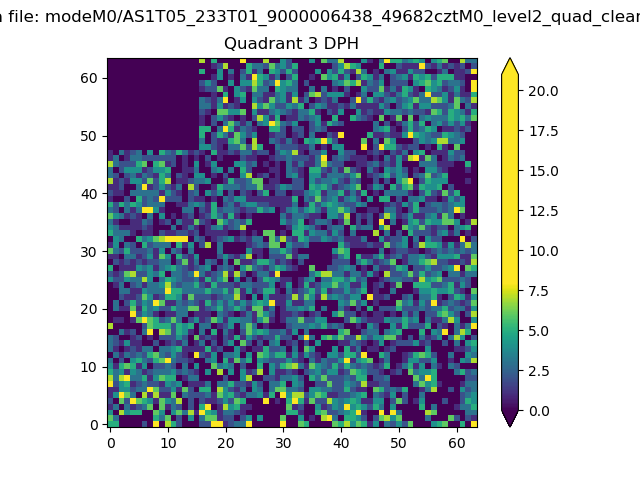 |
 |
Quadrant C |
| Plot type | Count rate plots | Images |
|---|---|---|
| Comparison with Poisson distribution Blue bars denote a histogram of data divided into 1 sec bins. Red curve is a Poisson curve with rate = median count rate of data. |
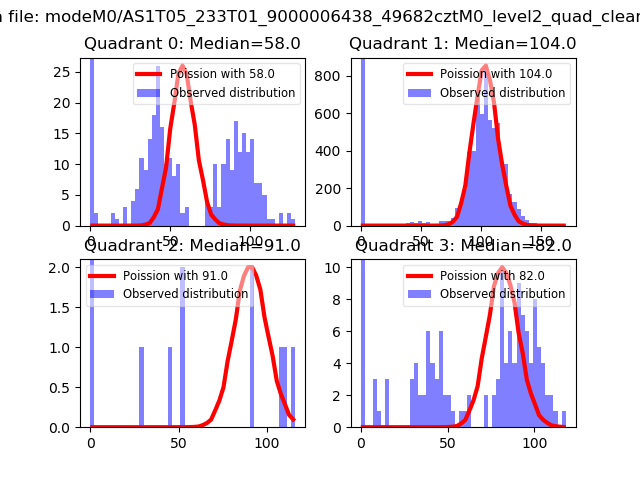 |
 |
| Quadrant-wise count rates Data is divided into 100 sec bins |
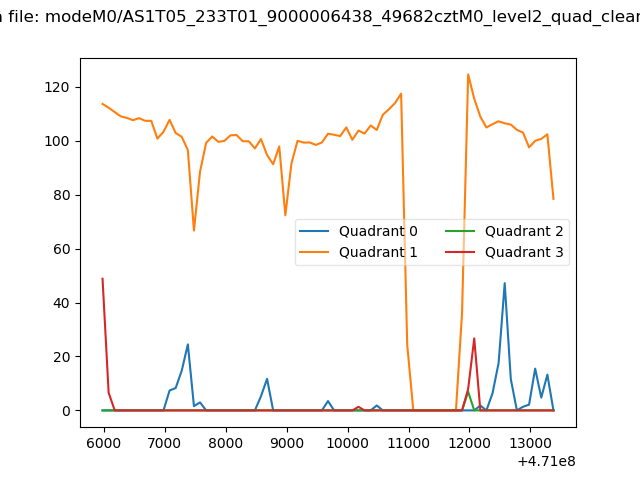 |
|
| Module-wise count rates for Quadrant A Data is divided into 100 sec bins |
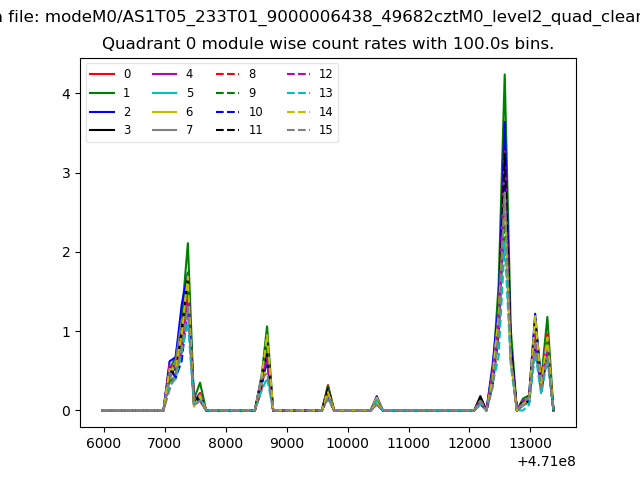 |
 |
| Module-wise count rates for Quadrant B Data is divided into 100 sec bins |
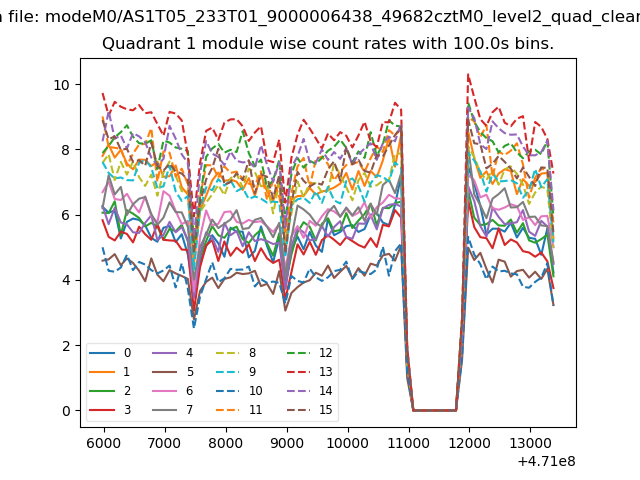 |
 |
| Module-wise count rates for Quadrant C Data is divided into 100 sec bins |
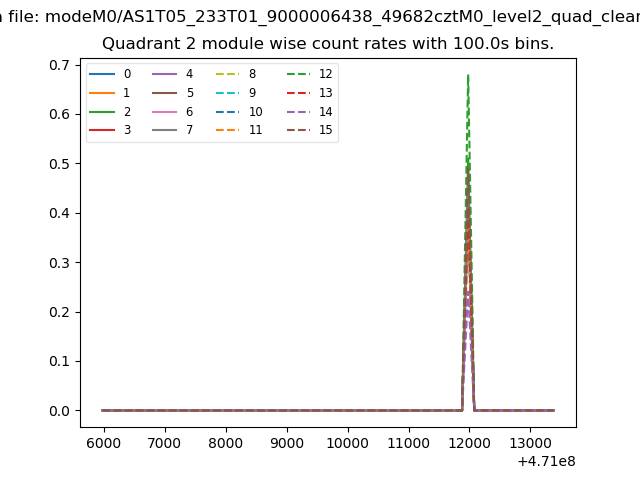 |
 |
| Module-wise count rates for Quadrant D Data is divided into 100 sec bins |
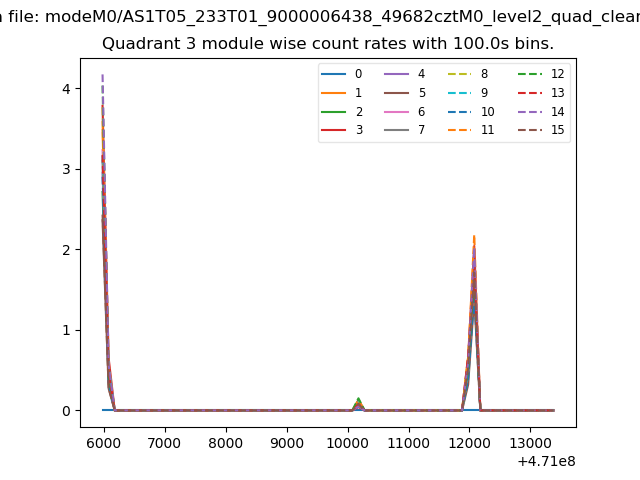 |
 |
| Parameter | Plot |
|---|---|
| CZT HV Monitor | 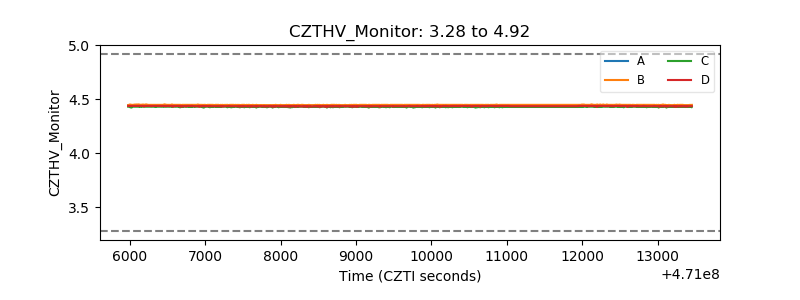 |
| D_VDD | 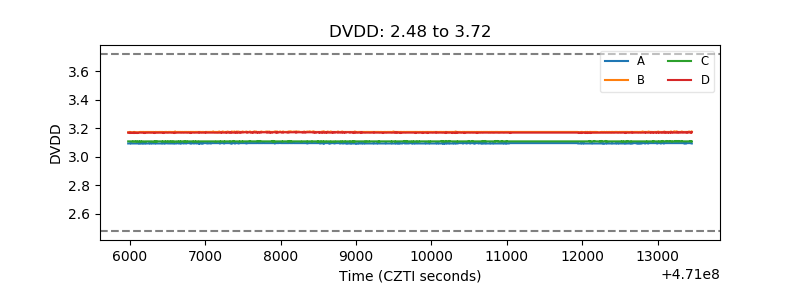 |
| Temperature 1 | 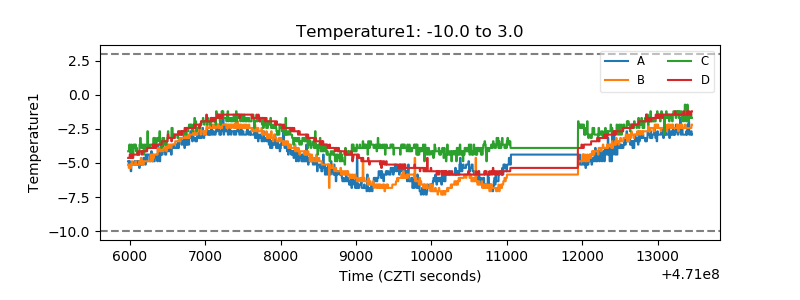 |
| Veto HV Monitor |  |
| Veto LLD | 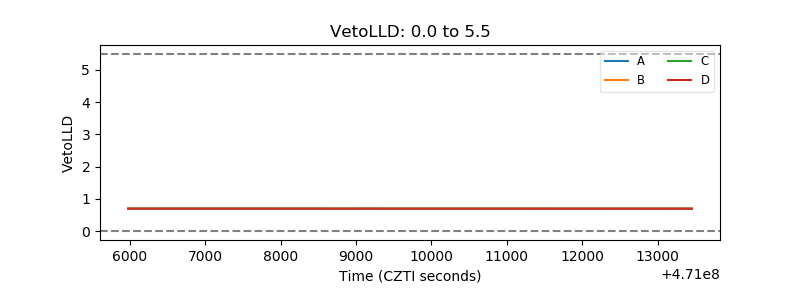 |
| Alpha Counter | 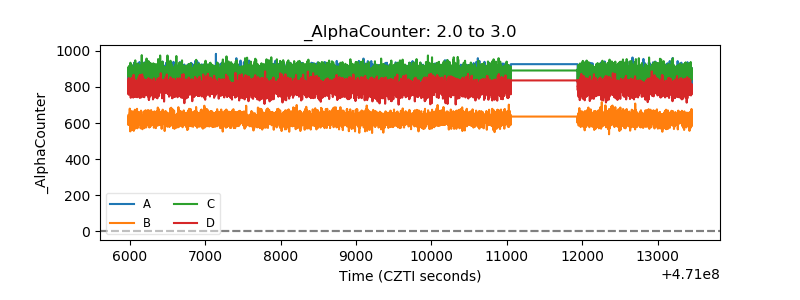 |
| _CPM_Rate | 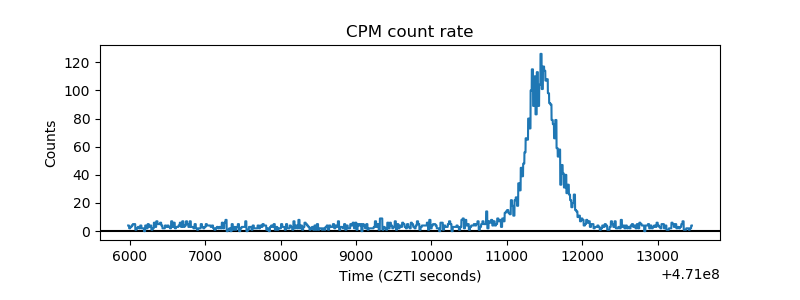 |
| CZT Counter | 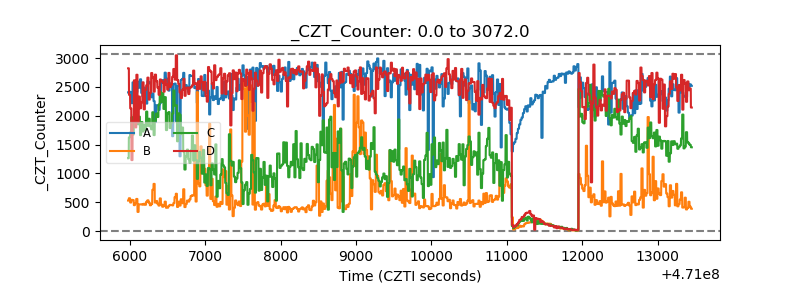 |
| +2.5 Volts monitor | 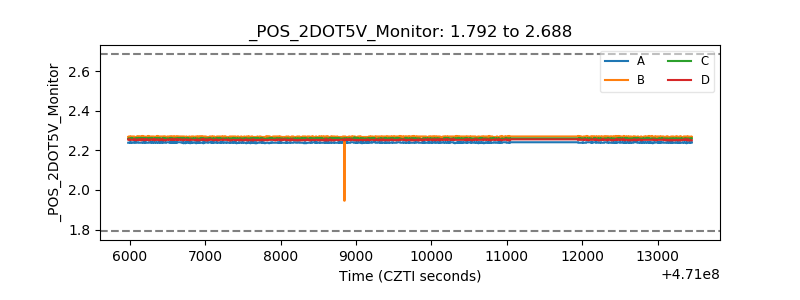 |
| +5 Volts monitor | 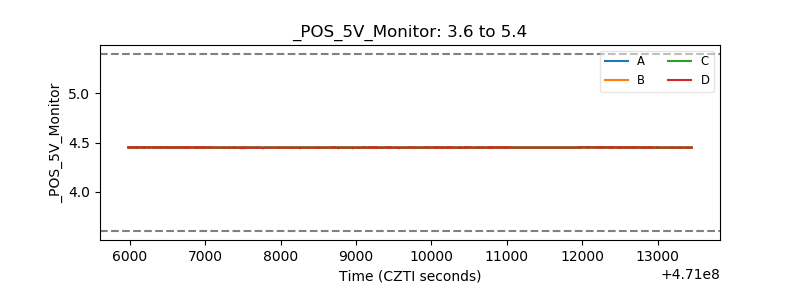 |
| _ROLL_ROT | 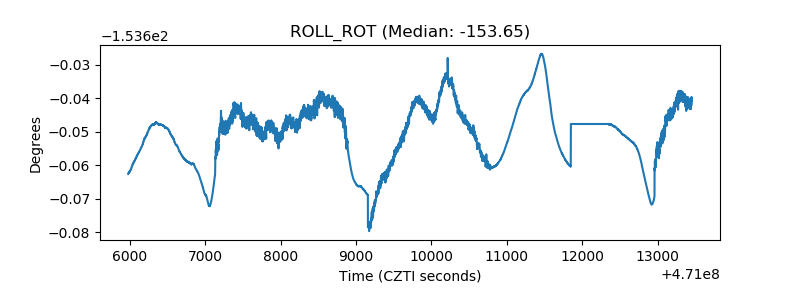 |
| _Roll_DEC | 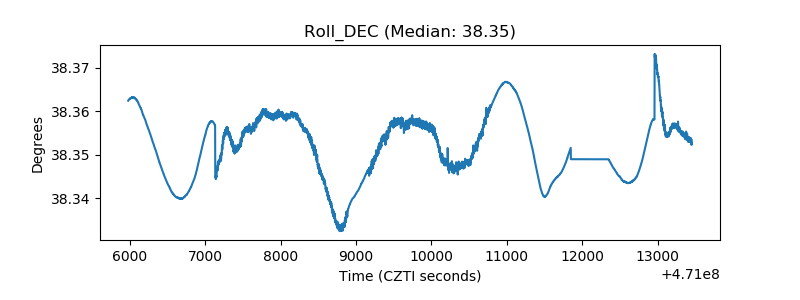 |
| _Roll_RA | 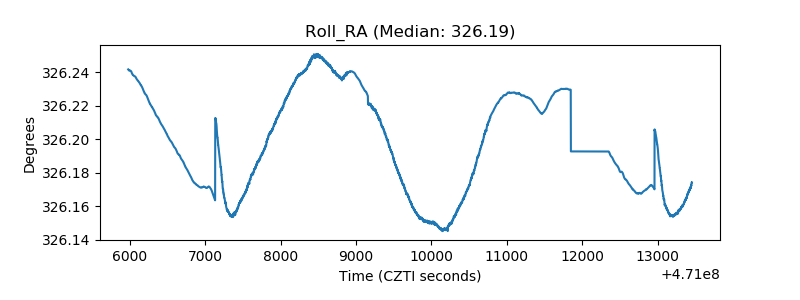 |
| Veto Counter | 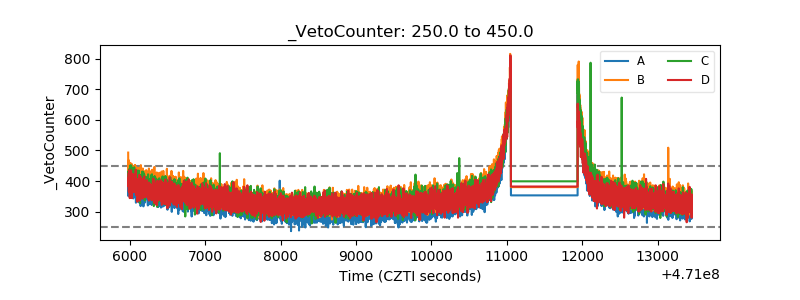 |