| Param | Original file | Final file |
|---|---|---|
| Filename | modeM0/AS1T05_233T01_9000006438_49683cztM0_level2.fits | modeM0/AS1T05_233T01_9000006438_49683cztM0_level2_quad_clean.evt |
| Size (bytes) | 1,303,571,520 | 53,766,720 |
| Size | 1.2 GB | 51.3 MB |
| Events in quadrant A | 16,934,168 | 304,903 |
| Events in quadrant B | 4,703,945 | 694,107 |
| Events in quadrant C | 9,194,659 | 22,556 |
| Events in quadrant D | 16,893,611 | 121,492 |
| Mode M9 | |||
|---|---|---|---|
| Quadrant | BADHDUFLAG | Total packets | Discarded packets |
| A | 0 | 6 | 0 |
| B | 0 | 6 | 0 |
| C | 0 | 6 | 0 |
| D | 0 | 6 | 0 |
| Mode SS | |||
|---|---|---|---|
| Quadrant | BADHDUFLAG | Total packets | Discarded packets |
| A | 0 | 138 | 0 |
| B | 0 | 138 | 0 |
| C | 0 | 138 | 0 |
| D | 0 | 138 | 0 |
| Mode M0 | |||
|---|---|---|---|
| Quadrant | BADHDUFLAG | Total packets | Discarded packets |
| A | 0 | 54934 | 0 |
| B | 0 | 18719 | 0 |
| C | 0 | 32097 | 0 |
| D | 0 | 54827 | 0 |
| Quadrant | Total seconds | Saturated seconds | Saturation percentage |
|---|---|---|---|
| A | 6816 | 6652 | 97.593897% |
| B | 6817 | 342 | 5.016870% |
| C | 6817 | 6817 | 100.000000% |
| D | 6817 | 6800 | 99.750623% |
Noise dominated data is calculated using 1-second bins in cleaned event files. If a bin has >2000 counts, and if more than 50% of those come from <1% of pixels, then it is considered to be noise-dominated and hence unusable.
| Quadrant | # 1 sec bins | Bins with >0 counts | Bins with >2000 counts | High rate bins dominated by noise | Noise dominated (total time) | Noise dominated (detector-on time) | Marked lightcurve |
|---|---|---|---|---|---|---|---|
| A | 7375 | 6815 | 5923 | 5923 | 80.31% | 86.91% | 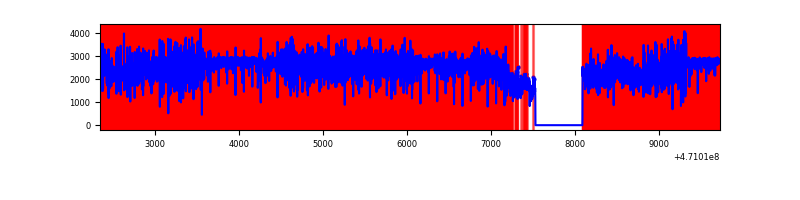 |
| B | 7377 | 6818 | 138 | 138 | 1.87% | 2.02% | 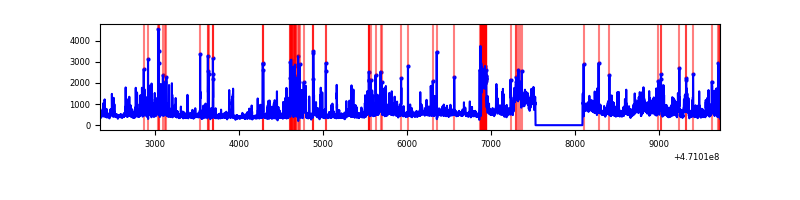 |
| C | 7376 | 6816 | 365 | 365 | 4.95% | 5.36% | 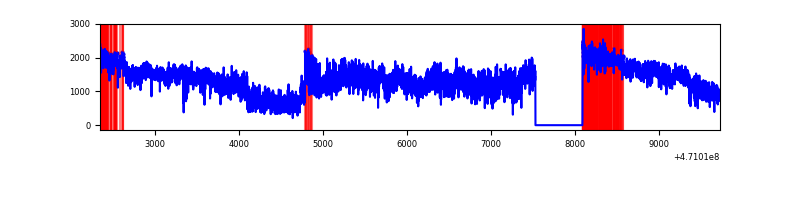 |
| D | 7376 | 6816 | 6365 | 6365 | 86.29% | 93.38% | 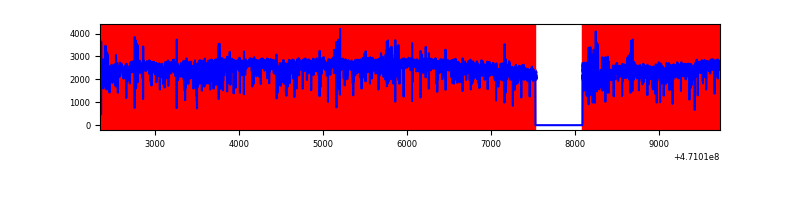 |
Top three noisy pixels from each quadrant. If the there are fewer than three noisy pixels in the level2.evt file, extra rows are filled as -1
| Pixel properties | Quadrant properties | ||||||
|---|---|---|---|---|---|---|---|
| Quadrant | DetID | PixID | Counts | Sigma | Mean | Median | Sigma |
| A | 10 | 83 | 5446010 | 50607.73 | 369 | 355 | 107.6 |
| A | 3 | 130 | 2792581 | 25948.8 | 369 | 355 | 107.6 |
| A | 4 | 60 | 1103878 | 10255.29 | 369 | 355 | 107.6 |
| B | 10 | 128 | 488478 | 3186.51 | 723 | 702 | 153.1 |
| B | 10 | 44 | 319193 | 2080.61 | 723 | 702 | 153.1 |
| B | 10 | 247 | 155301 | 1009.95 | 723 | 702 | 153.1 |
| C | 15 | 180 | 2457917 | 115007.37 | 44 | 42 | 21.4 |
| C | 15 | 190 | 1714885 | 80239.87 | 44 | 42 | 21.4 |
| C | 15 | 181 | 834099 | 39026.68 | 44 | 42 | 21.4 |
| D | 15 | 40 | 3178873 | 45159.36 | 172 | 162 | 70.4 |
| D | 7 | 45 | 2092766 | 29729.24 | 172 | 162 | 70.4 |
| D | 15 | 171 | 1731064 | 24590.6 | 172 | 162 | 70.4 |
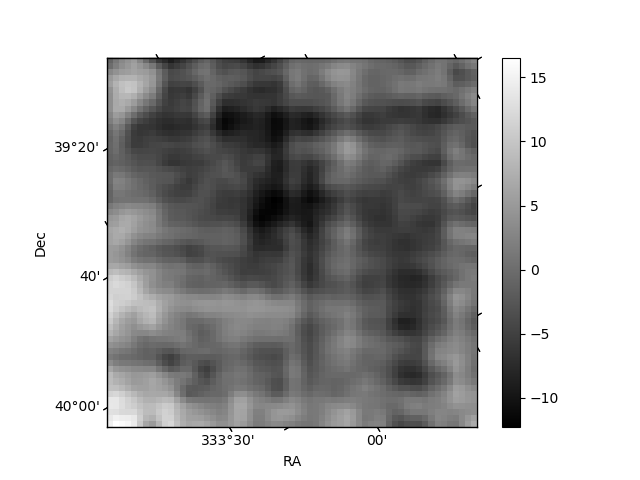
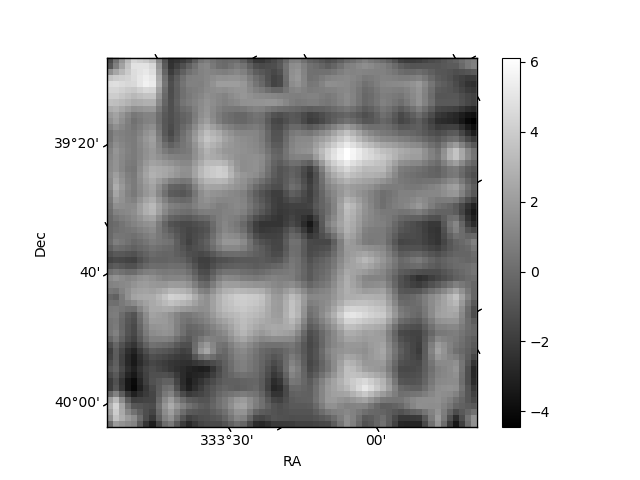
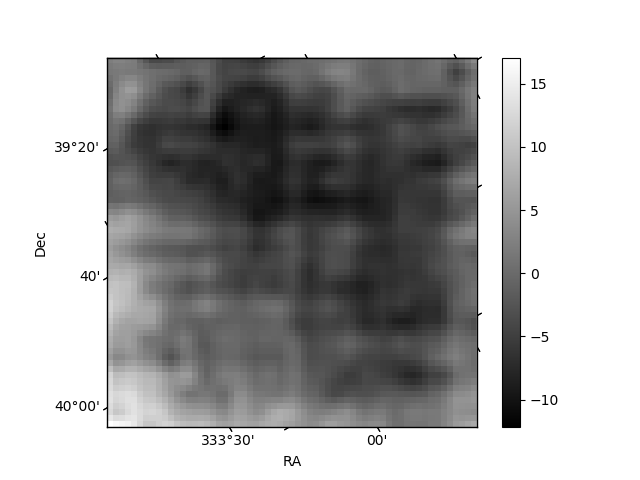
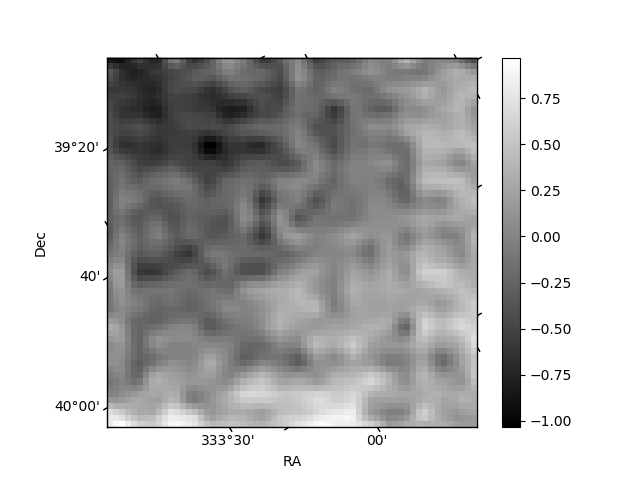
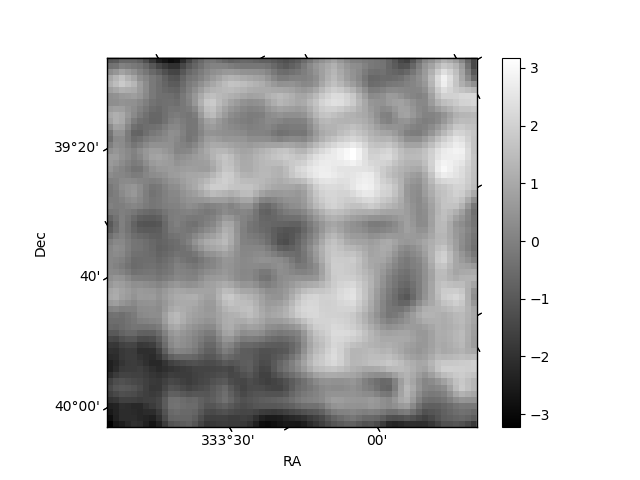
Histogram calculated using DETX and DETY for each event in the final _common_clean file
| Quadrant A | 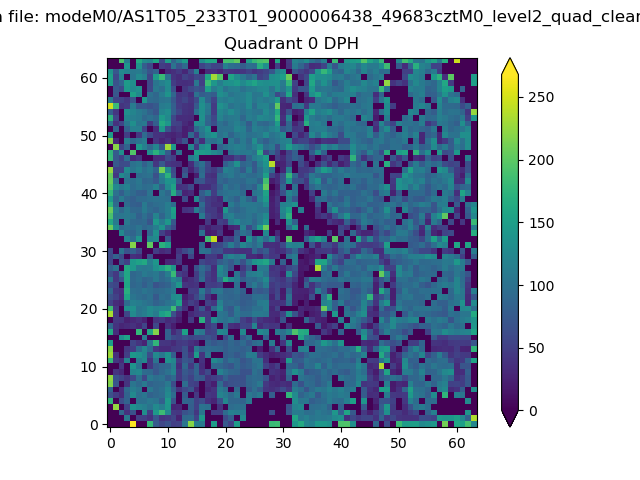 |
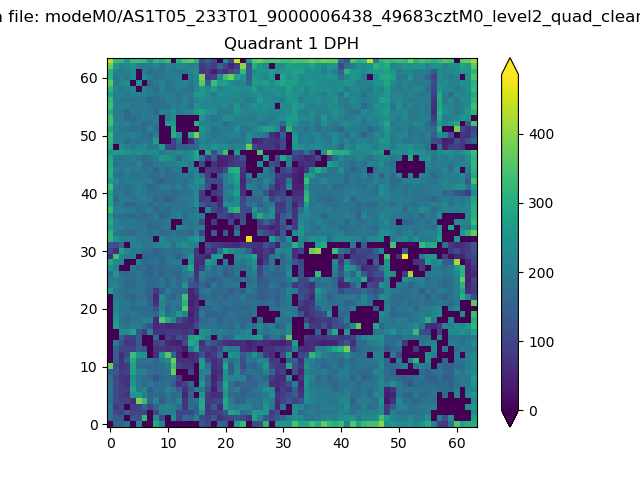 |
Quadrant B |
|---|---|---|---|
| Quadrant D | 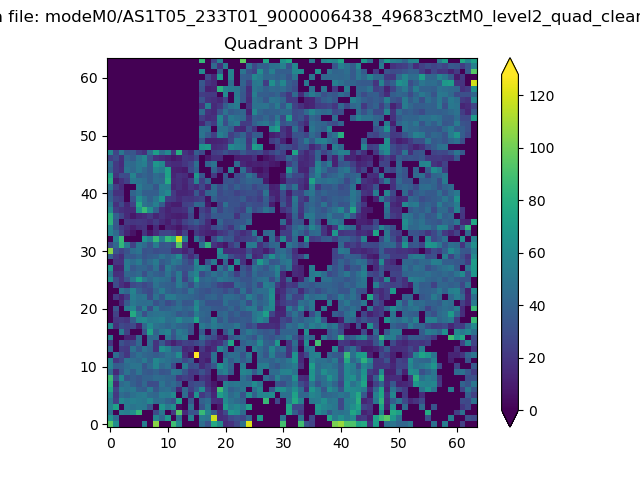 |
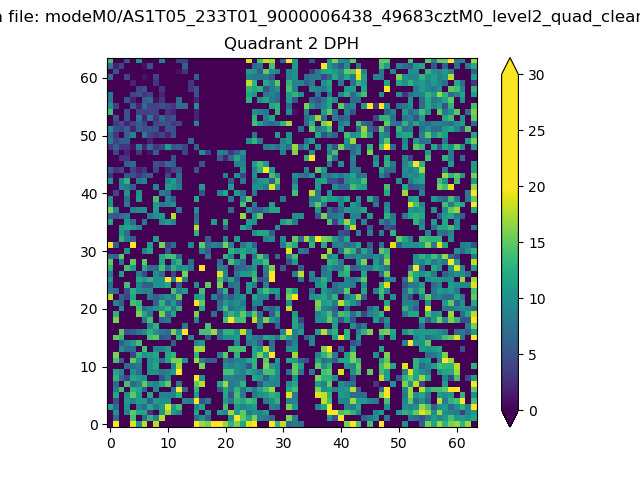 |
Quadrant C |
| Plot type | Count rate plots | Images |
|---|---|---|
| Comparison with Poisson distribution Blue bars denote a histogram of data divided into 1 sec bins. Red curve is a Poisson curve with rate = median count rate of data. |
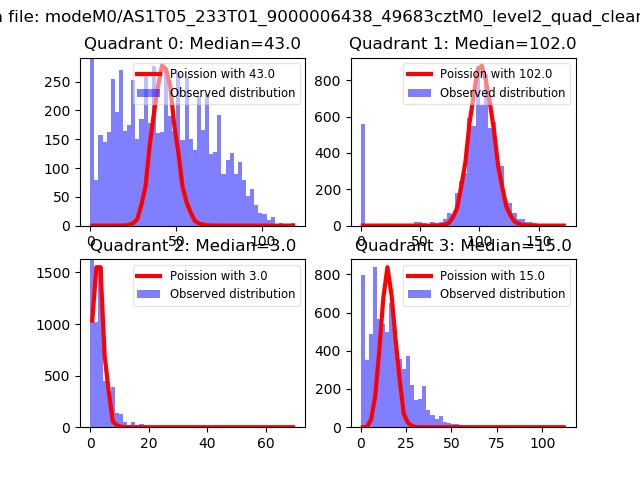 |
 |
| Quadrant-wise count rates Data is divided into 100 sec bins |
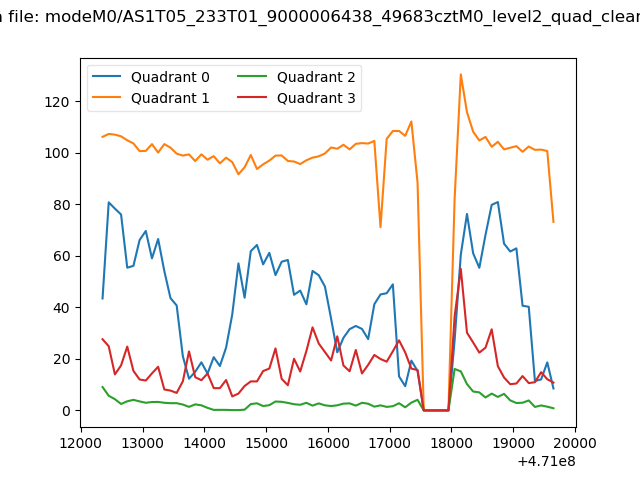 |
|
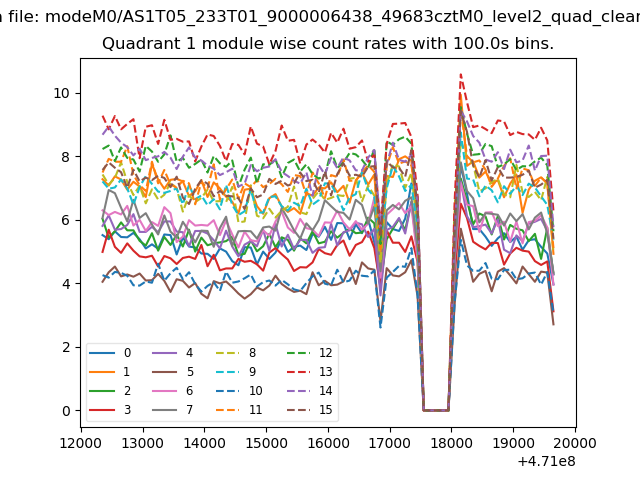
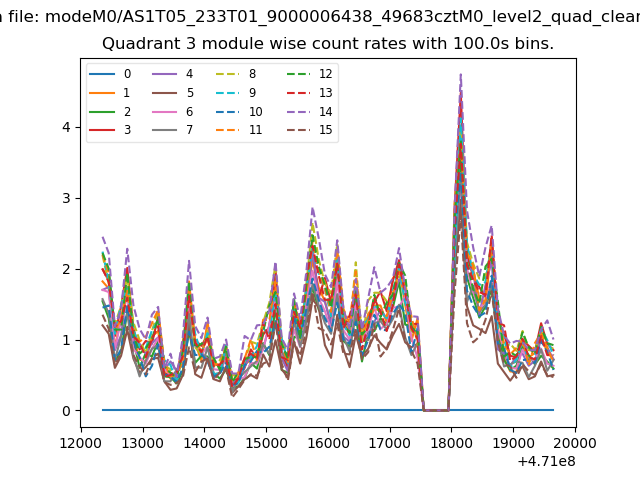
| Module-wise count rates for Quadrant A Data is divided into 100 sec bins |
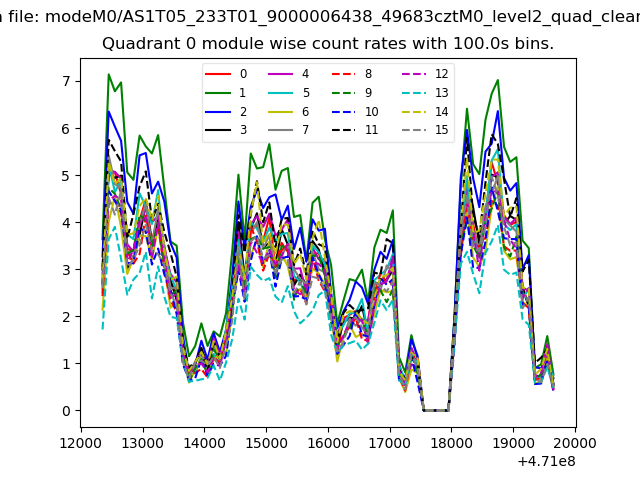 |
 |
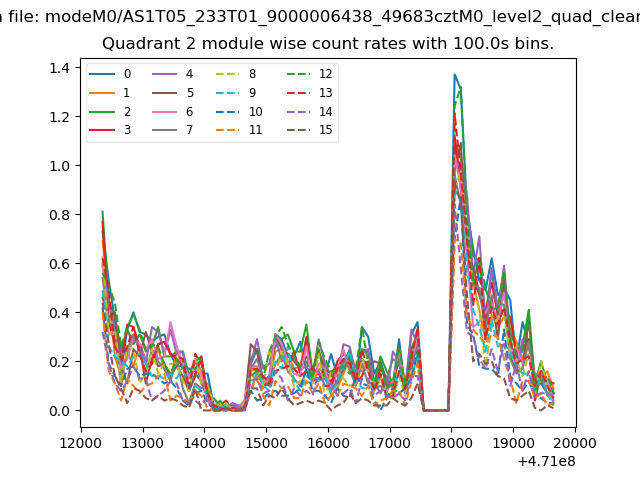
| Module-wise count rates for Quadrant B Data is divided into 100 sec bins |
 |
 |
| Module-wise count rates for Quadrant C Data is divided into 100 sec bins |
 |
 |
| Module-wise count rates for Quadrant D Data is divided into 100 sec bins |
 |
 |
| Parameter | Plot |
|---|---|
| CZT HV Monitor | 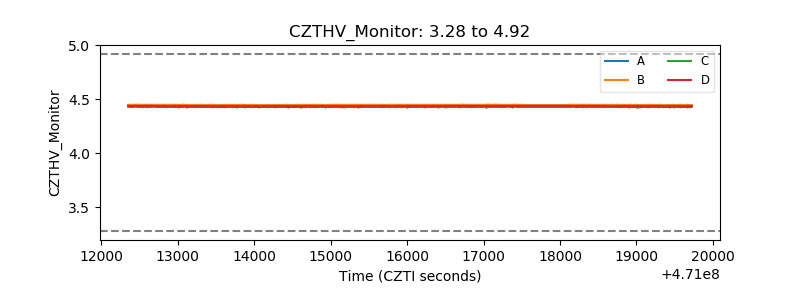 |
| D_VDD | 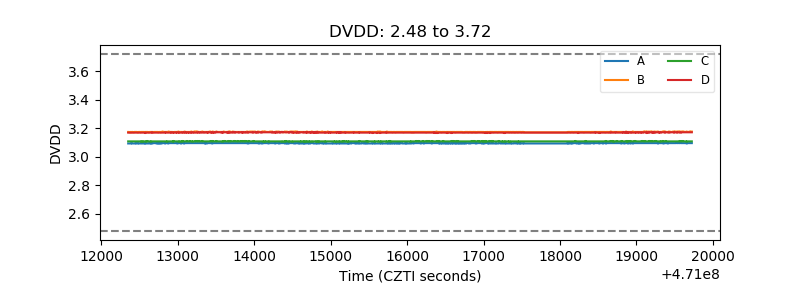 |
| Temperature 1 | 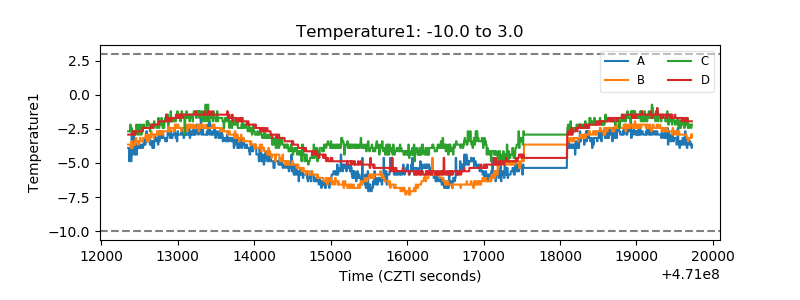 |
| Veto HV Monitor | 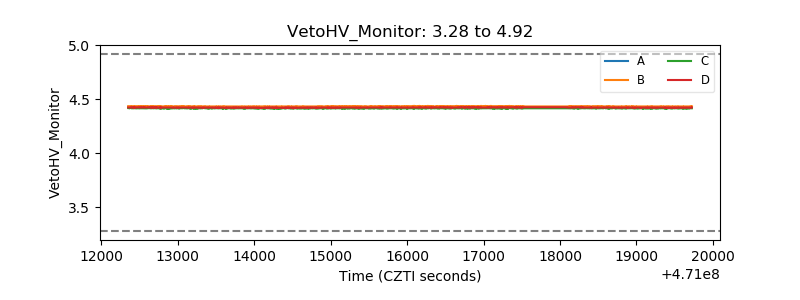 |
| Veto LLD | 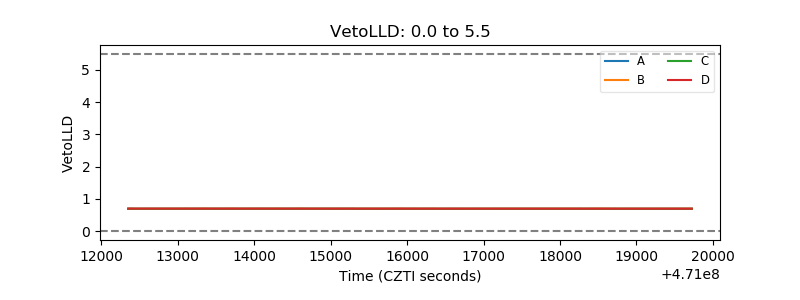 |
| Alpha Counter | 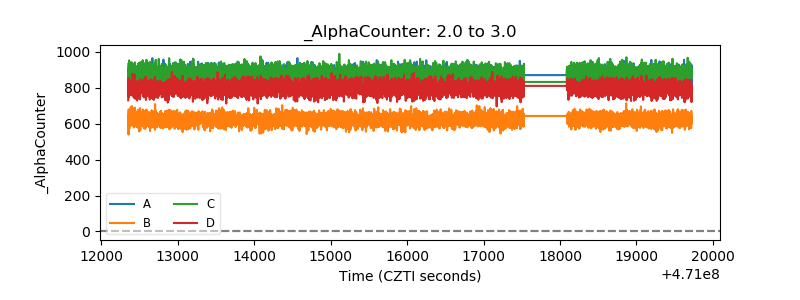 |
| _CPM_Rate | 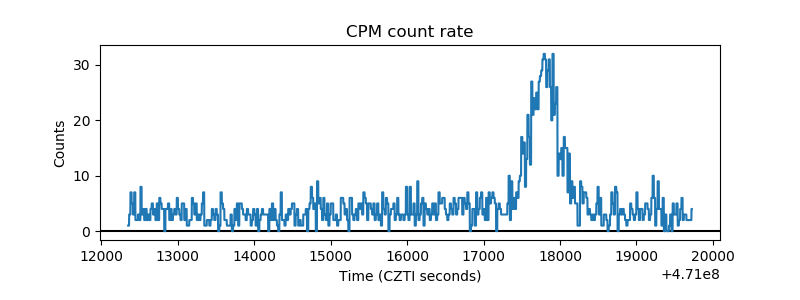 |
| CZT Counter | 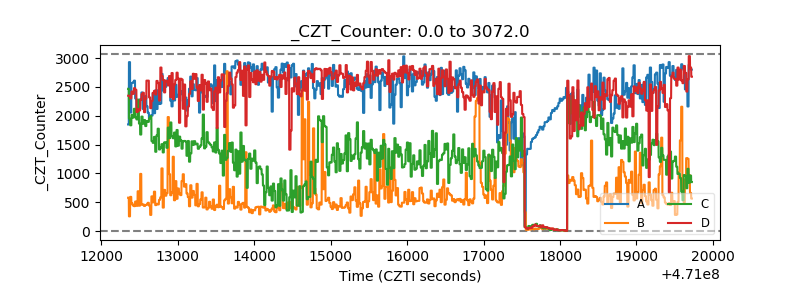 |
| +2.5 Volts monitor | 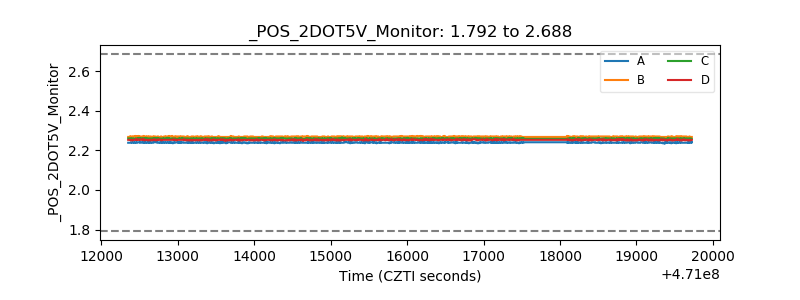 |
| +5 Volts monitor | 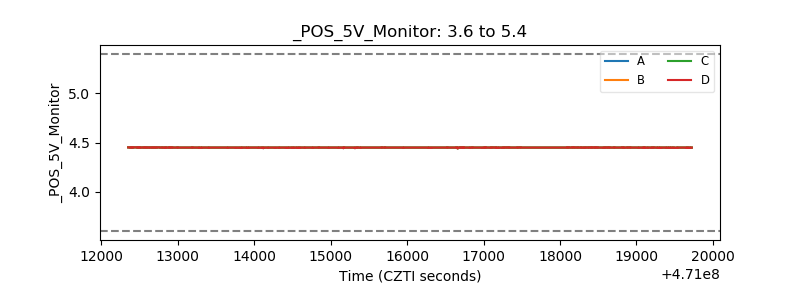 |
| _ROLL_ROT | 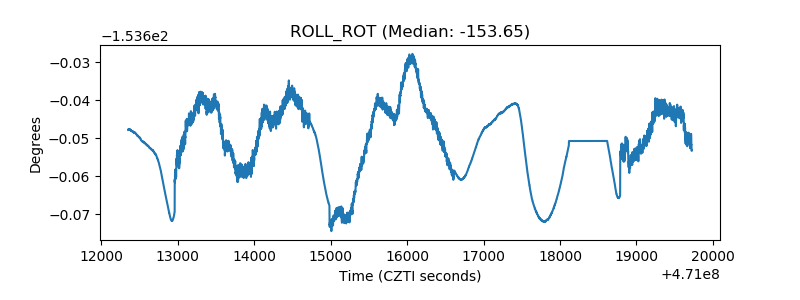 |
| _Roll_DEC | 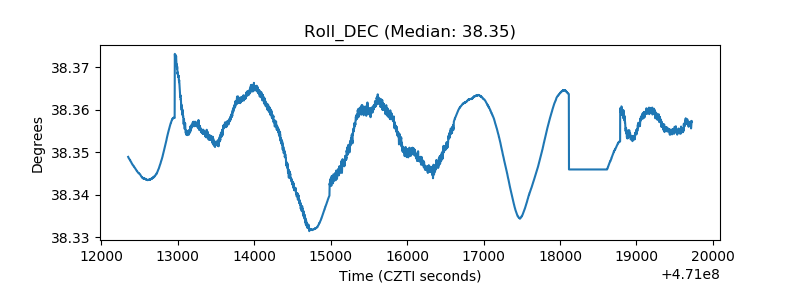 |
| _Roll_RA | 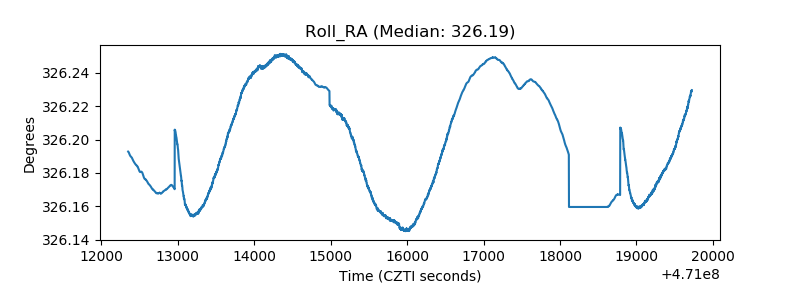 |
| Veto Counter | 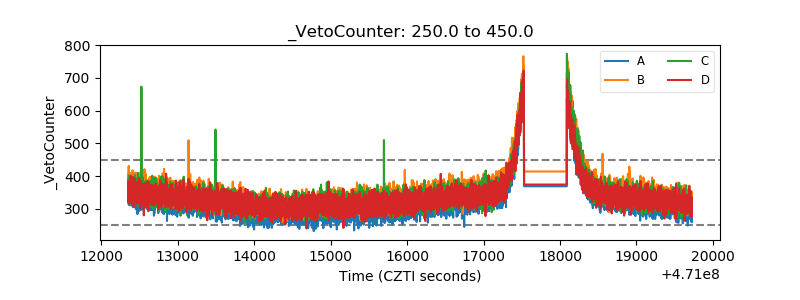 |