| Param | Original file | Final file |
|---|---|---|
| Filename | modeM0/AS1T05_233T01_9000006438_49684cztM0_level2.fits | modeM0/AS1T05_233T01_9000006438_49684cztM0_level2_quad_clean.evt |
| Size (bytes) | 1,446,402,240 | 54,221,760 |
| Size | 1.3 GB | 51.7 MB |
| Events in quadrant A | 19,426,298 | 275,034 |
| Events in quadrant B | 7,111,518 | 737,977 |
| Events in quadrant C | 8,073,104 | 3,843 |
| Events in quadrant D | 18,342,120 | 85,006 |
| Mode SS | |||
|---|---|---|---|
| Quadrant | BADHDUFLAG | Total packets | Discarded packets |
| A | 0 | 152 | 0 |
| B | 0 | 152 | 0 |
| C | 0 | 152 | 0 |
| D | 0 | 152 | 0 |
| Mode M0 | |||
|---|---|---|---|
| Quadrant | BADHDUFLAG | Total packets | Discarded packets |
| A | 0 | 62907 | 0 |
| B | 0 | 26409 | 0 |
| C | 0 | 29401 | 0 |
| D | 0 | 59663 | 0 |
| Quadrant | Total seconds | Saturated seconds | Saturation percentage |
|---|---|---|---|
| A | 7596 | 7431 | 97.827804% |
| B | 7596 | 922 | 12.137967% |
| C | 7597 | 7597 | 100.000000% |
| D | 7597 | 7589 | 99.894695% |
Noise dominated data is calculated using 1-second bins in cleaned event files. If a bin has >2000 counts, and if more than 50% of those come from <1% of pixels, then it is considered to be noise-dominated and hence unusable.
| Quadrant | # 1 sec bins | Bins with >0 counts | Bins with >2000 counts | High rate bins dominated by noise | Noise dominated (total time) | Noise dominated (detector-on time) | Marked lightcurve |
|---|---|---|---|---|---|---|---|
| A | 7595 | 7595 | 7122 | 7122 | 93.77% | 93.77% | 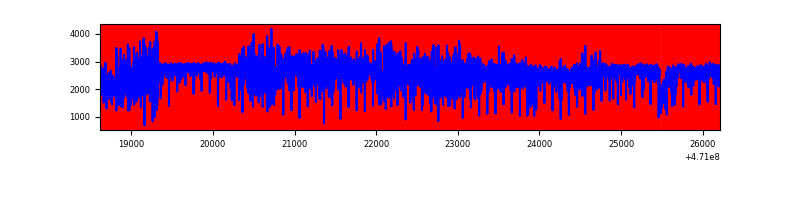 |
| B | 7596 | 7596 | 708 | 708 | 9.32% | 9.32% | 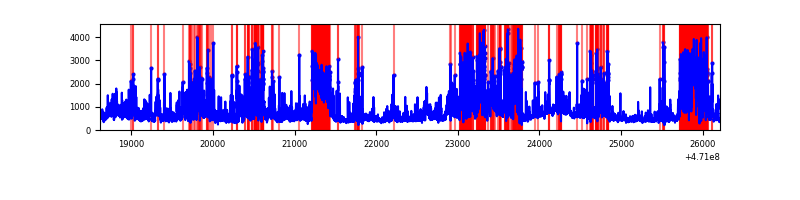 |
| C | 7596 | 7596 | 1 | 1 | 0.01% | 0.01% | 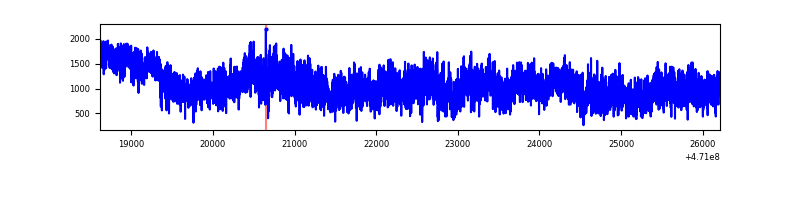 |
| D | 7596 | 7596 | 6938 | 6938 | 91.34% | 91.34% | 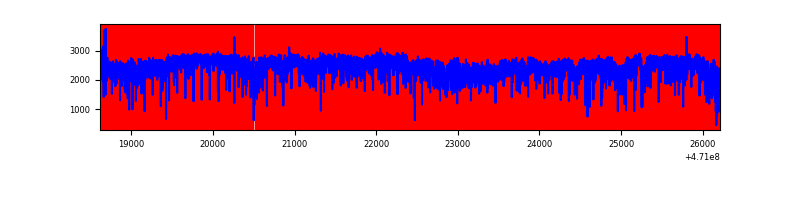 |
Top three noisy pixels from each quadrant. If the there are fewer than three noisy pixels in the level2.evt file, extra rows are filled as -1
| Pixel properties | Quadrant properties | ||||||
|---|---|---|---|---|---|---|---|
| Quadrant | DetID | PixID | Counts | Sigma | Mean | Median | Sigma |
| A | 10 | 83 | 4825439 | 47180.76 | 337 | 326 | 102.3 |
| A | 3 | 130 | 3413925 | 33378.74 | 337 | 326 | 102.3 |
| A | 0 | 98 | 2584617 | 25269.63 | 337 | 326 | 102.3 |
| B | 4 | 206 | 946071 | 5708.01 | 778 | 753 | 165.6 |
| B | 10 | 44 | 714312 | 4308.61 | 778 | 753 | 165.6 |
| B | 10 | 128 | 711155 | 4289.55 | 778 | 753 | 165.6 |
| C | 15 | 180 | 1694242 | 114438.94 | 25 | 23 | 14.8 |
| C | 15 | 190 | 1460253 | 98633.75 | 25 | 23 | 14.8 |
| C | 15 | 181 | 888669 | 60025.12 | 25 | 23 | 14.8 |
| D | 15 | 140 | 3571584 | 58940.93 | 126 | 117 | 60.6 |
| D | 15 | 40 | 2538213 | 41886.91 | 126 | 117 | 60.6 |
| D | 8 | 176 | 1565460 | 25833.3 | 126 | 117 | 60.6 |
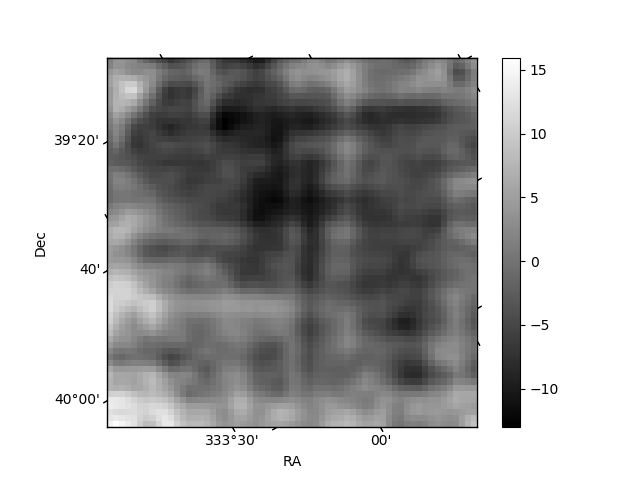
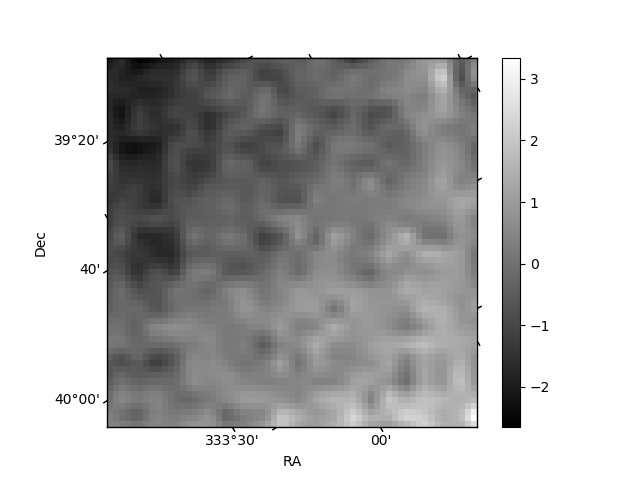
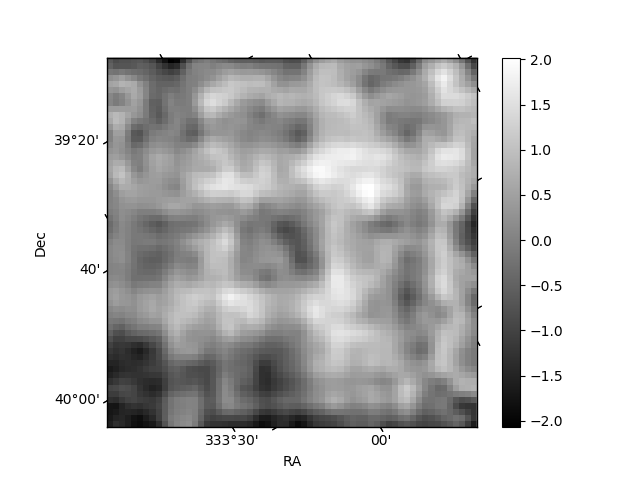
Histogram calculated using DETX and DETY for each event in the final _common_clean file
| Quadrant A | 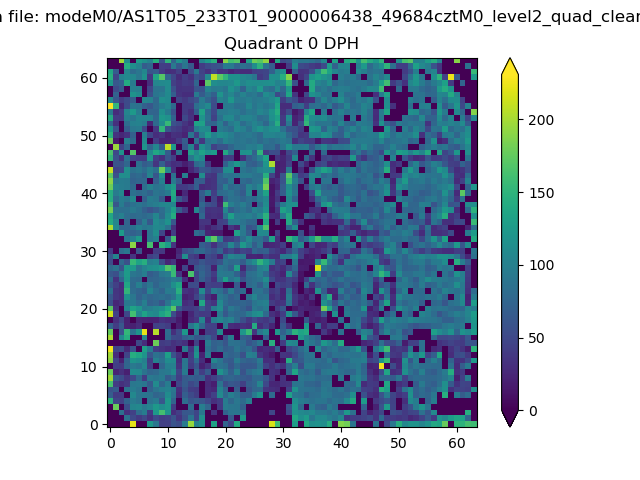 |
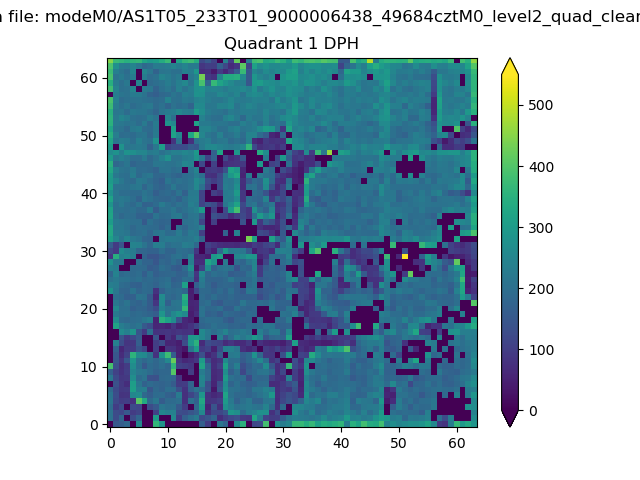 |
Quadrant B |
|---|---|---|---|
| Quadrant D | 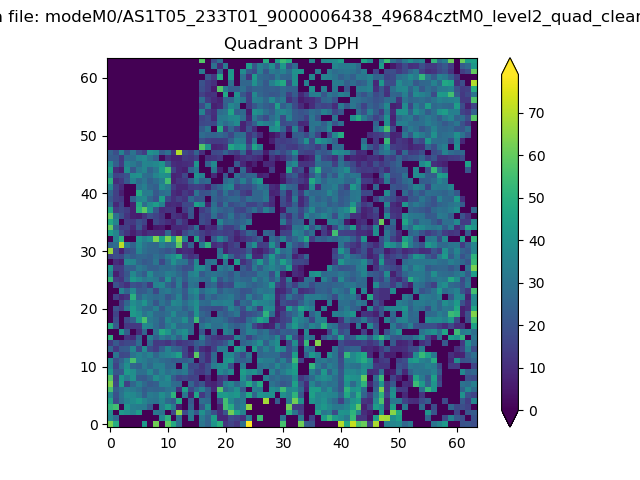 |
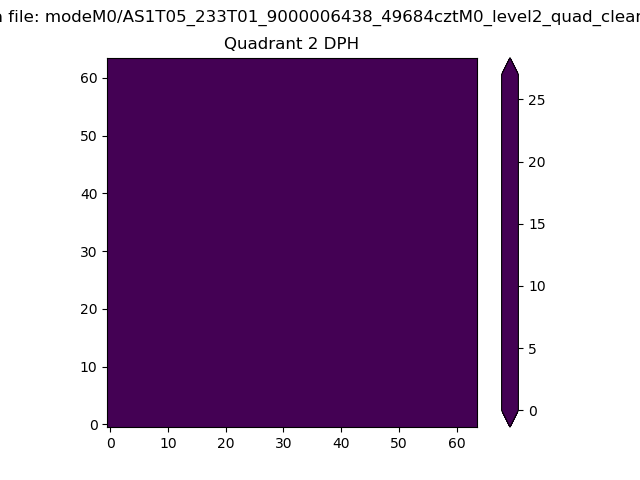 |
Quadrant C |
| Plot type | Count rate plots | Images |
|---|---|---|
| Comparison with Poisson distribution Blue bars denote a histogram of data divided into 1 sec bins. Red curve is a Poisson curve with rate = median count rate of data. |
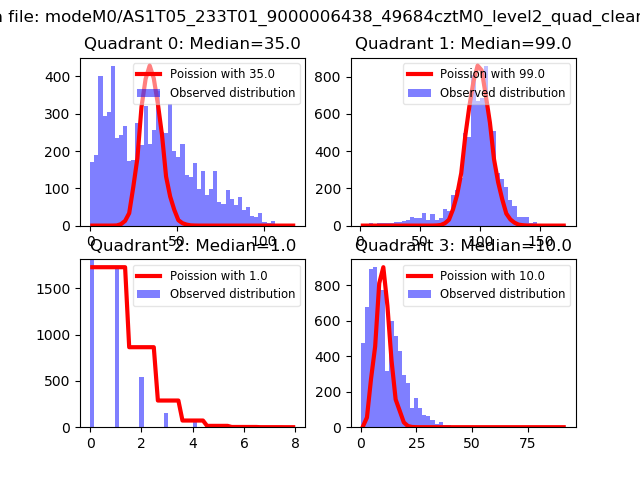 |
 |
| Quadrant-wise count rates Data is divided into 100 sec bins |
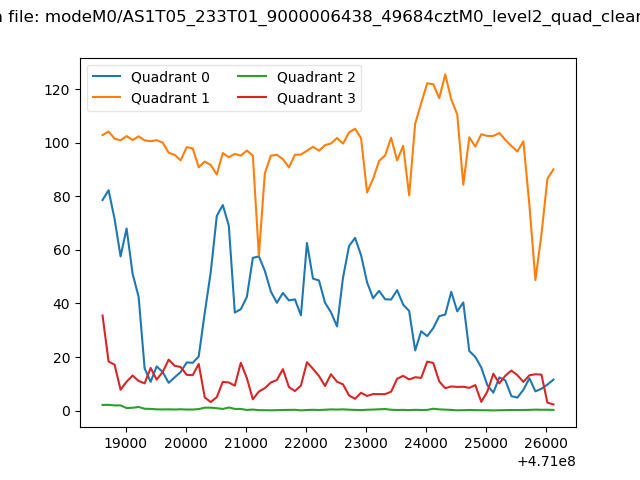 |
|
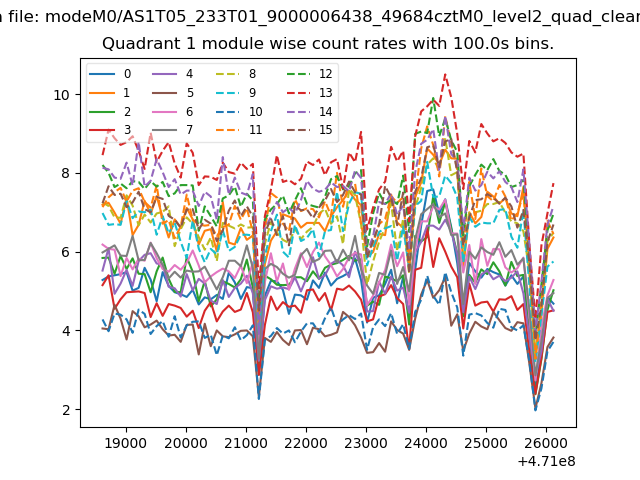
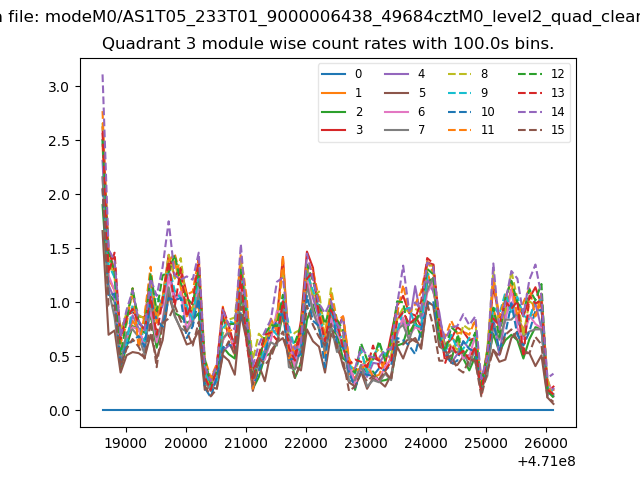
| Module-wise count rates for Quadrant A Data is divided into 100 sec bins |
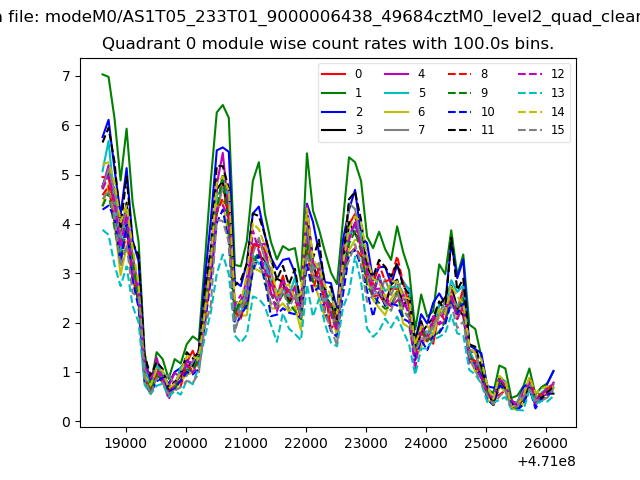 |
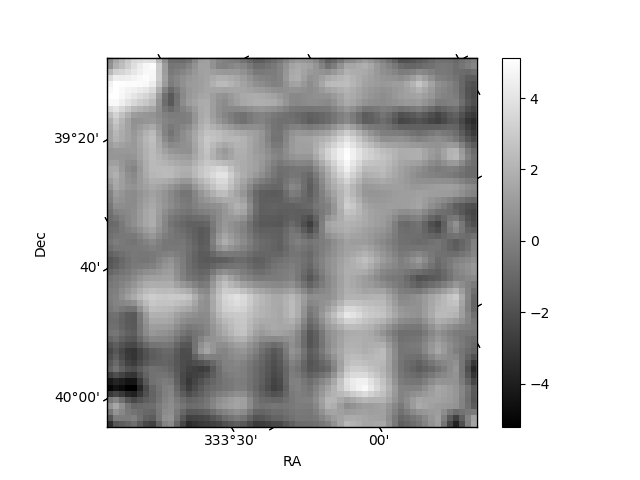 |
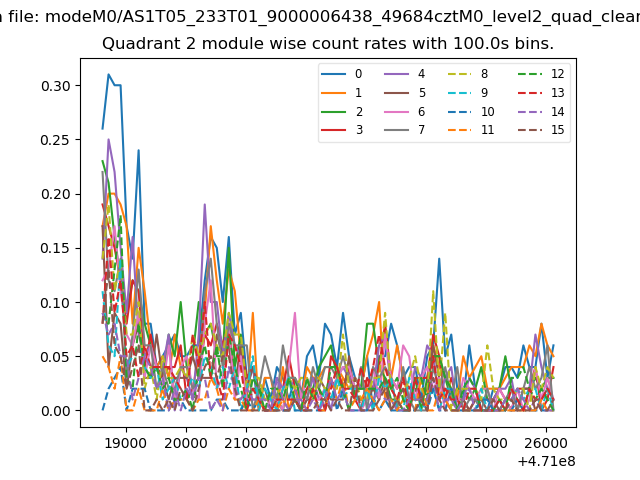
| Module-wise count rates for Quadrant B Data is divided into 100 sec bins |
 |
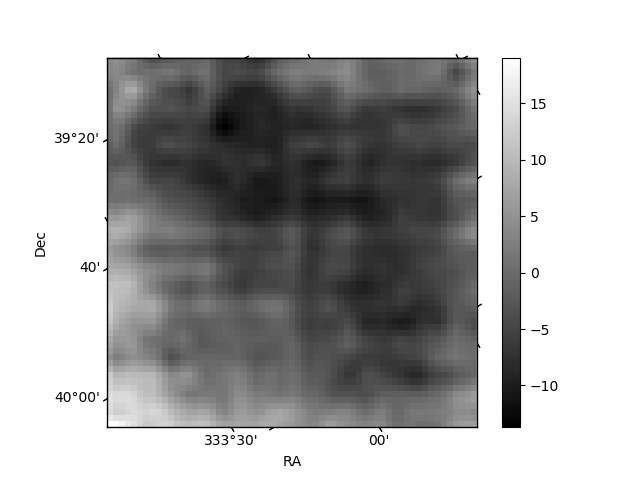 |
| Module-wise count rates for Quadrant C Data is divided into 100 sec bins |
 |
 |
| Module-wise count rates for Quadrant D Data is divided into 100 sec bins |
 |
 |
| Parameter | Plot |
|---|---|
| CZT HV Monitor | 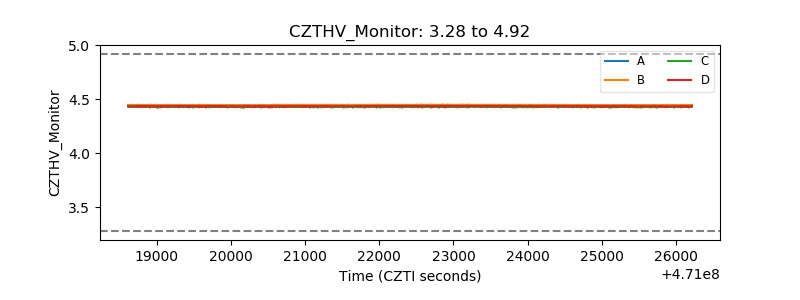 |
| D_VDD | 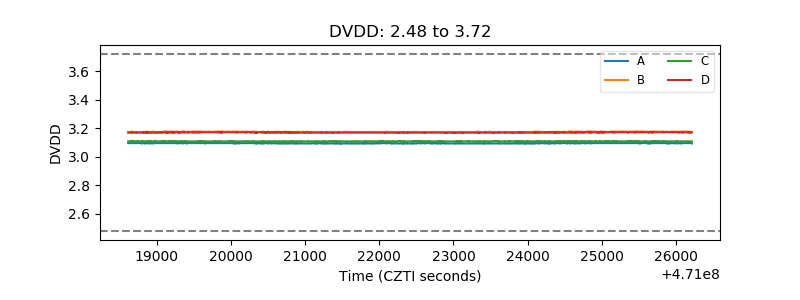 |
| Temperature 1 | 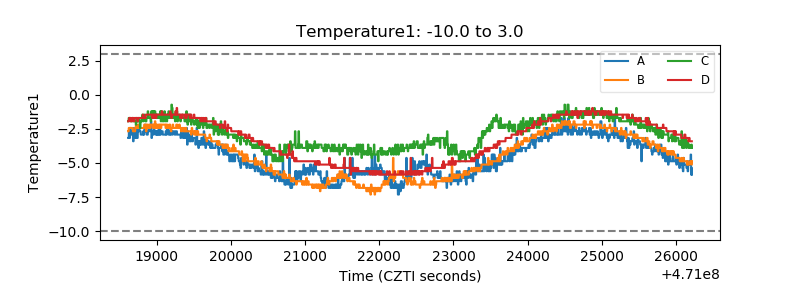 |
| Veto HV Monitor | 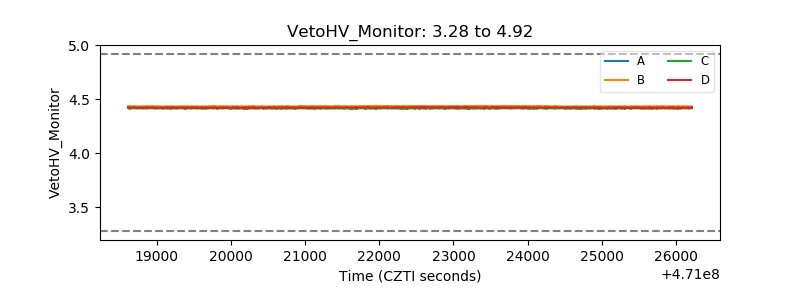 |
| Veto LLD | 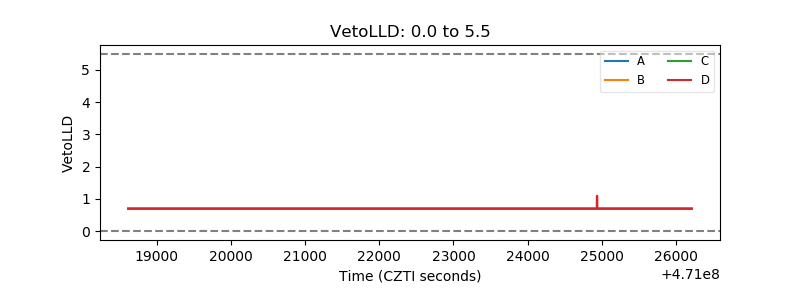 |
| Alpha Counter | 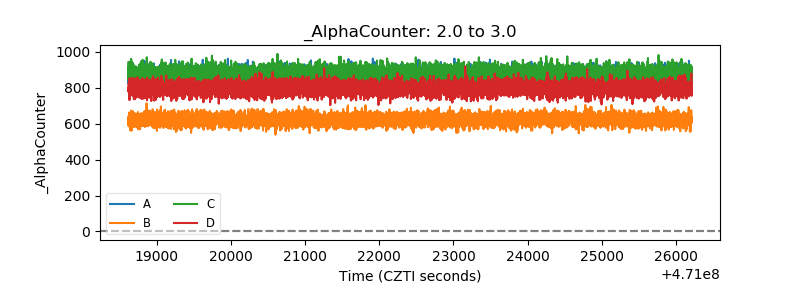 |
| _CPM_Rate | 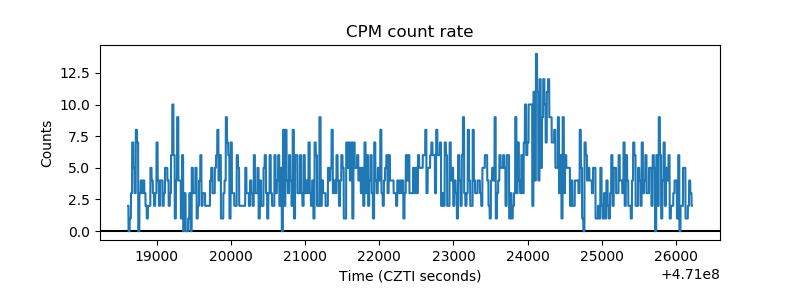 |
| CZT Counter | 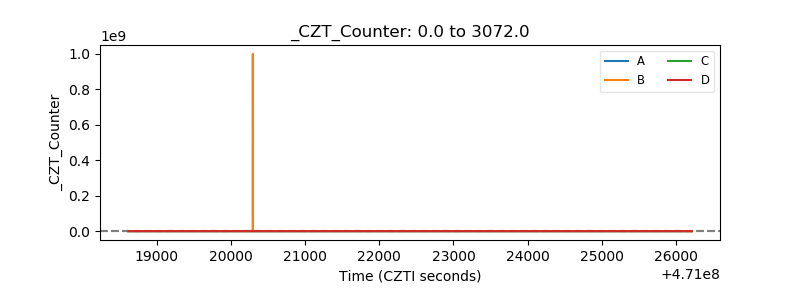 |
| +2.5 Volts monitor | 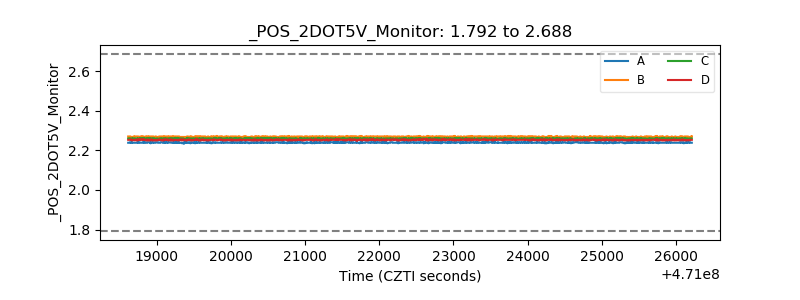 |
| +5 Volts monitor | 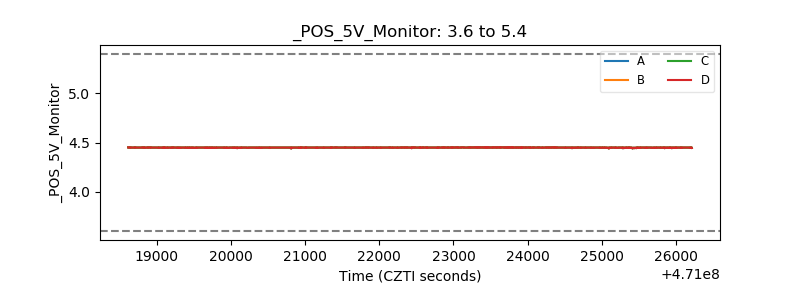 |
| _ROLL_ROT | 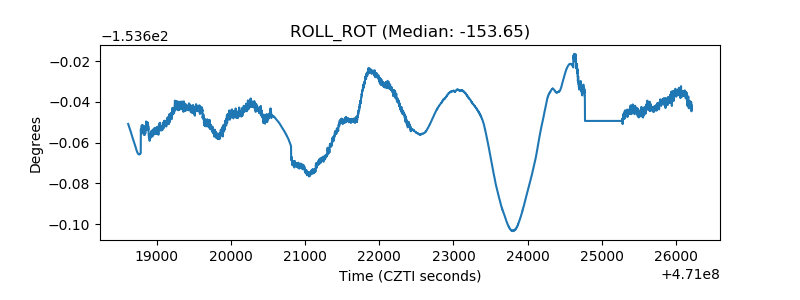 |
| _Roll_DEC | 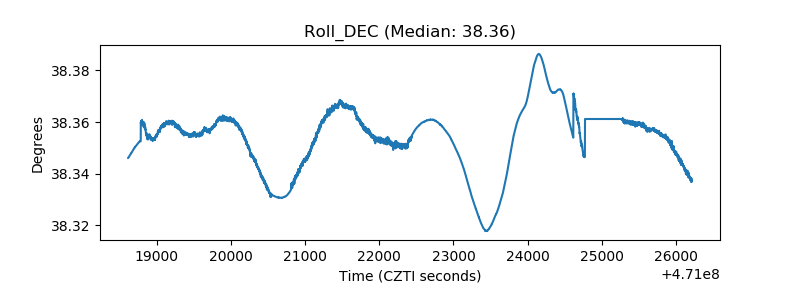 |
| _Roll_RA | 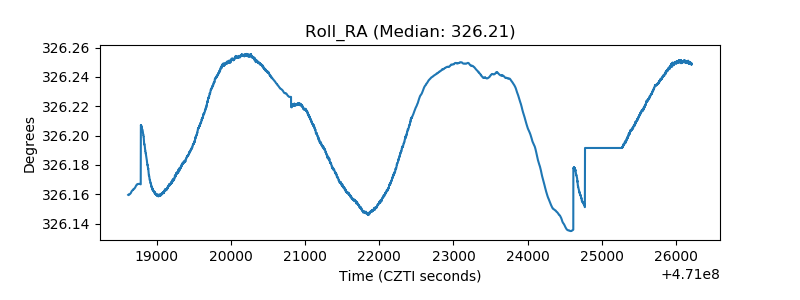 |
| Veto Counter | 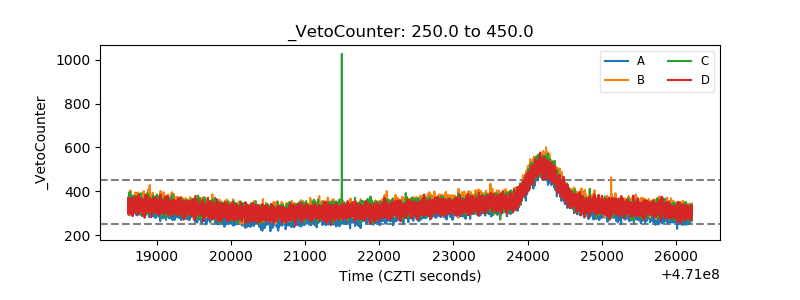 |