| Param | Original file | Final file |
|---|---|---|
| Filename | modeM0/AS1T05_233T01_9000006438_49685cztM0_level2.fits | modeM0/AS1T05_233T01_9000006438_49685cztM0_level2_quad_clean.evt |
| Size (bytes) | 1,253,986,560 | 47,252,160 |
| Size | 1.2 GB | 45.1 MB |
| Events in quadrant A | 18,263,632 | 133,716 |
| Events in quadrant B | 5,367,015 | 692,111 |
| Events in quadrant C | 5,535,149 | 4,649 |
| Events in quadrant D | 16,703,639 | 97,917 |
| Mode SS | |||
|---|---|---|---|
| Quadrant | BADHDUFLAG | Total packets | Discarded packets |
| A | 0 | 140 | 0 |
| B | 0 | 140 | 0 |
| C | 0 | 140 | 0 |
| D | 0 | 140 | 0 |
| Mode M0 | |||
|---|---|---|---|
| Quadrant | BADHDUFLAG | Total packets | Discarded packets |
| A | 0 | 59123 | 0 |
| B | 0 | 20733 | 0 |
| C | 0 | 21567 | 0 |
| D | 0 | 54417 | 0 |
| Quadrant | Total seconds | Saturated seconds | Saturation percentage |
|---|---|---|---|
| A | 7065 | 7065 | 100.000000% |
| B | 7066 | 534 | 7.557317% |
| C | 7066 | 7066 | 100.000000% |
| D | 7065 | 7064 | 99.985846% |
Noise dominated data is calculated using 1-second bins in cleaned event files. If a bin has >2000 counts, and if more than 50% of those come from <1% of pixels, then it is considered to be noise-dominated and hence unusable.
| Quadrant | # 1 sec bins | Bins with >0 counts | Bins with >2000 counts | High rate bins dominated by noise | Noise dominated (total time) | Noise dominated (detector-on time) | Marked lightcurve |
|---|---|---|---|---|---|---|---|
| A | 7064 | 7064 | 6858 | 6858 | 97.08% | 97.08% | 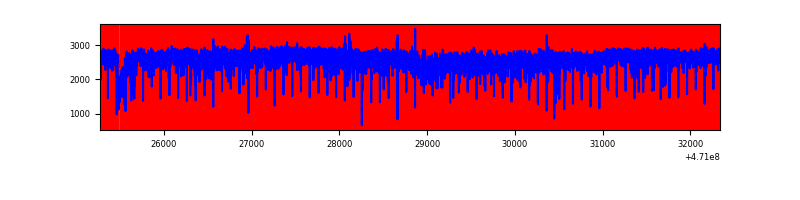 |
| B | 7066 | 7066 | 391 | 391 | 5.53% | 5.53% | 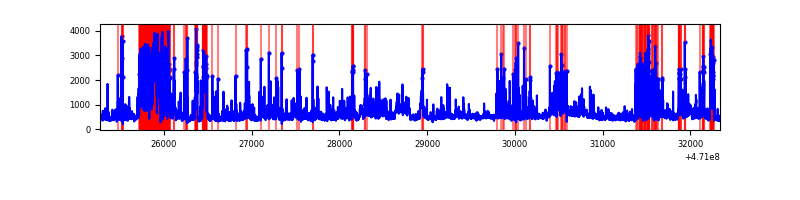 |
| C | 7065 | 7065 | 0 | 0 | 0.00% | 0.00% | 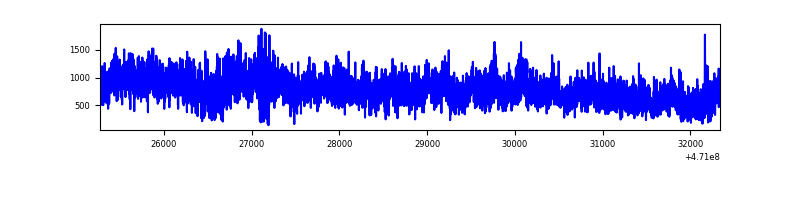 |
| D | 7064 | 7064 | 6310 | 6310 | 89.33% | 89.33% |  |
Top three noisy pixels from each quadrant. If the there are fewer than three noisy pixels in the level2.evt file, extra rows are filled as -1
| Pixel properties | Quadrant properties | ||||||
|---|---|---|---|---|---|---|---|
| Quadrant | DetID | PixID | Counts | Sigma | Mean | Median | Sigma |
| A | 0 | 98 | 6088274 | 114933.66 | 168 | 162 | 53.0 |
| A | 10 | 83 | 2887916 | 54516.1 | 168 | 162 | 53.0 |
| A | 0 | 99 | 2064798 | 38976.97 | 168 | 162 | 53.0 |
| B | 3 | 232 | 592355 | 3826.99 | 720 | 697 | 154.6 |
| B | 10 | 44 | 538325 | 3477.51 | 720 | 697 | 154.6 |
| B | 7 | 252 | 213180 | 1374.39 | 720 | 697 | 154.6 |
| C | 15 | 190 | 919579 | 64318.86 | 12 | 10 | 14.3 |
| C | 15 | 181 | 810719 | 56704.69 | 12 | 10 | 14.3 |
| C | 15 | 180 | 747215 | 52262.93 | 12 | 10 | 14.3 |
| D | 7 | 45 | 2424330 | 36047.09 | 140 | 130 | 67.3 |
| D | 12 | 191 | 1834726 | 27279.87 | 140 | 130 | 67.3 |
| D | 7 | 60 | 1477721 | 21971.31 | 140 | 130 | 67.3 |
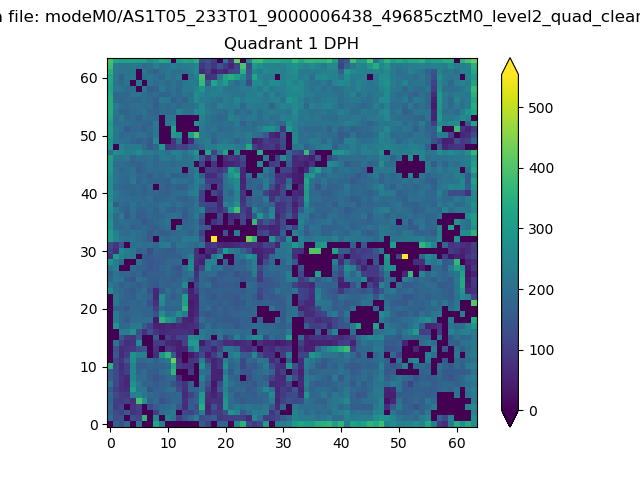
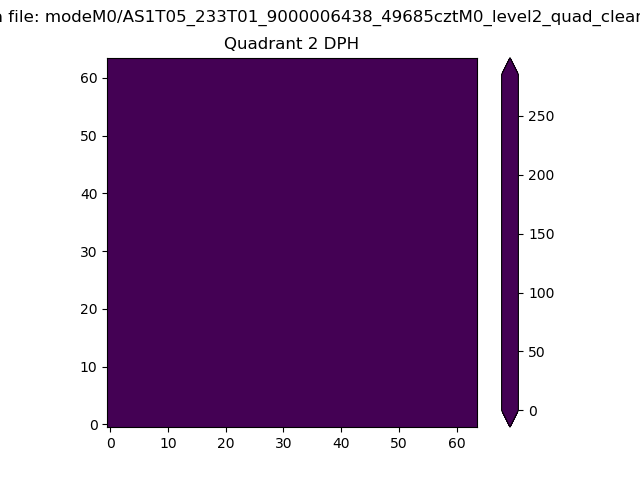
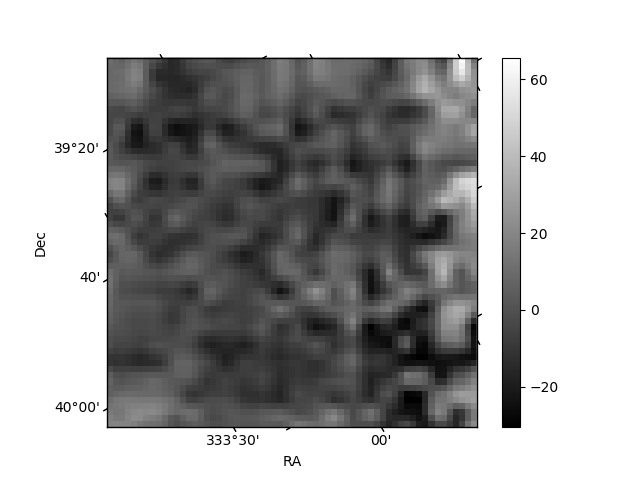
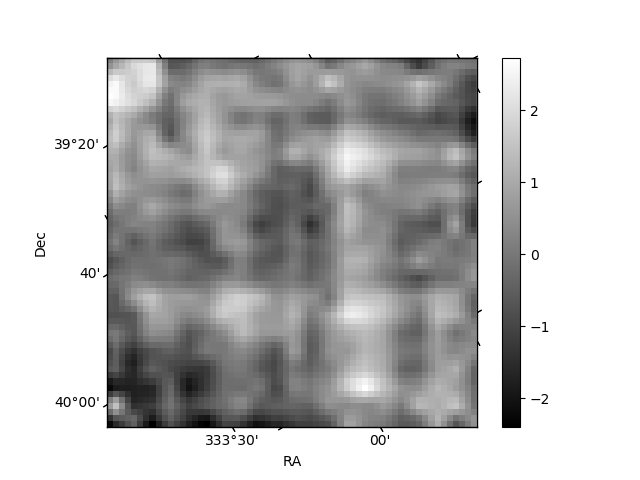
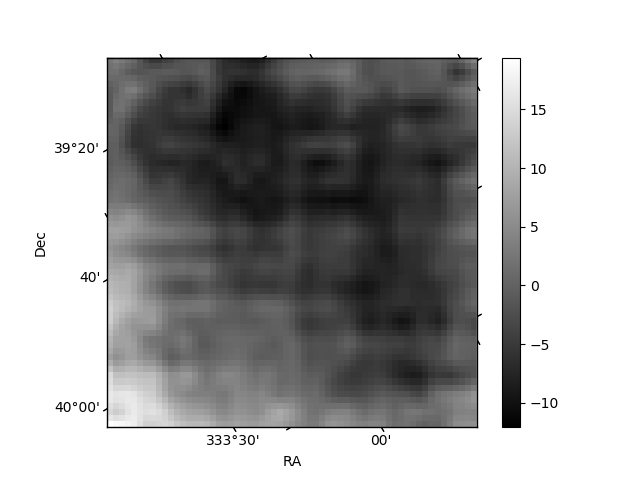
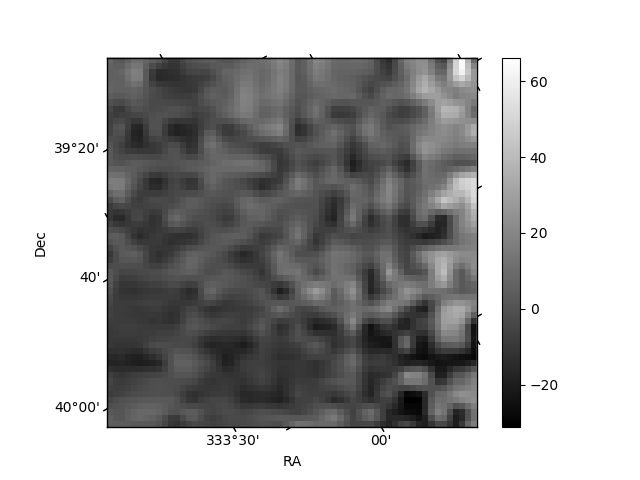
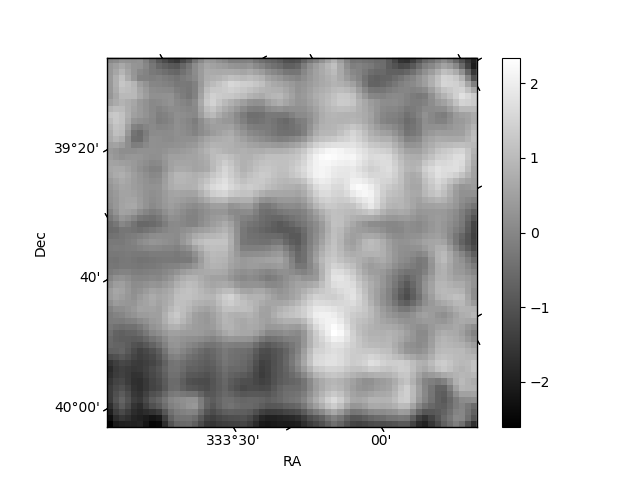
Histogram calculated using DETX and DETY for each event in the final _common_clean file
| Quadrant A | 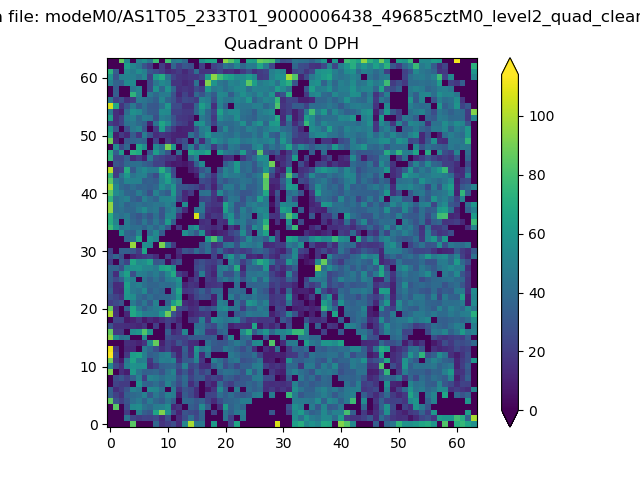 |
 |
Quadrant B |
|---|---|---|---|
| Quadrant D | 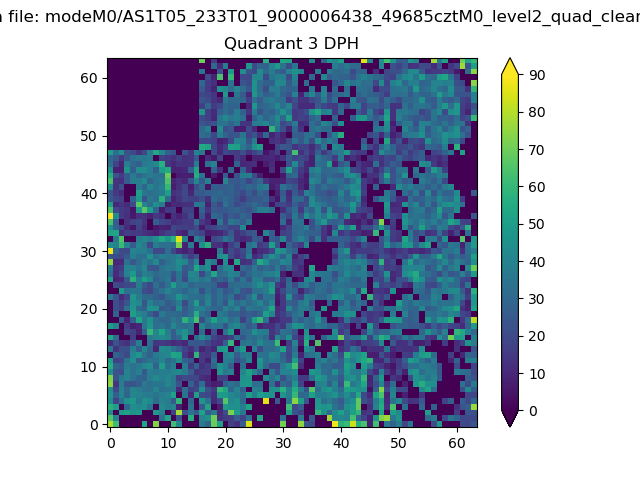 |
 |
Quadrant C |
| Plot type | Count rate plots | Images |
|---|---|---|
| Comparison with Poisson distribution Blue bars denote a histogram of data divided into 1 sec bins. Red curve is a Poisson curve with rate = median count rate of data. |
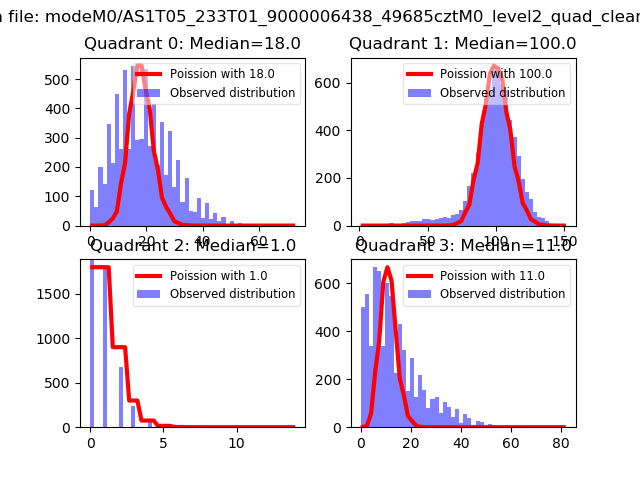 |
 |
| Quadrant-wise count rates Data is divided into 100 sec bins |
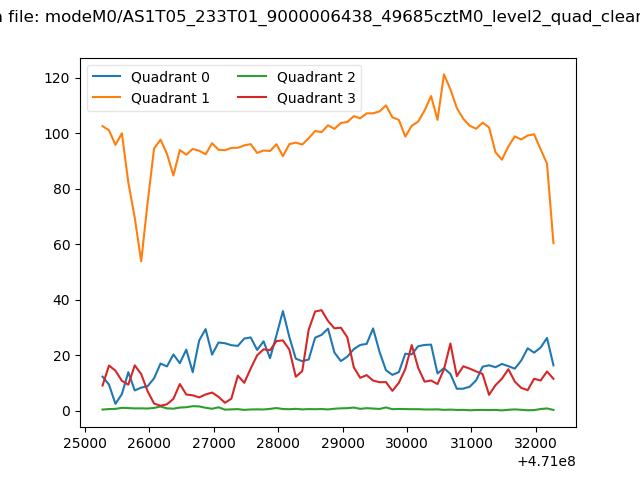 |
|
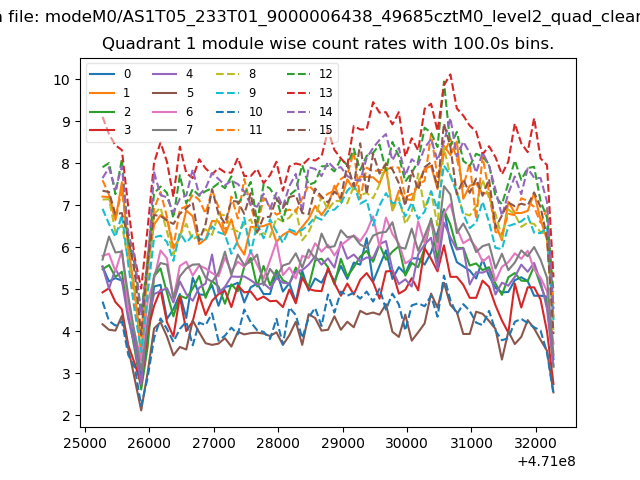
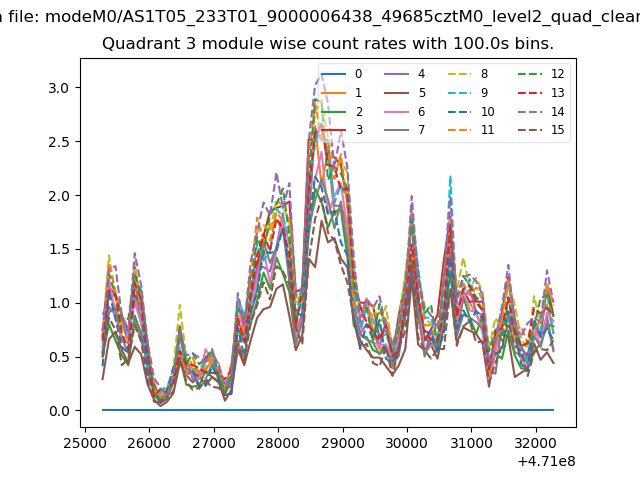
| Module-wise count rates for Quadrant A Data is divided into 100 sec bins |
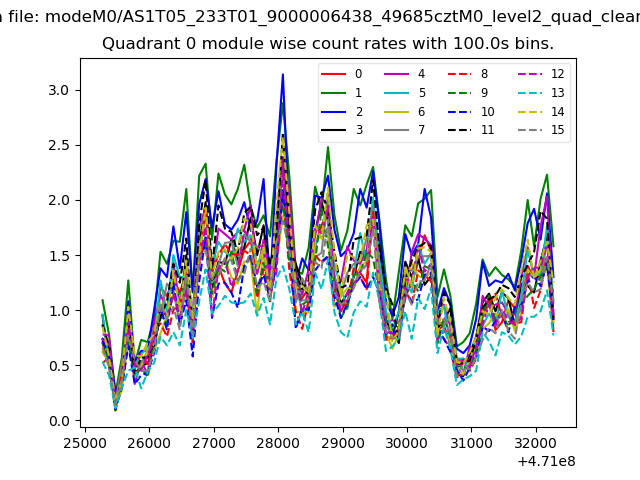 |
 |
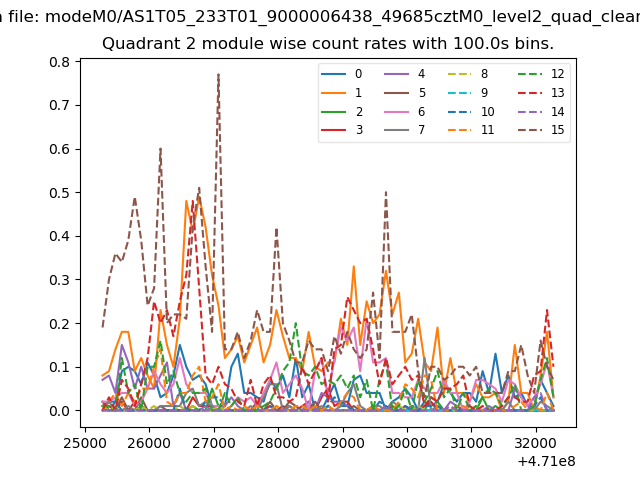
| Module-wise count rates for Quadrant B Data is divided into 100 sec bins |
 |
 |
| Module-wise count rates for Quadrant C Data is divided into 100 sec bins |
 |
 |
| Module-wise count rates for Quadrant D Data is divided into 100 sec bins |
 |
 |
| Parameter | Plot |
|---|---|
| CZT HV Monitor | 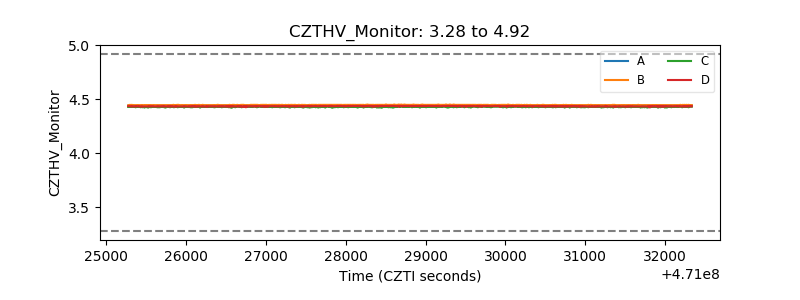 |
| D_VDD | 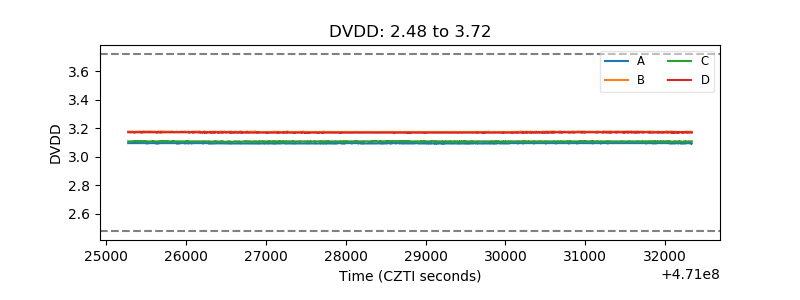 |
| Temperature 1 | 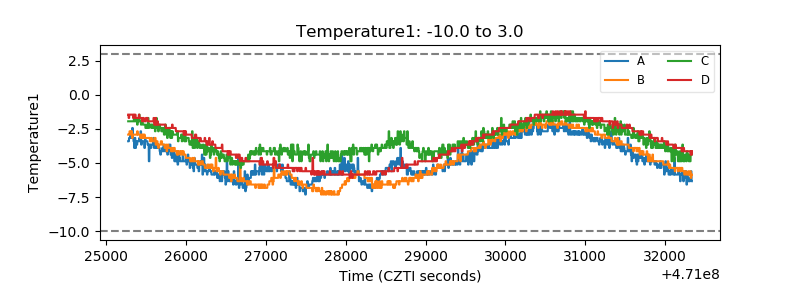 |
| Veto HV Monitor | 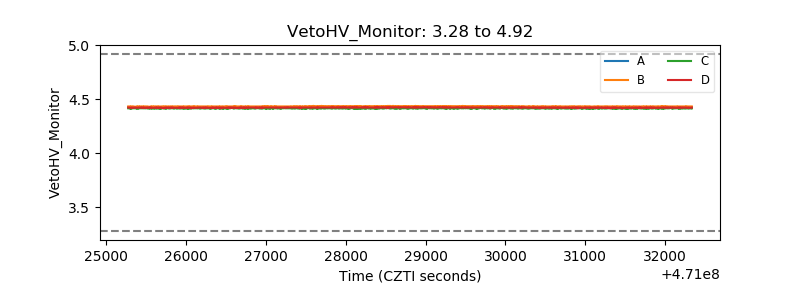 |
| Veto LLD | 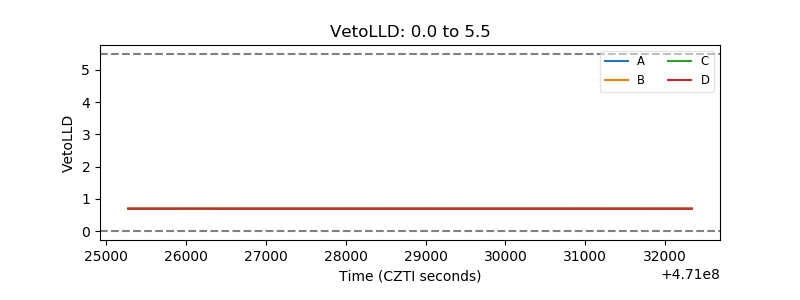 |
| Alpha Counter | 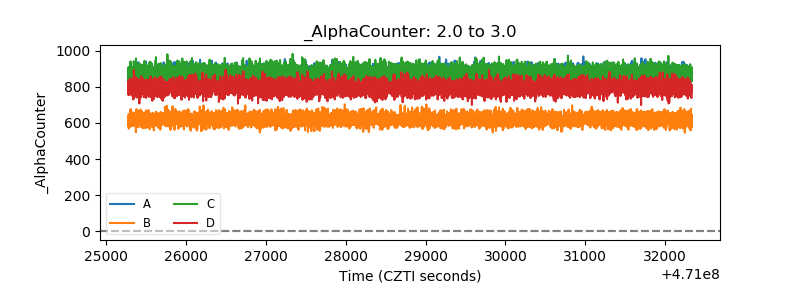 |
| _CPM_Rate | 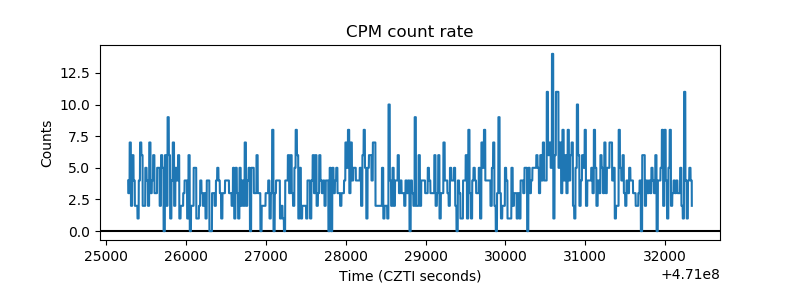 |
| CZT Counter | 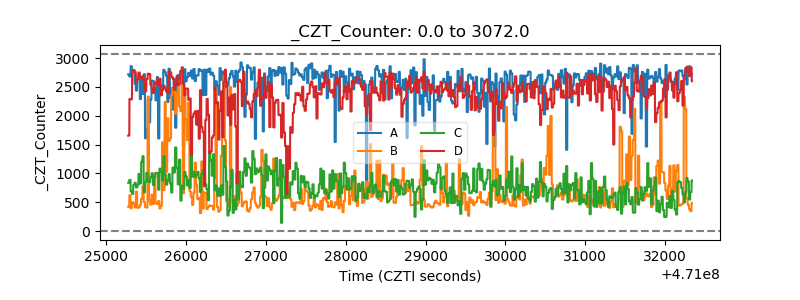 |
| +2.5 Volts monitor | 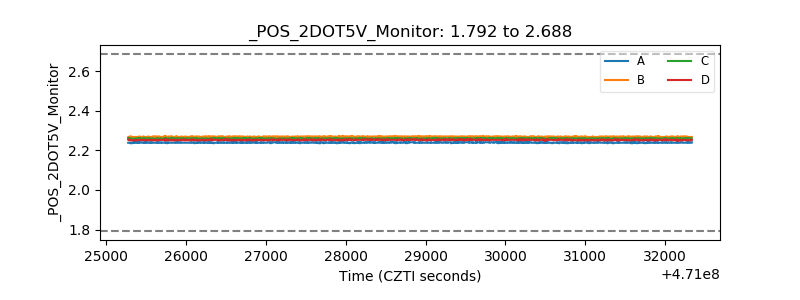 |
| +5 Volts monitor |  |
| _ROLL_ROT | 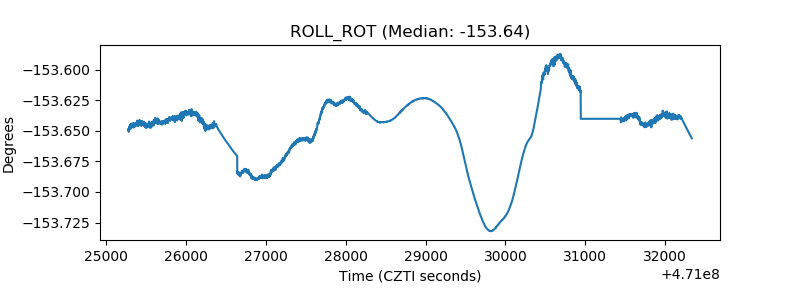 |
| _Roll_DEC | 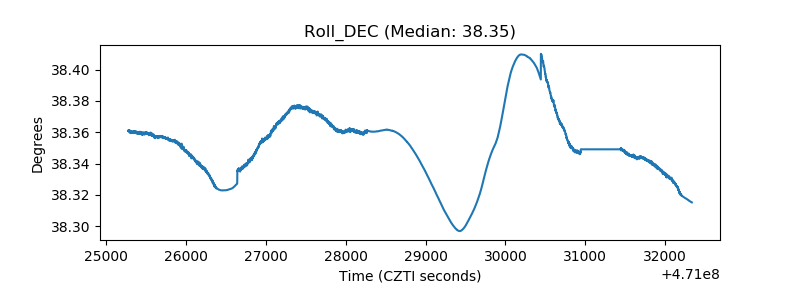 |
| _Roll_RA | 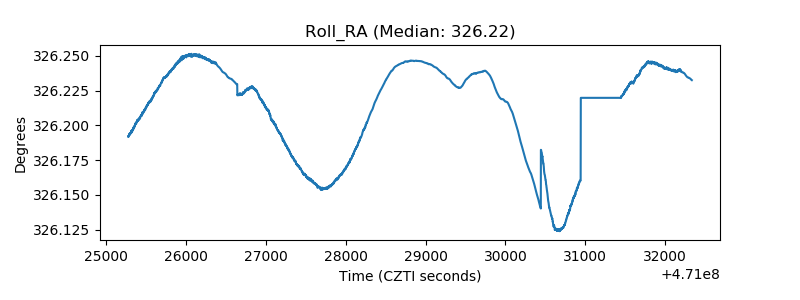 |
| Veto Counter | 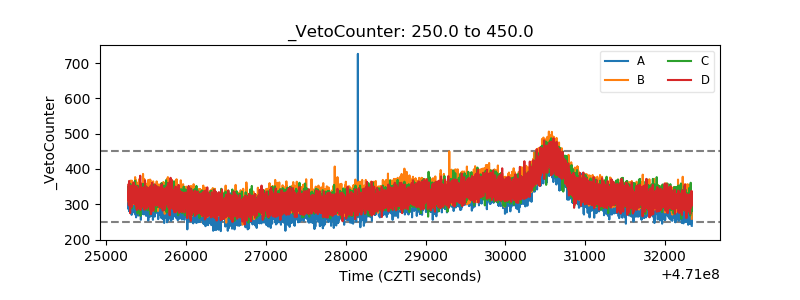 |