| Param | Original file | Final file |
|---|---|---|
| Filename | modeM0/AS1T05_233T01_9000006438_49686cztM0_level2.fits | modeM0/AS1T05_233T01_9000006438_49686cztM0_level2_quad_clean.evt |
| Size (bytes) | 1,246,268,160 | 46,177,920 |
| Size | 1.2 GB | 44.0 MB |
| Events in quadrant A | 18,772,507 | 114,695 |
| Events in quadrant B | 5,942,575 | 699,761 |
| Events in quadrant C | 4,235,832 | 2,609 |
| Events in quadrant D | 16,619,088 | 66,214 |
| Mode SS | |||
|---|---|---|---|
| Quadrant | BADHDUFLAG | Total packets | Discarded packets |
| A | 0 | 146 | 0 |
| B | 0 | 146 | 0 |
| C | 0 | 146 | 0 |
| D | 0 | 146 | 0 |
| Mode M0 | |||
|---|---|---|---|
| Quadrant | BADHDUFLAG | Total packets | Discarded packets |
| A | 0 | 60744 | 0 |
| B | 0 | 22696 | 0 |
| C | 0 | 17791 | 0 |
| D | 0 | 54337 | 0 |
| Quadrant | Total seconds | Saturated seconds | Saturation percentage |
|---|---|---|---|
| A | 7234 | 7234 | 100.000000% |
| B | 7234 | 718 | 9.925353% |
| C | 7235 | 7235 | 100.000000% |
| D | 7235 | 7235 | 100.000000% |
Noise dominated data is calculated using 1-second bins in cleaned event files. If a bin has >2000 counts, and if more than 50% of those come from <1% of pixels, then it is considered to be noise-dominated and hence unusable.
| Quadrant | # 1 sec bins | Bins with >0 counts | Bins with >2000 counts | High rate bins dominated by noise | Noise dominated (total time) | Noise dominated (detector-on time) | Marked lightcurve |
|---|---|---|---|---|---|---|---|
| A | 7233 | 7233 | 7095 | 7095 | 98.09% | 98.09% | 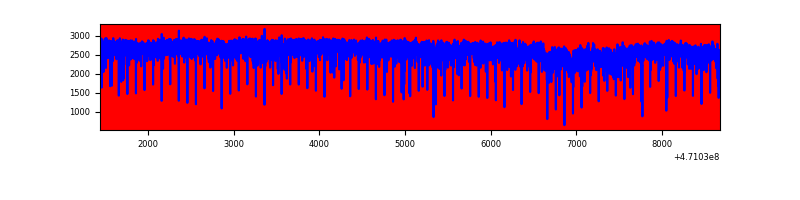 |
| B | 7234 | 7234 | 499 | 499 | 6.90% | 6.90% | 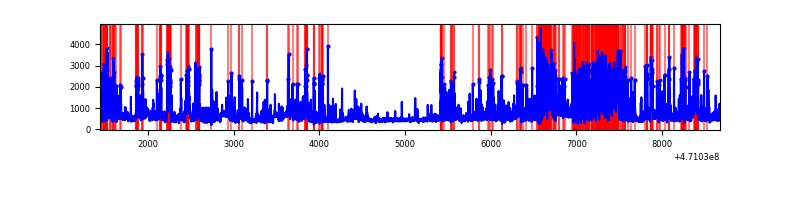 |
| C | 7234 | 7234 | 0 | 0 | 0.00% | 0.00% | 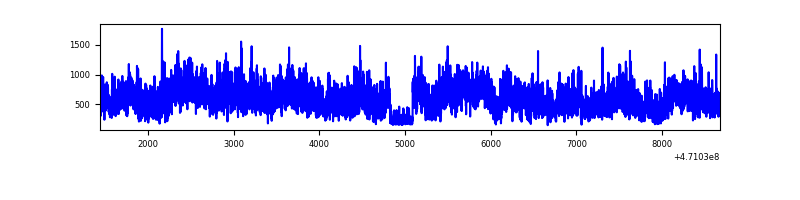 |
| D | 7234 | 7234 | 6010 | 6010 | 83.08% | 83.08% | 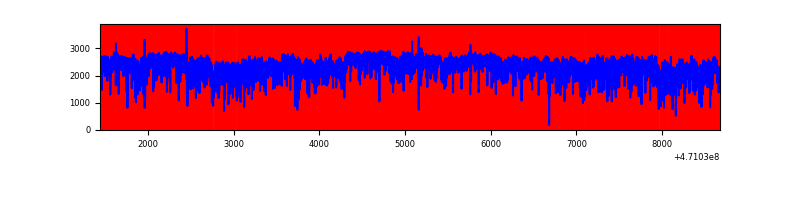 |
Top three noisy pixels from each quadrant. If the there are fewer than three noisy pixels in the level2.evt file, extra rows are filled as -1
| Pixel properties | Quadrant properties | ||||||
|---|---|---|---|---|---|---|---|
| Quadrant | DetID | PixID | Counts | Sigma | Mean | Median | Sigma |
| A | 0 | 99 | 5722227 | 89991.11 | 151 | 142 | 63.6 |
| A | 10 | 83 | 2924339 | 45988.78 | 151 | 142 | 63.6 |
| A | 0 | 98 | 2835864 | 44597.34 | 151 | 142 | 63.6 |
| B | 3 | 232 | 1204776 | 7679.16 | 732 | 709 | 156.8 |
| B | 10 | 44 | 367235 | 2337.59 | 732 | 709 | 156.8 |
| B | 4 | 206 | 244460 | 1554.57 | 732 | 709 | 156.8 |
| C | 15 | 190 | 731583 | 87993.13 | 8 | 7 | 8.3 |
| C | 4 | 210 | 712617 | 85711.92 | 8 | 7 | 8.3 |
| C | 15 | 180 | 464575 | 55877.71 | 8 | 7 | 8.3 |
| D | 15 | 184 | 3505389 | 57571.92 | 104 | 96 | 60.9 |
| D | 7 | 60 | 1619228 | 26593.08 | 104 | 96 | 60.9 |
| D | 12 | 191 | 1584509 | 26022.84 | 104 | 96 | 60.9 |
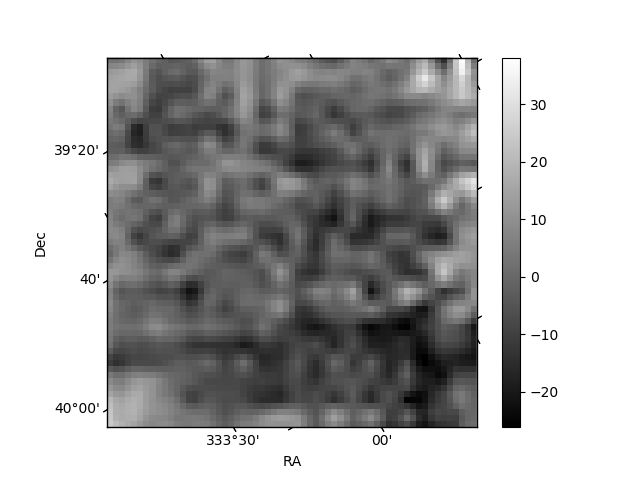
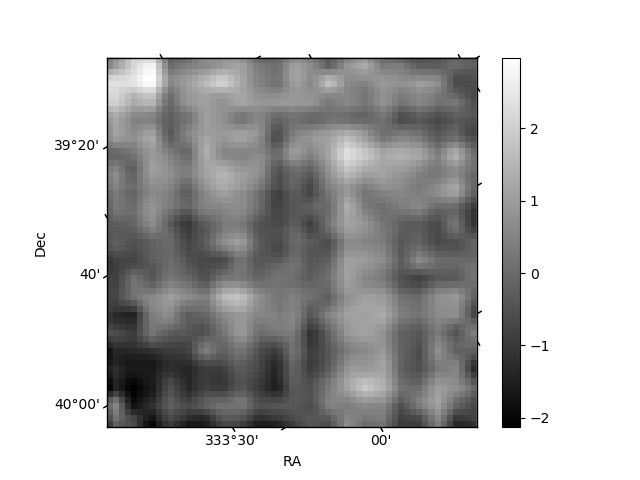
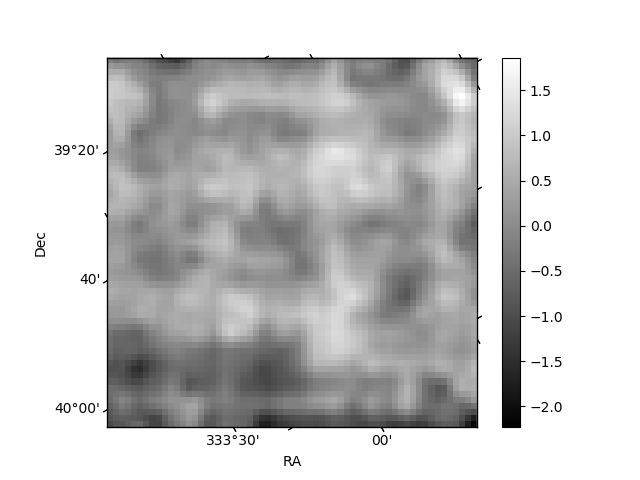
Histogram calculated using DETX and DETY for each event in the final _common_clean file
| Quadrant A | 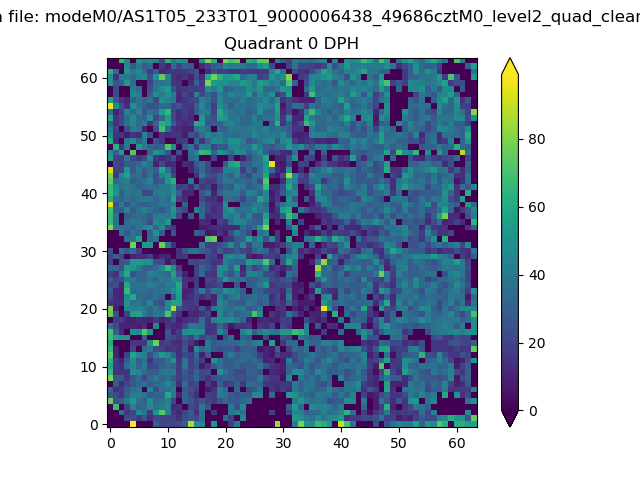 |
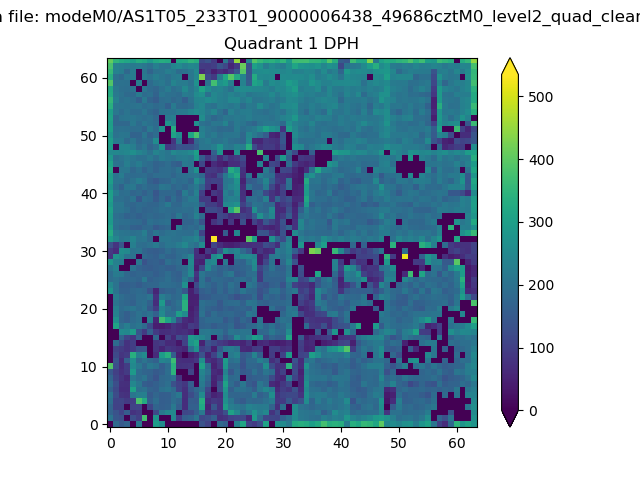 |
Quadrant B |
|---|---|---|---|
| Quadrant D | 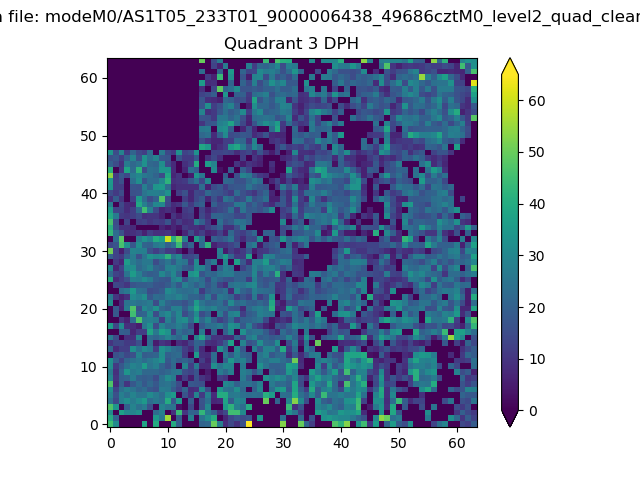 |
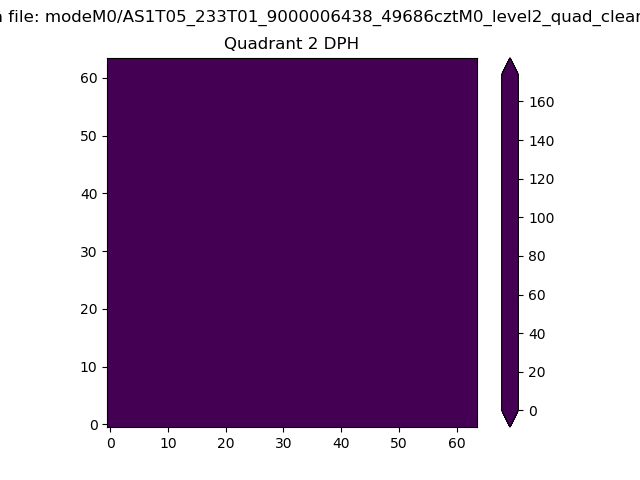 |
Quadrant C |
| Plot type | Count rate plots | Images |
|---|---|---|
| Comparison with Poisson distribution Blue bars denote a histogram of data divided into 1 sec bins. Red curve is a Poisson curve with rate = median count rate of data. |
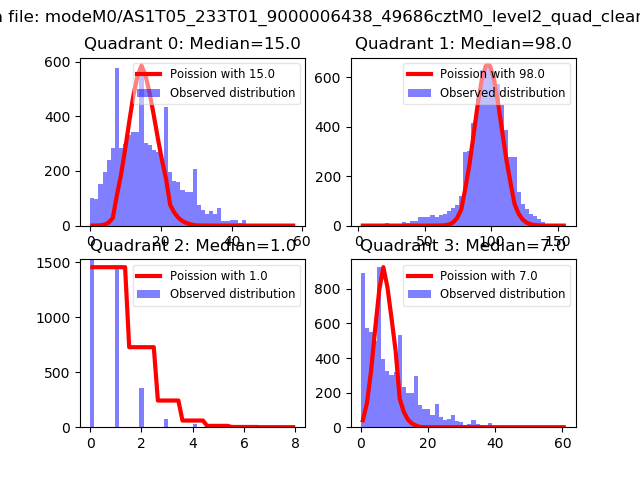 |
 |
| Quadrant-wise count rates Data is divided into 100 sec bins |
 |
|
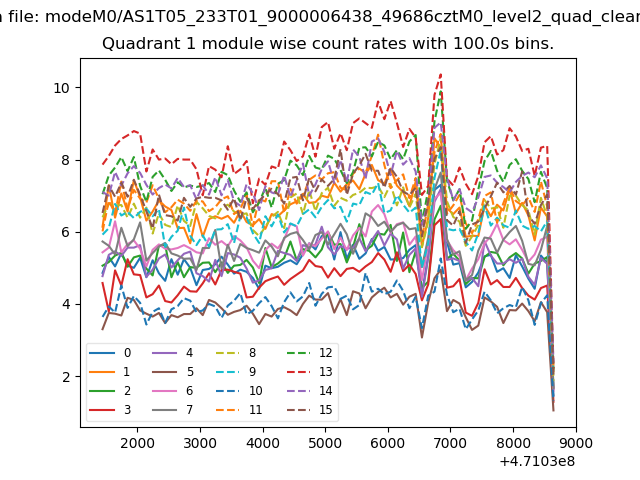
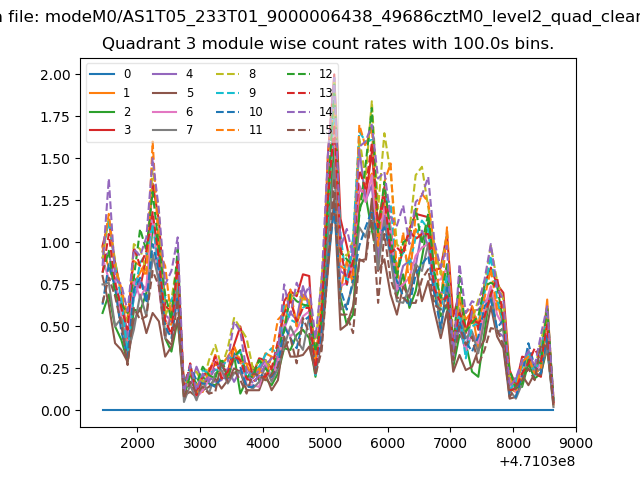
| Module-wise count rates for Quadrant A Data is divided into 100 sec bins |
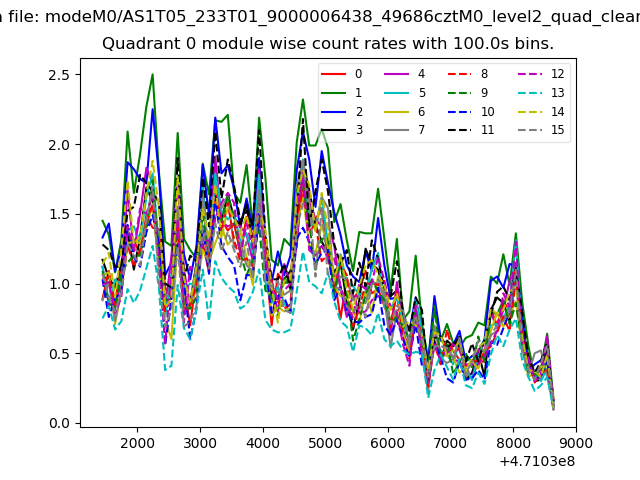 |
 |
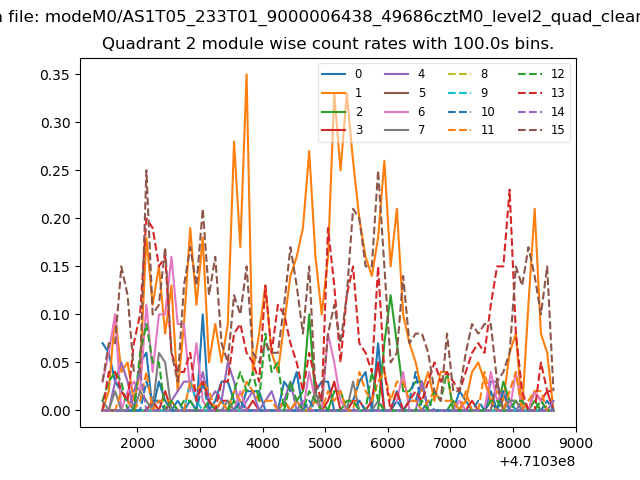
| Module-wise count rates for Quadrant B Data is divided into 100 sec bins |
 |
 |
| Module-wise count rates for Quadrant C Data is divided into 100 sec bins |
 |
 |
| Module-wise count rates for Quadrant D Data is divided into 100 sec bins |
 |
 |
| Parameter | Plot |
|---|---|
| CZT HV Monitor | 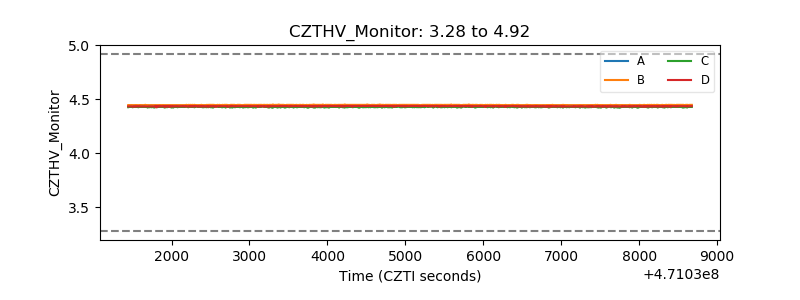 |
| D_VDD | 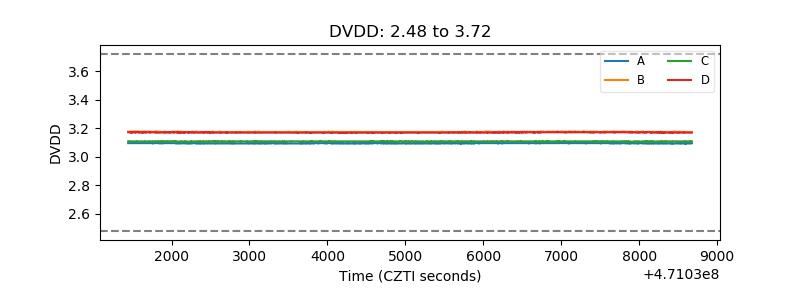 |
| Temperature 1 | 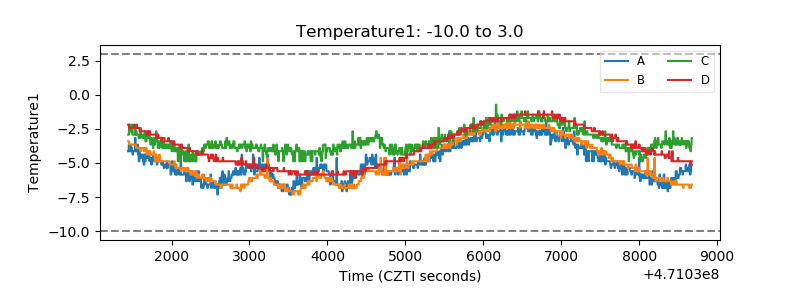 |
| Veto HV Monitor | 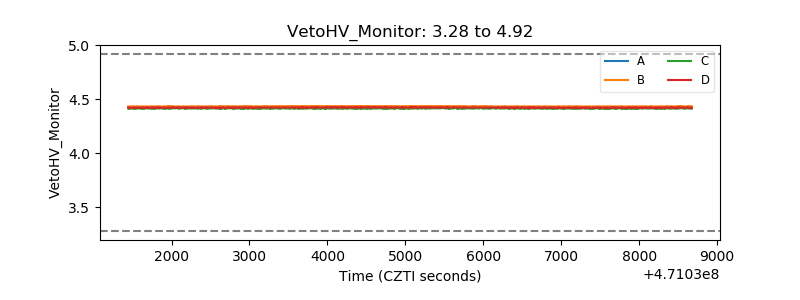 |
| Veto LLD | 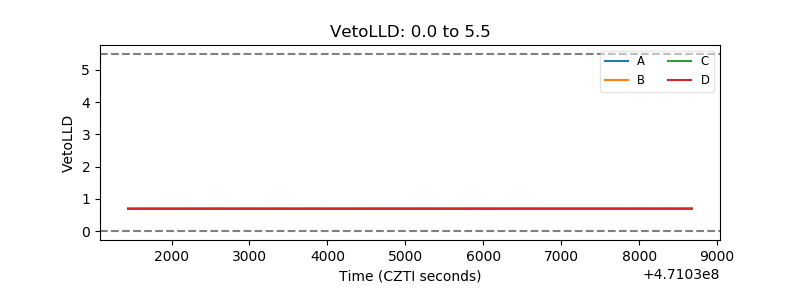 |
| Alpha Counter | 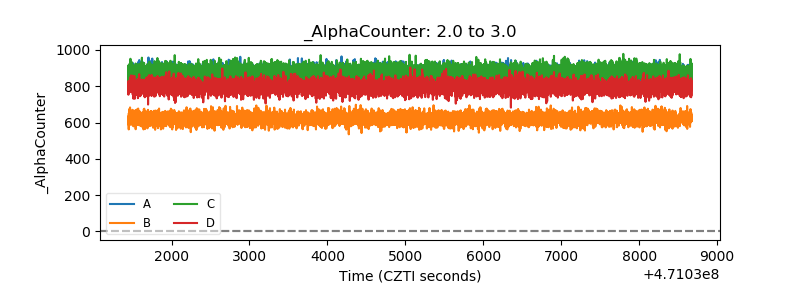 |
| _CPM_Rate | 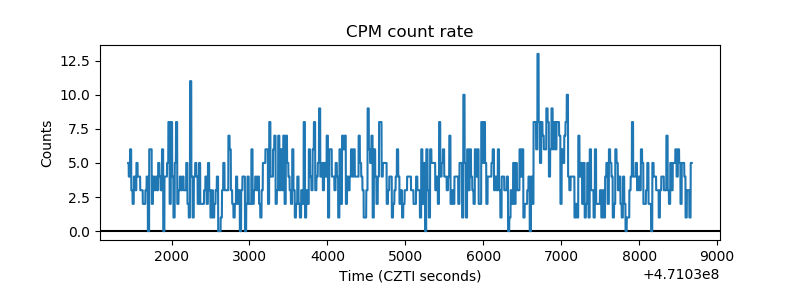 |
| CZT Counter | 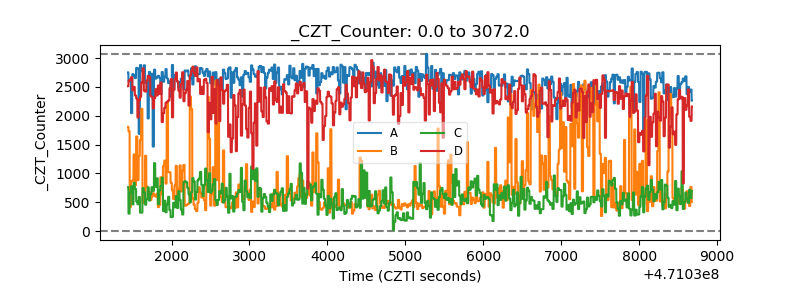 |
| +2.5 Volts monitor | 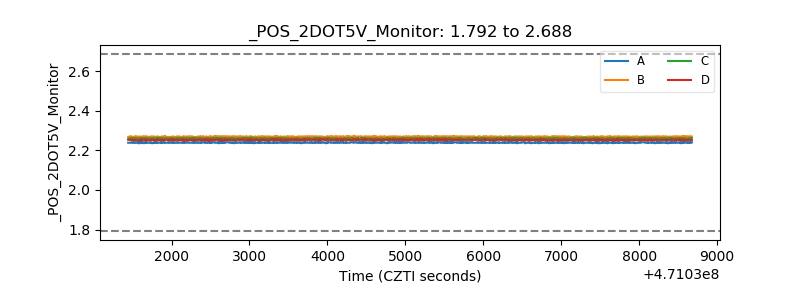 |
| +5 Volts monitor |  |
| _ROLL_ROT | 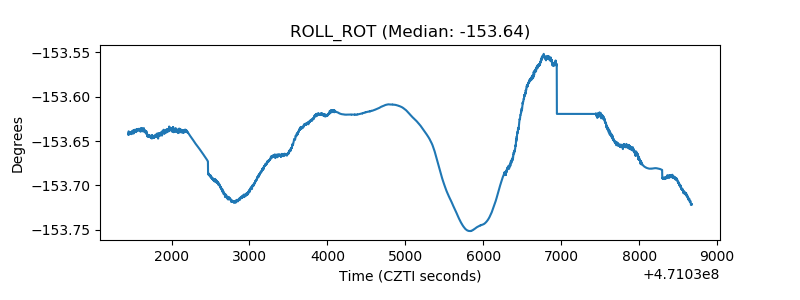 |
| _Roll_DEC | 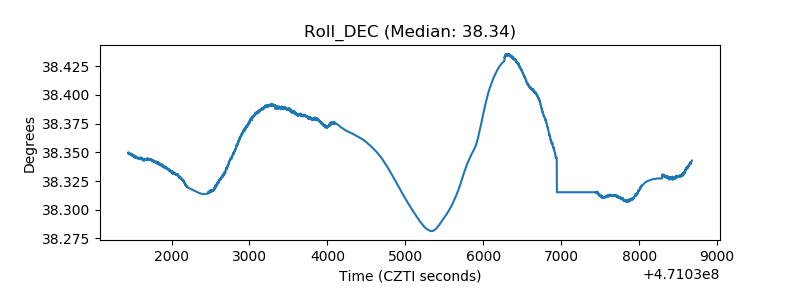 |
| _Roll_RA | 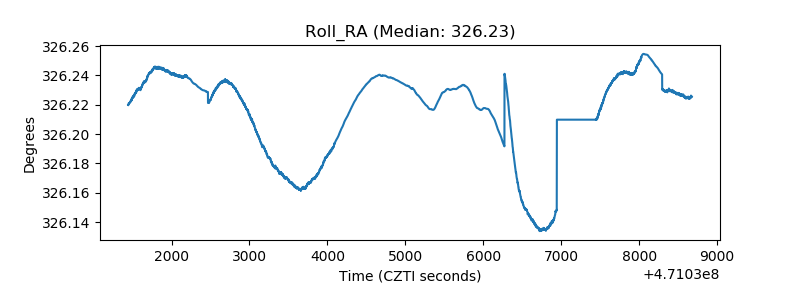 |
| Veto Counter | 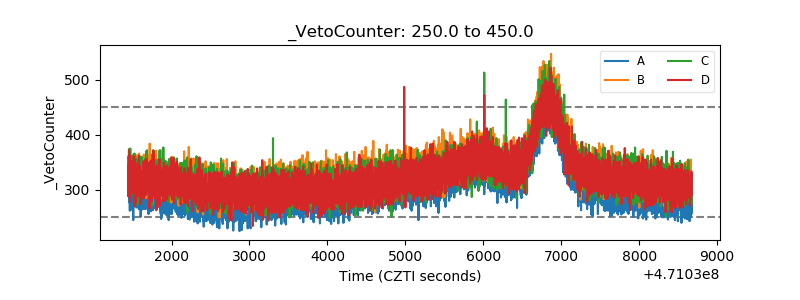 |