| Param | Original file | Final file |
|---|---|---|
| Filename | modeM0/AS1T05_233T01_9000006438_49689cztM0_level2.fits | modeM0/AS1T05_233T01_9000006438_49689cztM0_level2_quad_clean.evt |
| Size (bytes) | 2,571,868,800 | 81,656,640 |
| Size | 2.4 GB | 77.9 MB |
| Events in quadrant A | 35,684,901 | 71,272 |
| Events in quadrant B | 9,515,838 | 1,379,606 |
| Events in quadrant C | 13,408,595 | 12,883 |
| Events in quadrant D | 35,472,933 | 8,400 |
| Mode M9 | |||
|---|---|---|---|
| Quadrant | BADHDUFLAG | Total packets | Discarded packets |
| A | 0 | 13 | 0 |
| B | 0 | 13 | 0 |
| C | 0 | 13 | 0 |
| D | 0 | 14 | 1 |
| Mode SS | |||
|---|---|---|---|
| Quadrant | BADHDUFLAG | Total packets | Discarded packets |
| A | 0 | 295 | 1 |
| B | 0 | 295 | 1 |
| C | 0 | 295 | 1 |
| D | 0 | 297 | 3 |
| Mode M0 | |||
|---|---|---|---|
| Quadrant | BADHDUFLAG | Total packets | Discarded packets |
| A | 0 | 116408 | 588 |
| B | 0 | 38296 | 150 |
| C | 0 | 50468 | 210 |
| D | 0 | 115836 | 617 |
| Quadrant | Total seconds | Saturated seconds | Saturation percentage |
|---|---|---|---|
| A | 14472 | 13926 | 96.227197% |
| B | 14478 | 606 | 4.185661% |
| C | 14478 | 14375 | 99.288576% |
| D | 14470 | 14396 | 99.488597% |
Noise dominated data is calculated using 1-second bins in cleaned event files. If a bin has >2000 counts, and if more than 50% of those come from <1% of pixels, then it is considered to be noise-dominated and hence unusable.
| Quadrant | # 1 sec bins | Bins with >0 counts | Bins with >2000 counts | High rate bins dominated by noise | Noise dominated (total time) | Noise dominated (detector-on time) | Marked lightcurve |
|---|---|---|---|---|---|---|---|
| A | 19949 | 14472 | 13457 | 13457 | 67.46% | 92.99% | 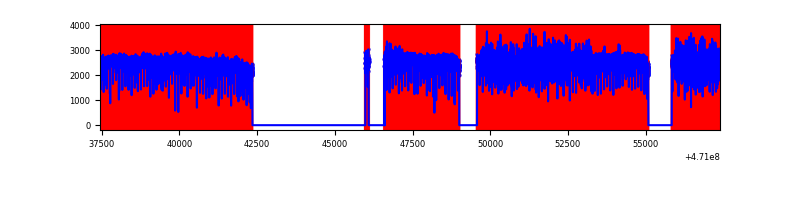 |
| B | 19951 | 14485 | 371 | 371 | 1.86% | 2.56% | 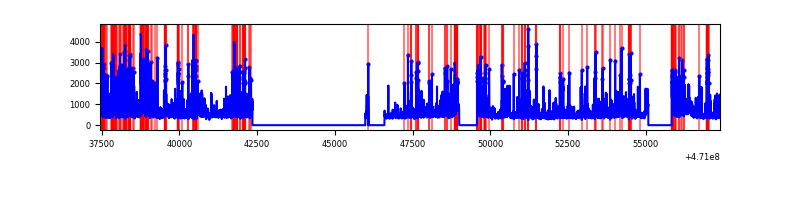 |
| C | 19950 | 14477 | 1503 | 1503 | 7.53% | 10.38% | 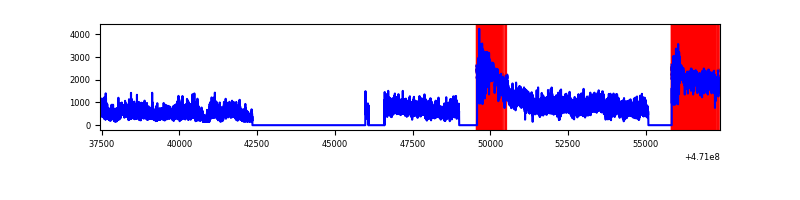 |
| D | 19951 | 14470 | 13152 | 13152 | 65.92% | 90.89% | 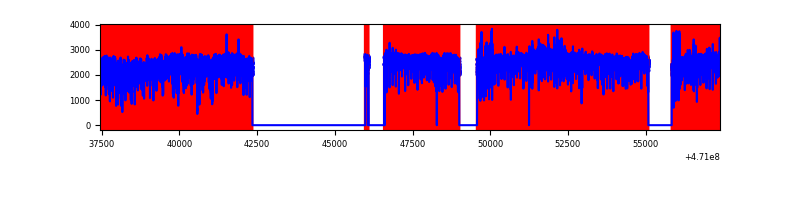 |
Top three noisy pixels from each quadrant. If the there are fewer than three noisy pixels in the level2.evt file, extra rows are filled as -1
| Pixel properties | Quadrant properties | ||||||
|---|---|---|---|---|---|---|---|
| Quadrant | DetID | PixID | Counts | Sigma | Mean | Median | Sigma |
| A | 10 | 83 | 11144003 | 59077.12 | 578 | 554 | 188.6 |
| A | 0 | 99 | 7947257 | 42129.54 | 578 | 554 | 188.6 |
| A | 12 | 50 | 2832245 | 15012.24 | 578 | 554 | 188.6 |
| B | 4 | 206 | 779854 | 2449.59 | 1502 | 1455 | 317.8 |
| B | 10 | 44 | 325390 | 1019.41 | 1502 | 1455 | 317.8 |
| B | 5 | 185 | 253564 | 793.38 | 1502 | 1455 | 317.8 |
| C | 15 | 180 | 3330674 | 61891.01 | 92 | 86 | 53.8 |
| C | 15 | 190 | 2622726 | 48735.49 | 92 | 86 | 53.8 |
| C | 15 | 181 | 1547424 | 28753.58 | 92 | 86 | 53.8 |
| D | 15 | 40 | 7049070 | 31260.08 | 372 | 336 | 225.5 |
| D | 7 | 45 | 4078720 | 18087.02 | 372 | 336 | 225.5 |
| D | 15 | 184 | 3163613 | 14028.66 | 372 | 336 | 225.5 |
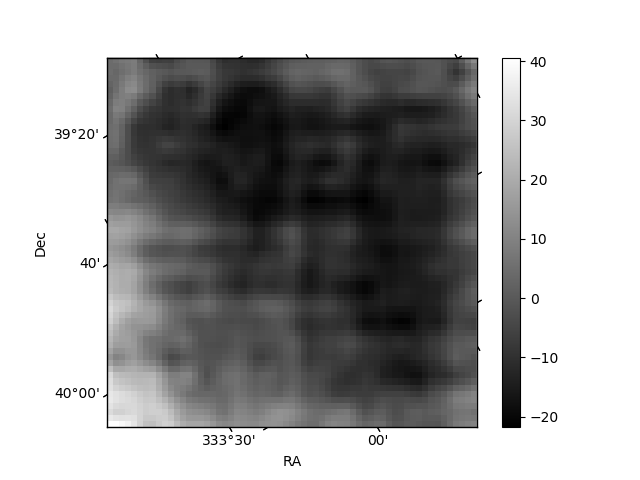
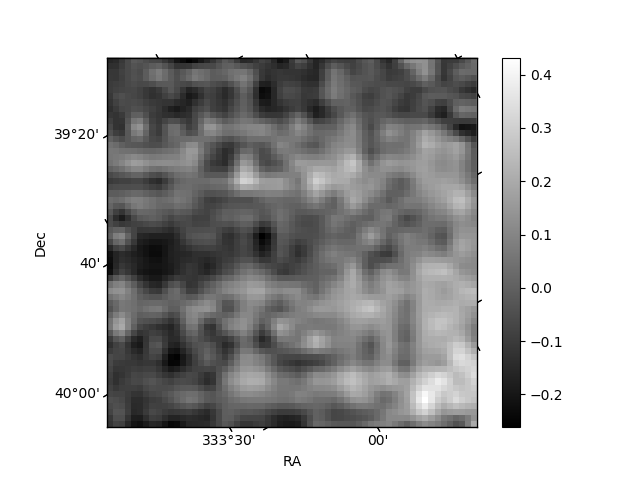
Histogram calculated using DETX and DETY for each event in the final _common_clean file
| Quadrant A | 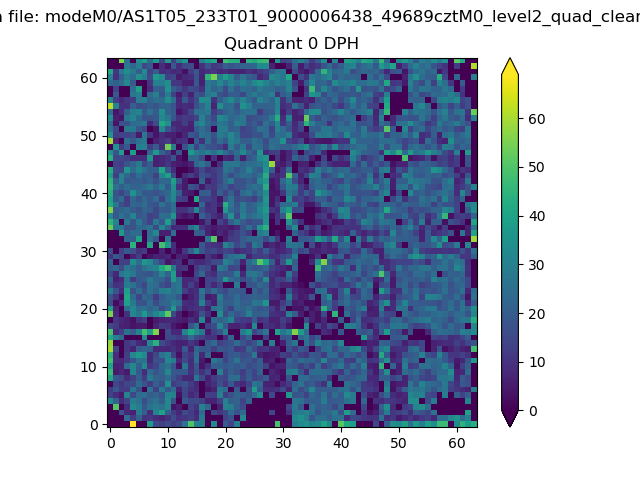 |
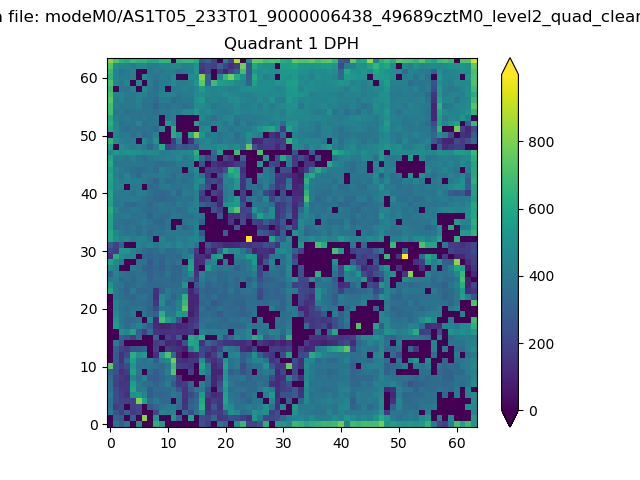 |
Quadrant B |
|---|---|---|---|
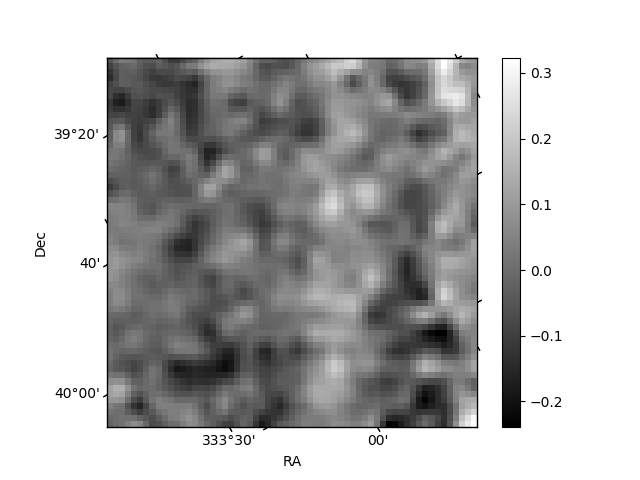
| Quadrant D | 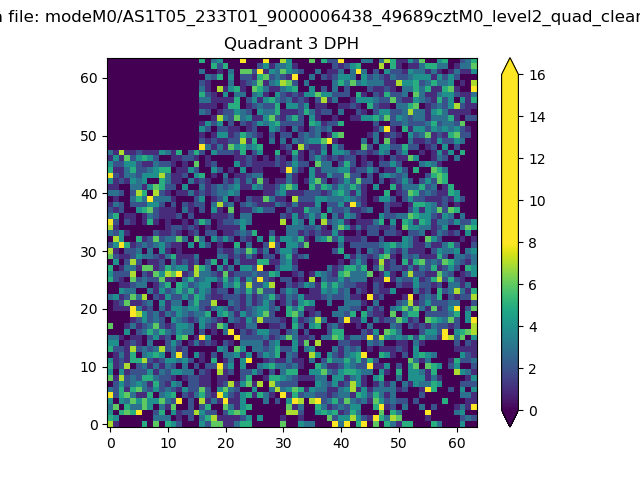 |
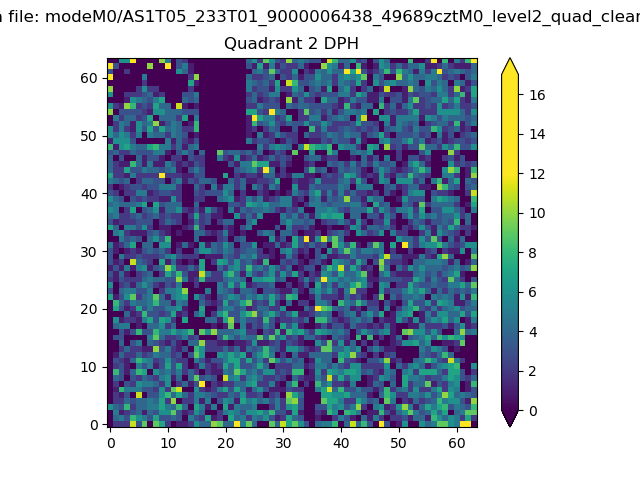 |
Quadrant C |
| Plot type | Count rate plots | Images |
|---|---|---|
| Comparison with Poisson distribution Blue bars denote a histogram of data divided into 1 sec bins. Red curve is a Poisson curve with rate = median count rate of data. |
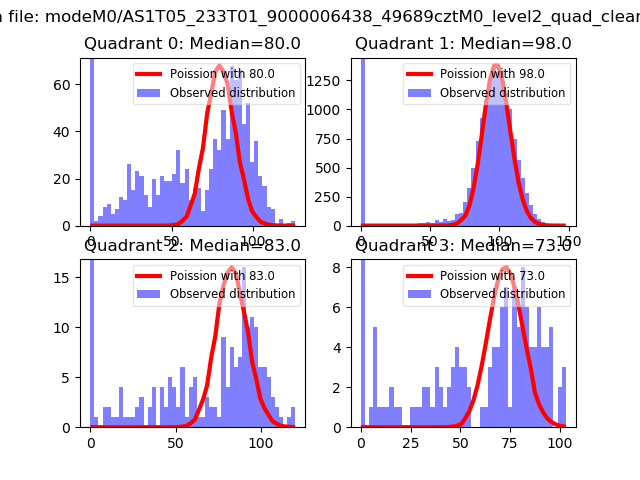 |
 |
| Quadrant-wise count rates Data is divided into 100 sec bins |
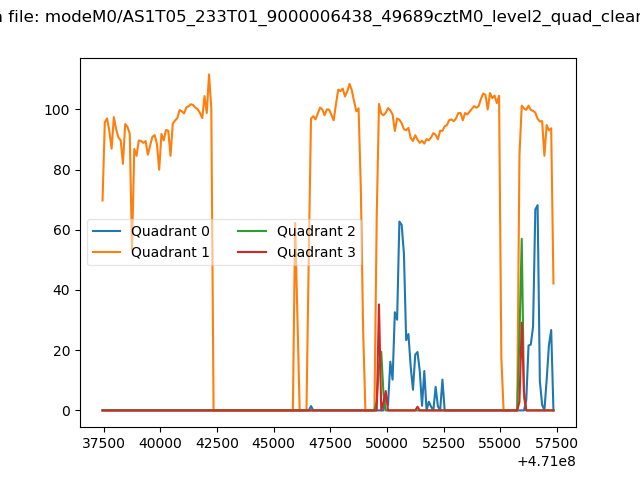 |
|
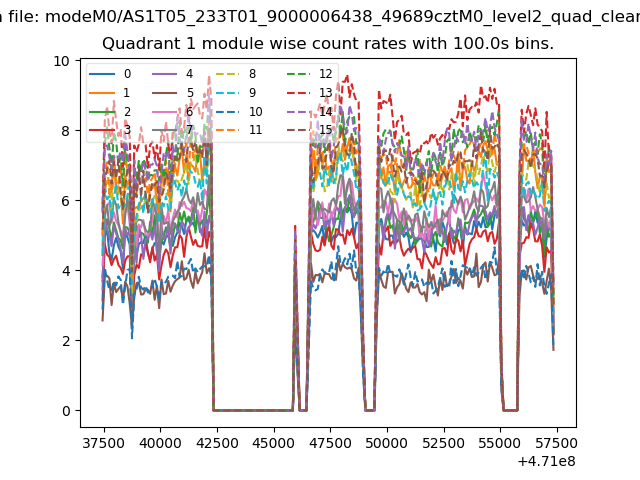
| Module-wise count rates for Quadrant A Data is divided into 100 sec bins |
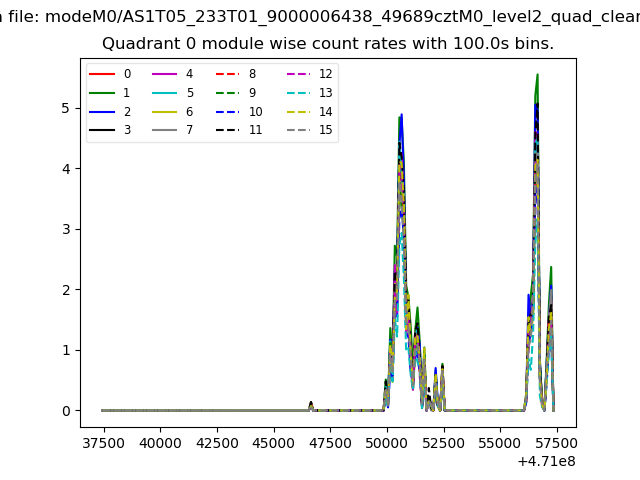 |
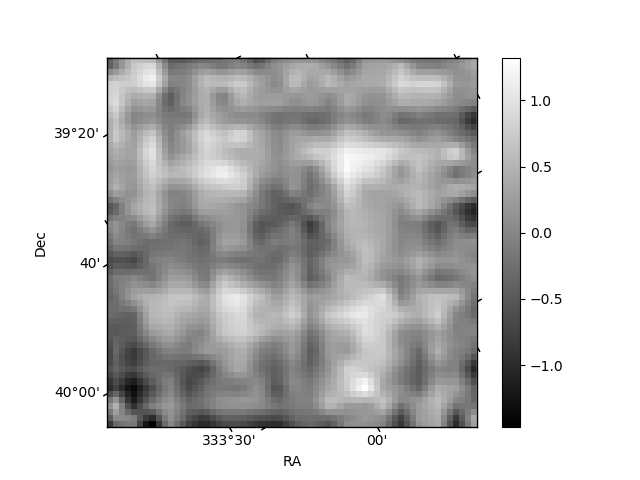 |
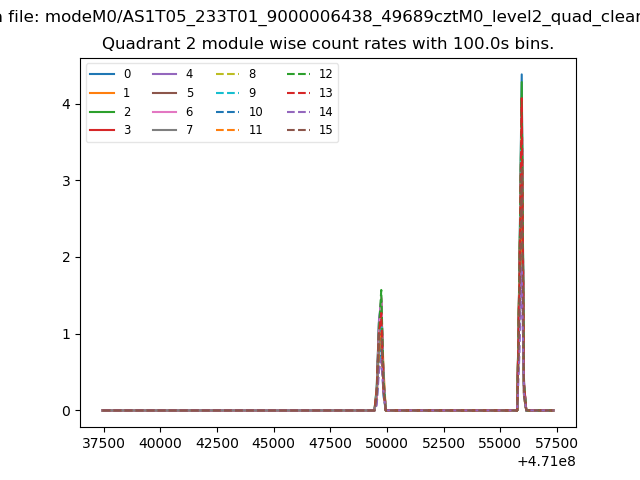
| Module-wise count rates for Quadrant B Data is divided into 100 sec bins |
 |
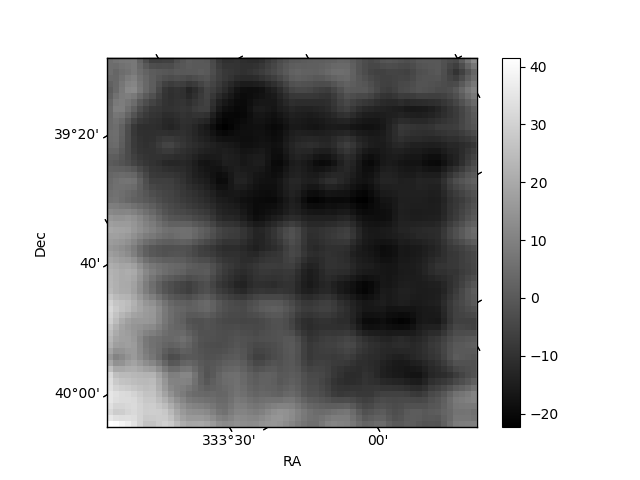 |
| Module-wise count rates for Quadrant C Data is divided into 100 sec bins |
 |
 |
| Module-wise count rates for Quadrant D Data is divided into 100 sec bins |
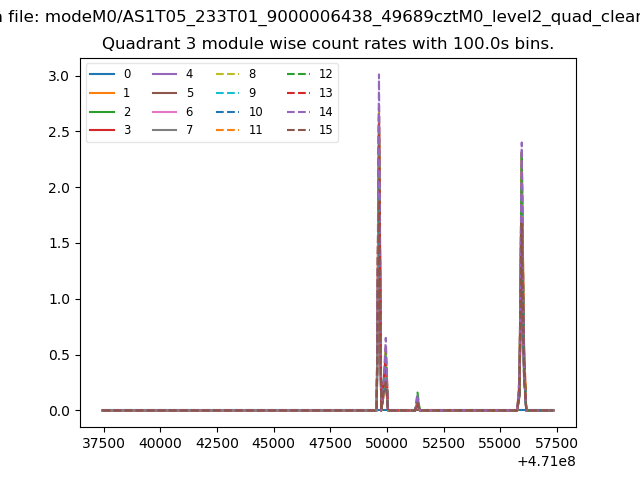 |
 |
| Parameter | Plot |
|---|---|
| CZT HV Monitor |  |
| D_VDD | 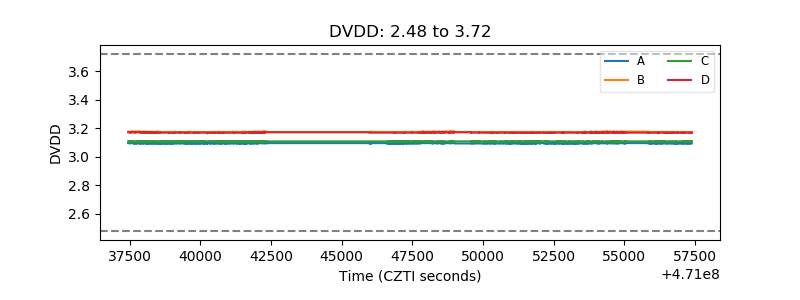 |
| Temperature 1 | 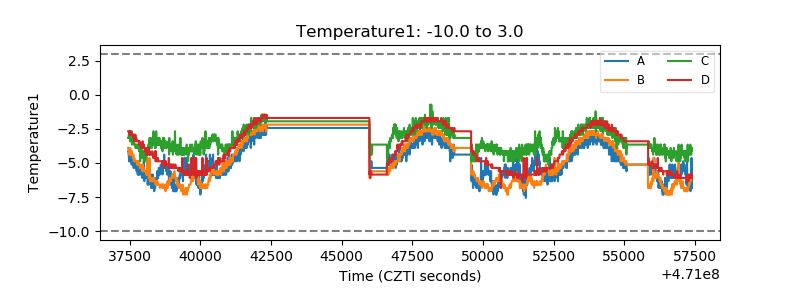 |
| Veto HV Monitor | 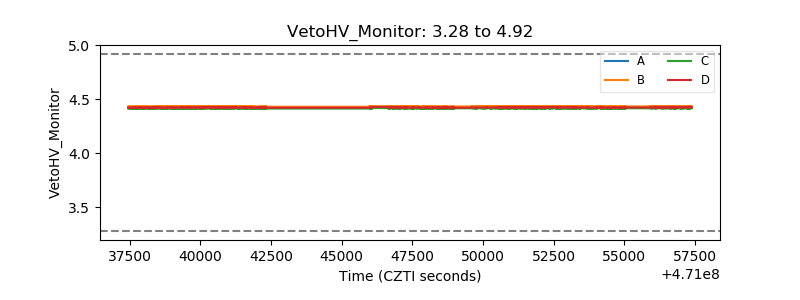 |
| Veto LLD | 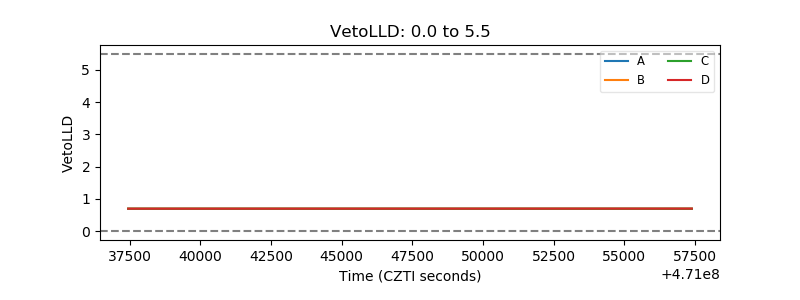 |
| Alpha Counter | 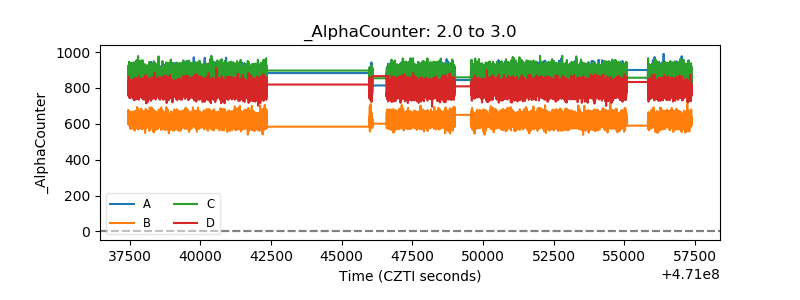 |
| _CPM_Rate | 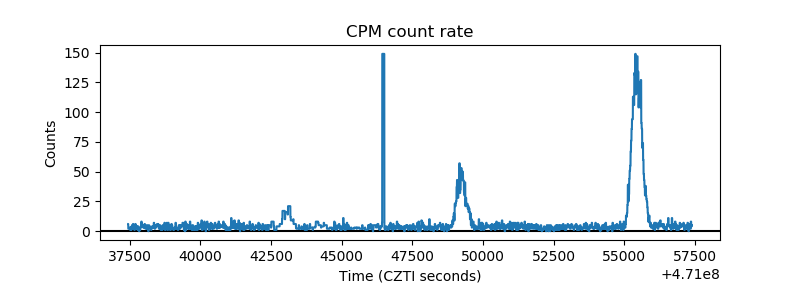 |
| CZT Counter | 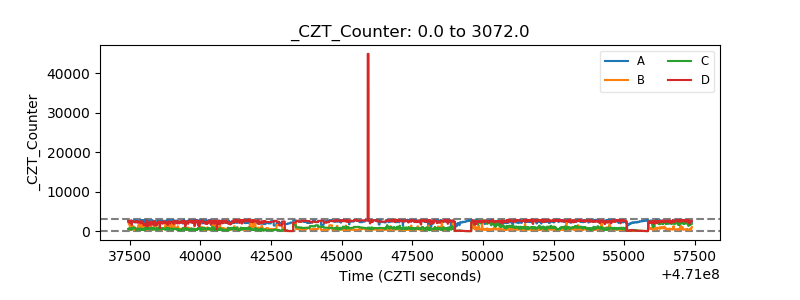 |
| +2.5 Volts monitor | 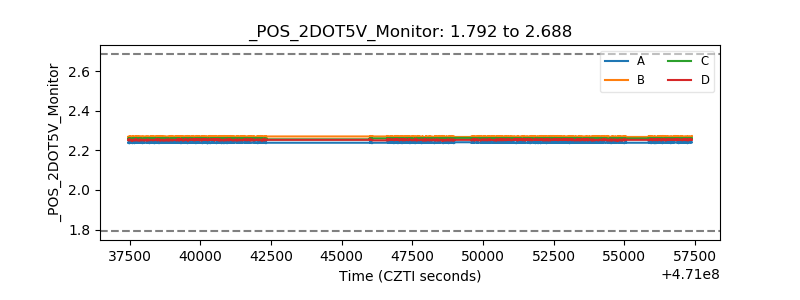 |
| +5 Volts monitor |  |
| _ROLL_ROT | 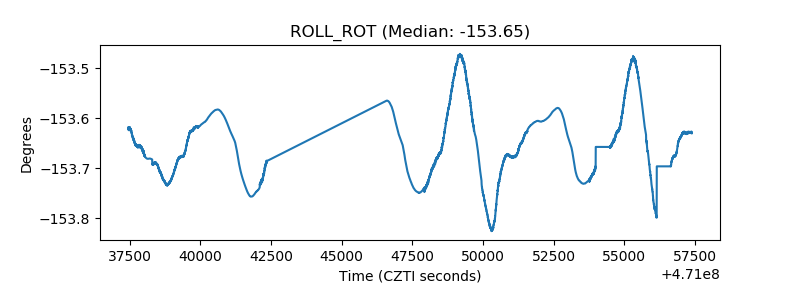 |
| _Roll_DEC | 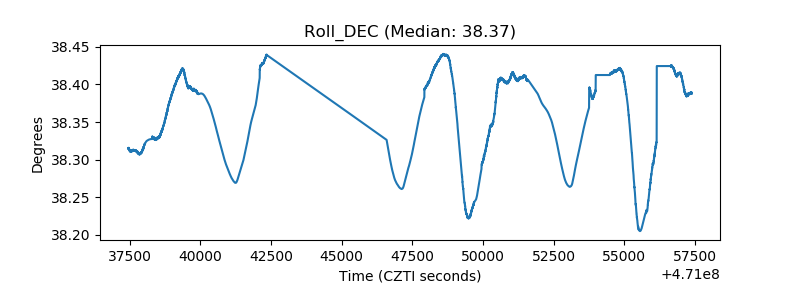 |
| _Roll_RA | 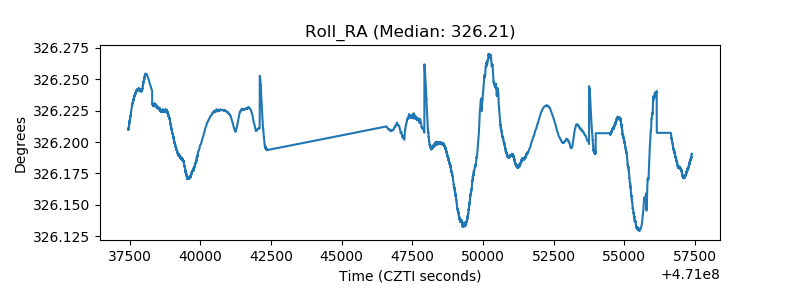 |
| Veto Counter | 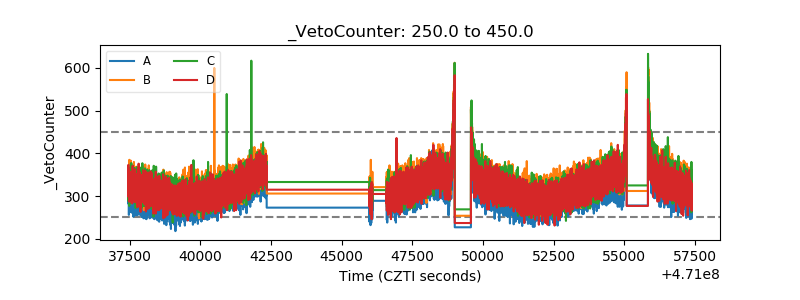 |