| Param | Original file | Final file |
|---|---|---|
| Filename | modeM0/AS1T05_233T01_9000006438_49690cztM0_level2.fits | modeM0/AS1T05_233T01_9000006438_49690cztM0_level2_quad_clean.evt |
| Size (bytes) | 1,120,317,120 | 35,475,840 |
| Size | 1.0 GB | 33.8 MB |
| Events in quadrant A | 14,685,976 | 60,214 |
| Events in quadrant B | 3,651,136 | 582,979 |
| Events in quadrant C | 7,976,971 | 7,185 |
| Events in quadrant D | 14,692,680 | 5,538 |
| Mode M9 | |||
|---|---|---|---|
| Quadrant | BADHDUFLAG | Total packets | Discarded packets |
| A | 0 | 9 | 0 |
| B | 0 | 9 | 0 |
| C | 0 | 9 | 0 |
| D | 0 | 9 | 0 |
| Mode SS | |||
|---|---|---|---|
| Quadrant | BADHDUFLAG | Total packets | Discarded packets |
| A | 0 | 122 | 0 |
| B | 0 | 122 | 0 |
| C | 0 | 122 | 0 |
| D | 0 | 122 | 0 |
| Mode M0 | |||
|---|---|---|---|
| Quadrant | BADHDUFLAG | Total packets | Discarded packets |
| A | 0 | 47676 | 1 |
| B | 0 | 15057 | 1 |
| C | 0 | 27906 | 1 |
| D | 0 | 47718 | 1 |
| Quadrant | Total seconds | Saturated seconds | Saturation percentage |
|---|---|---|---|
| A | 5982 | 5517 | 92.226680% |
| B | 5983 | 252 | 4.211934% |
| C | 5983 | 5913 | 98.830018% |
| D | 5983 | 5936 | 99.214441% |
Noise dominated data is calculated using 1-second bins in cleaned event files. If a bin has >2000 counts, and if more than 50% of those come from <1% of pixels, then it is considered to be noise-dominated and hence unusable.
| Quadrant | # 1 sec bins | Bins with >0 counts | Bins with >2000 counts | High rate bins dominated by noise | Noise dominated (total time) | Noise dominated (detector-on time) | Marked lightcurve |
|---|---|---|---|---|---|---|---|
| A | 6892 | 5982 | 5414 | 5414 | 78.55% | 90.50% |  |
| B | 6893 | 5985 | 127 | 127 | 1.84% | 2.12% | 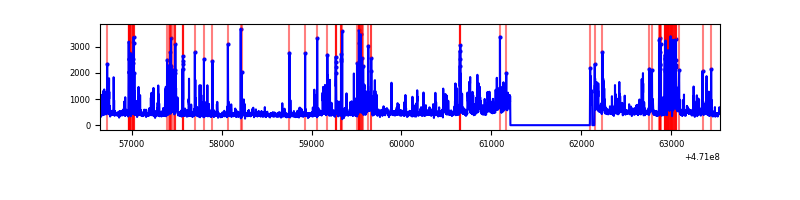 |
| C | 6892 | 5982 | 927 | 927 | 13.45% | 15.50% | 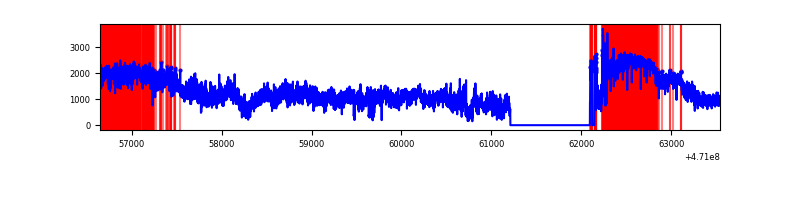 |
| D | 6892 | 5982 | 5458 | 5458 | 79.19% | 91.24% | 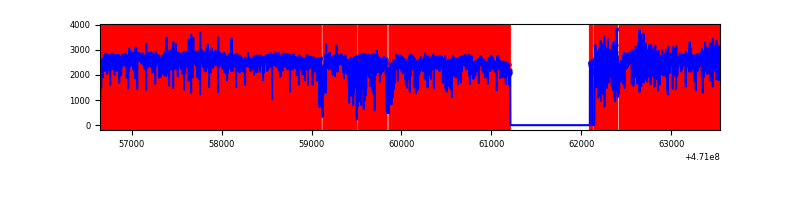 |
Top three noisy pixels from each quadrant. If the there are fewer than three noisy pixels in the level2.evt file, extra rows are filled as -1
| Pixel properties | Quadrant properties | ||||||
|---|---|---|---|---|---|---|---|
| Quadrant | DetID | PixID | Counts | Sigma | Mean | Median | Sigma |
| A | 10 | 83 | 6124051 | 53543.21 | 378 | 363 | 114.4 |
| A | 12 | 50 | 1542569 | 13484.46 | 378 | 363 | 114.4 |
| A | 15 | 191 | 696146 | 6083.66 | 378 | 363 | 114.4 |
| B | 4 | 206 | 289921 | 2182.36 | 627 | 608 | 132.6 |
| B | 1 | 255 | 289397 | 2178.41 | 627 | 608 | 132.6 |
| B | 5 | 185 | 121305 | 910.45 | 627 | 608 | 132.6 |
| C | 15 | 180 | 2817940 | 137977.61 | 47 | 45 | 20.4 |
| C | 15 | 190 | 1887654 | 92426.36 | 47 | 45 | 20.4 |
| C | 15 | 181 | 696669 | 34110.04 | 47 | 45 | 20.4 |
| D | 15 | 40 | 3280212 | 45906.69 | 182 | 172 | 71.5 |
| D | 7 | 45 | 1873270 | 26215.45 | 182 | 172 | 71.5 |
| D | 7 | 60 | 1413205 | 19776.49 | 182 | 172 | 71.5 |
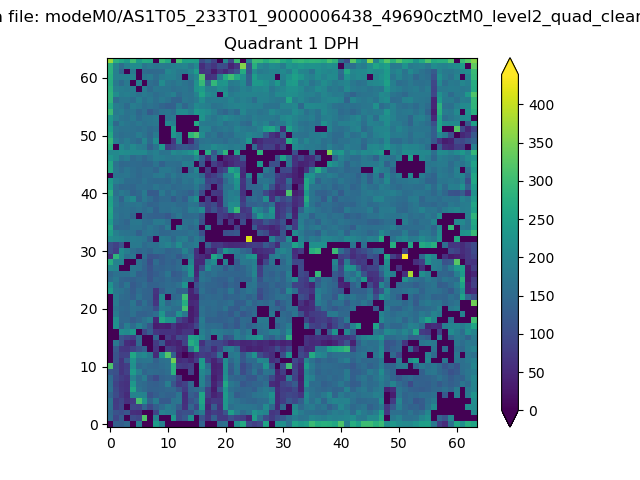
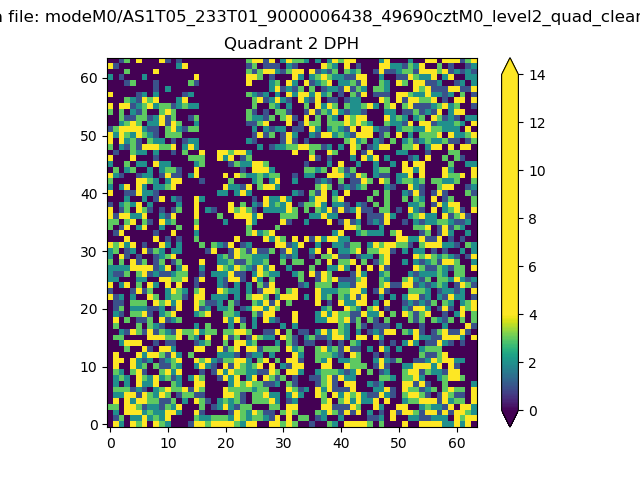
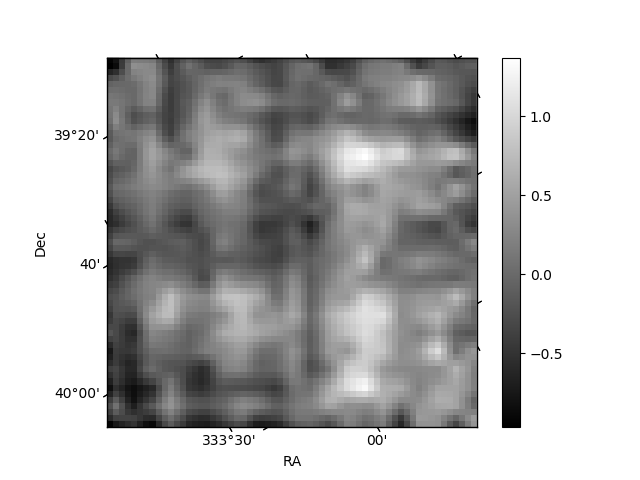
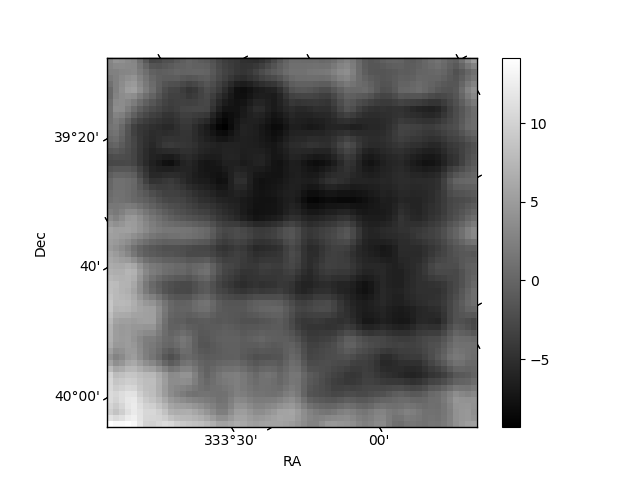
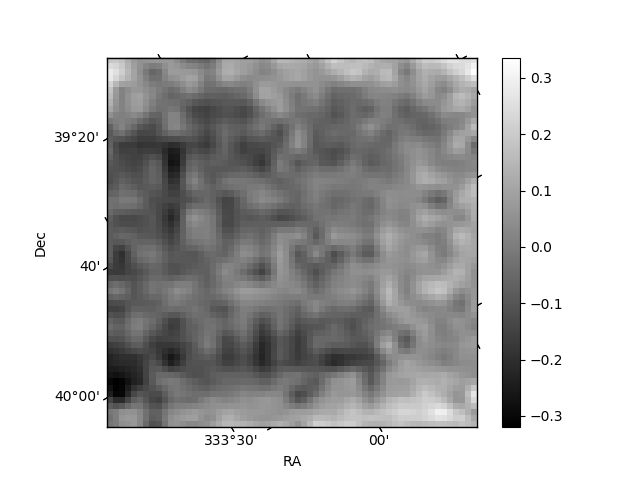
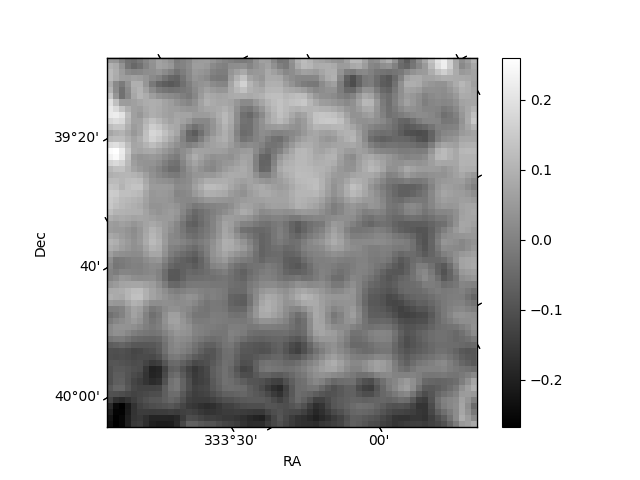
Histogram calculated using DETX and DETY for each event in the final _common_clean file
| Quadrant A | 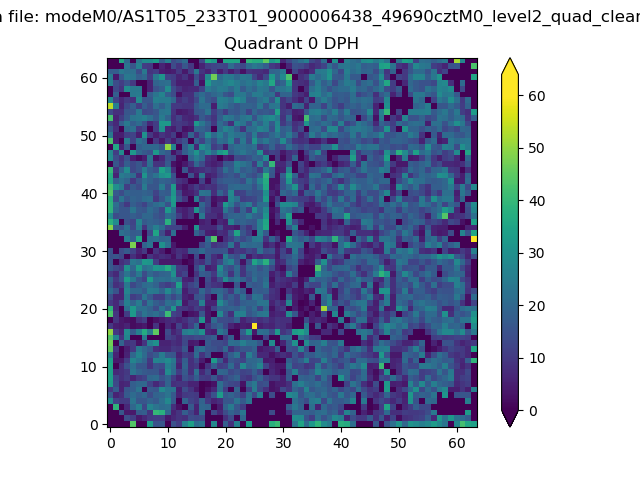 |
 |
Quadrant B |
|---|---|---|---|
| Quadrant D | 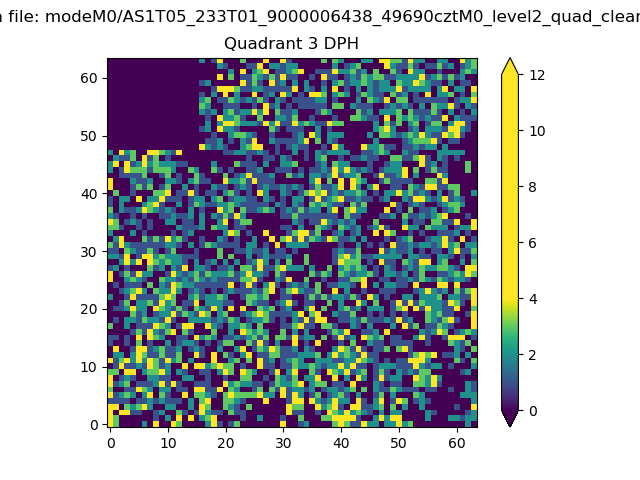 |
 |
Quadrant C |
| Plot type | Count rate plots | Images |
|---|---|---|
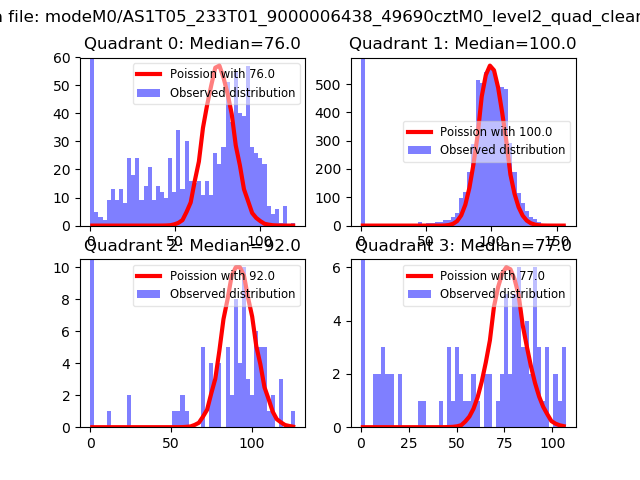
| Comparison with Poisson distribution Blue bars denote a histogram of data divided into 1 sec bins. Red curve is a Poisson curve with rate = median count rate of data. |
 |
 |
| Quadrant-wise count rates Data is divided into 100 sec bins |
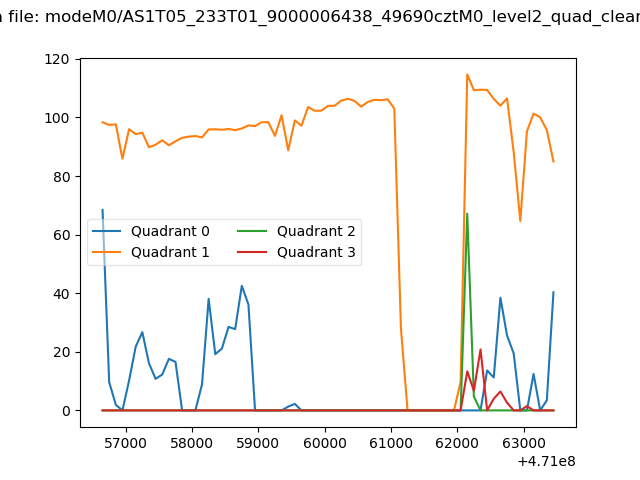 |
|
| Module-wise count rates for Quadrant A Data is divided into 100 sec bins |
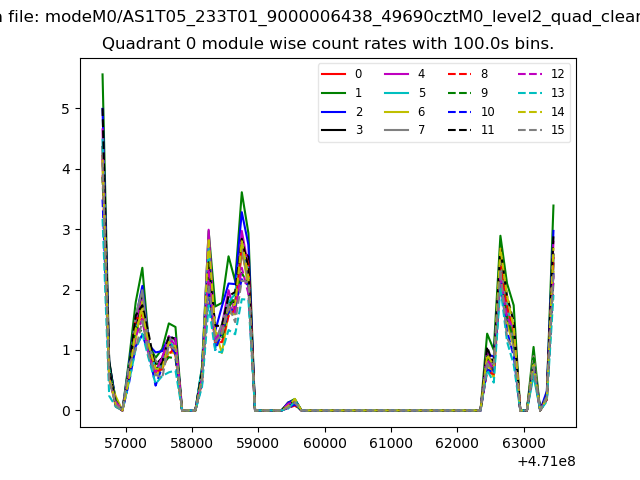 |
 |
| Module-wise count rates for Quadrant B Data is divided into 100 sec bins |
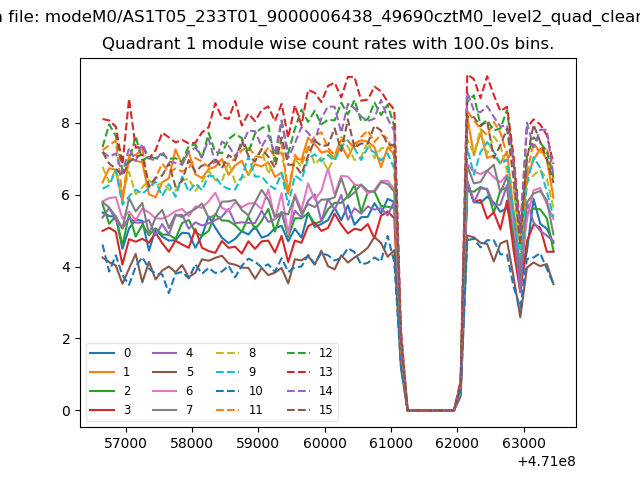 |
 |
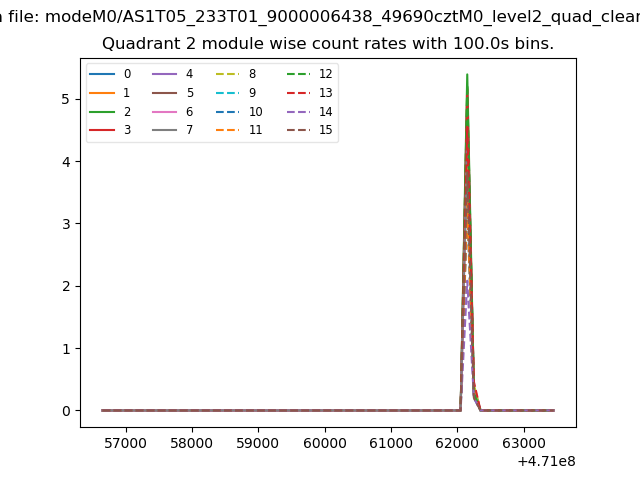
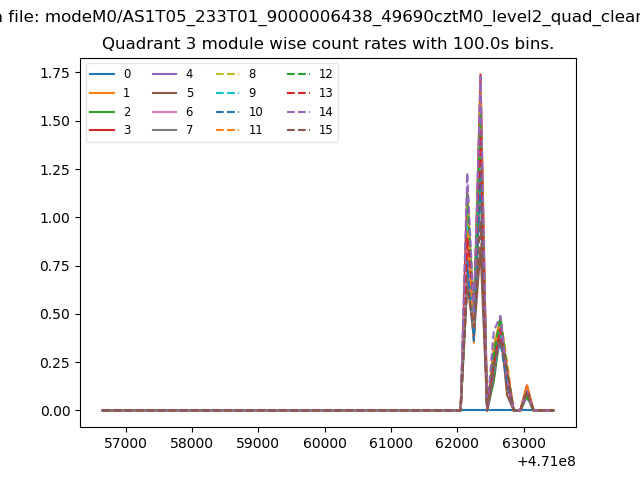
| Module-wise count rates for Quadrant C Data is divided into 100 sec bins |
 |
 |
| Module-wise count rates for Quadrant D Data is divided into 100 sec bins |
 |
 |
| Parameter | Plot |
|---|---|
| CZT HV Monitor | 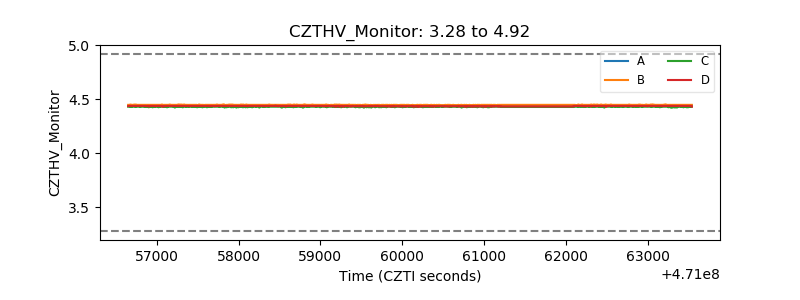 |
| D_VDD | 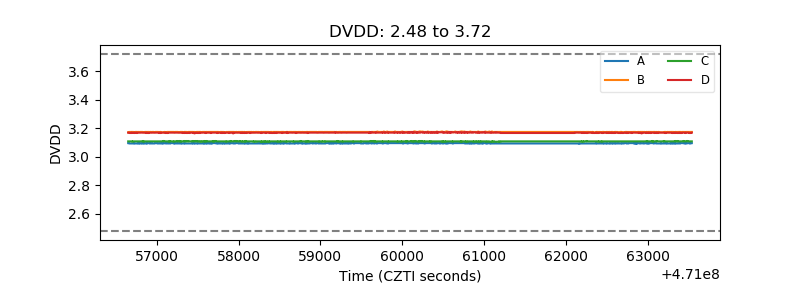 |
| Temperature 1 | 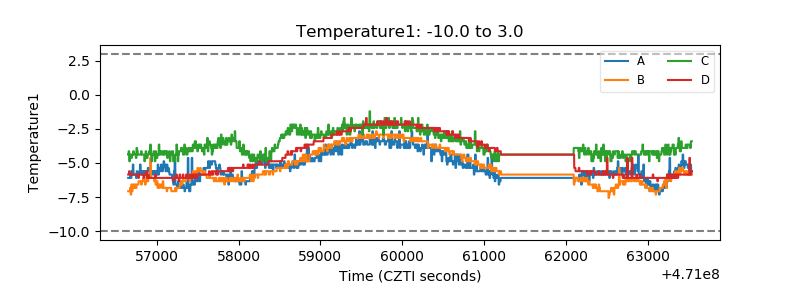 |
| Veto HV Monitor | 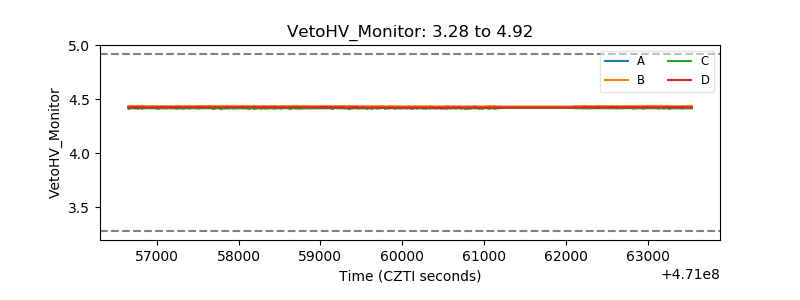 |
| Veto LLD | 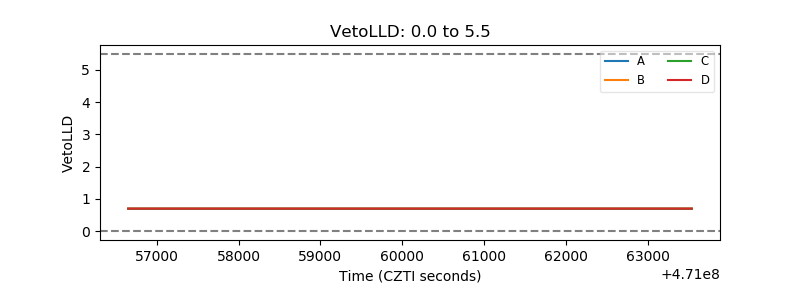 |
| Alpha Counter | 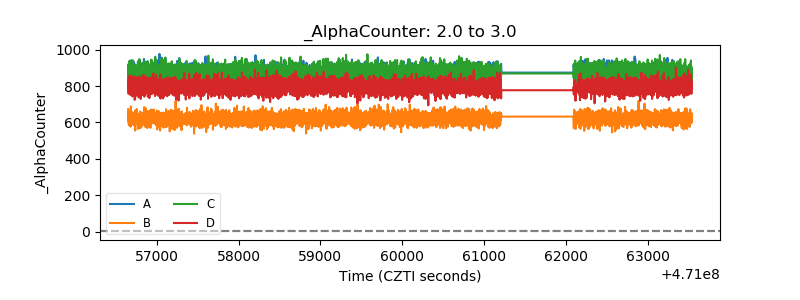 |
| _CPM_Rate | 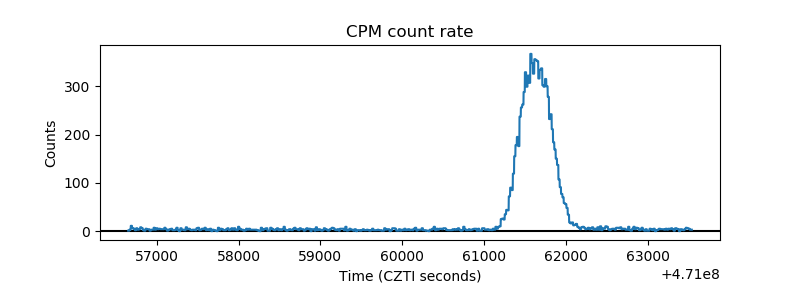 |
| CZT Counter | 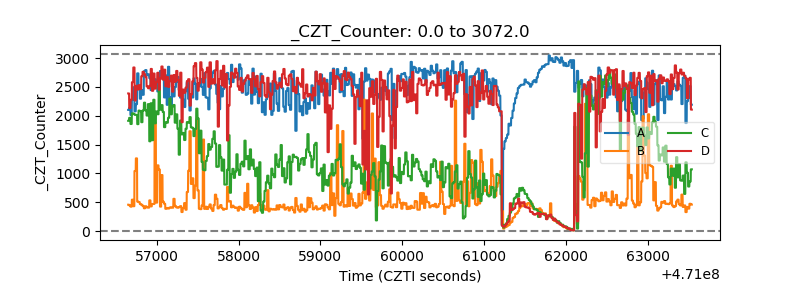 |
| +2.5 Volts monitor | 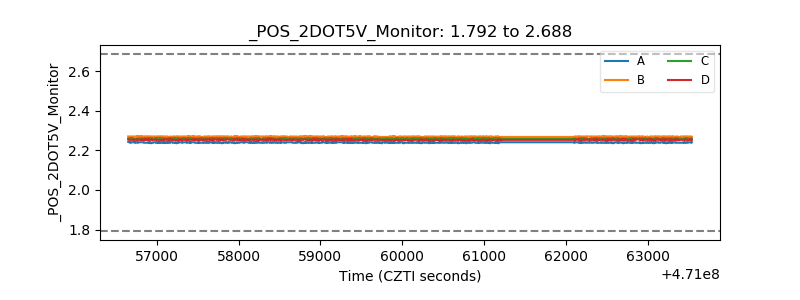 |
| +5 Volts monitor |  |
| _ROLL_ROT | 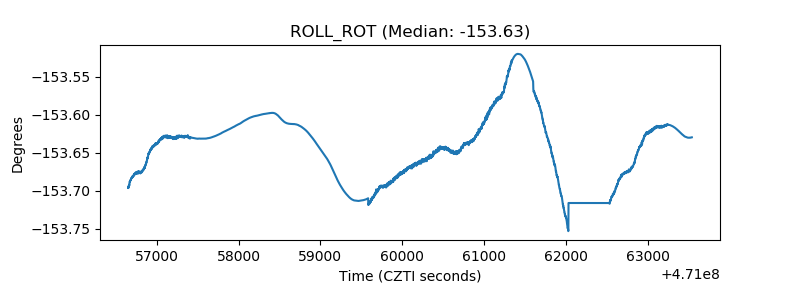 |
| _Roll_DEC | 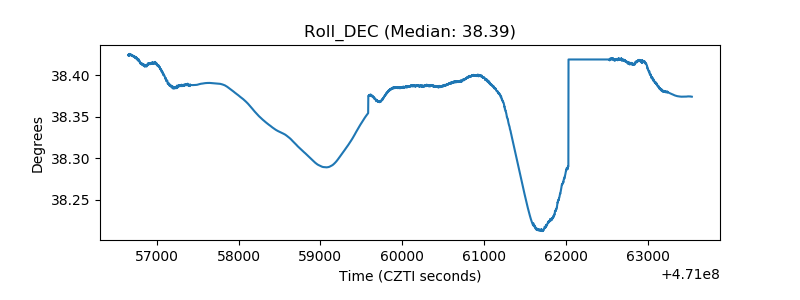 |
| _Roll_RA | 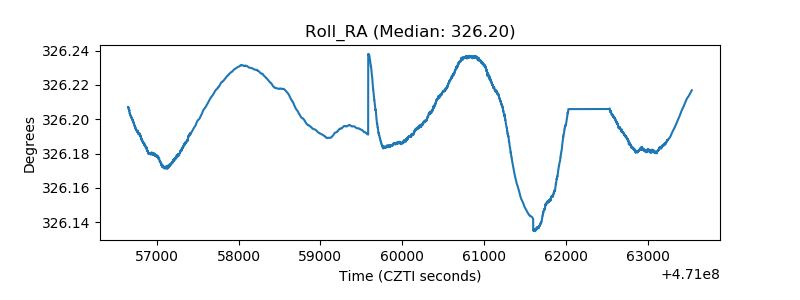 |
| Veto Counter | 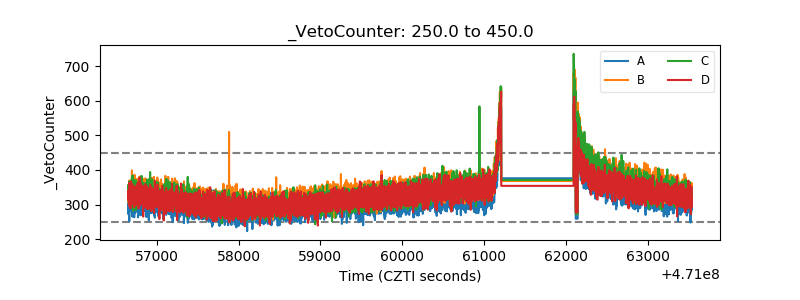 |