| Param | Original file | Final file |
|---|---|---|
| Filename | modeM0/AS1T05_233T01_9000006438_49692cztM0_level2.fits | modeM0/AS1T05_233T01_9000006438_49692cztM0_level2_quad_clean.evt |
| Size (bytes) | 1,141,986,240 | 55,157,760 |
| Size | 1.1 GB | 52.6 MB |
| Events in quadrant A | 14,848,536 | 390,613 |
| Events in quadrant B | 4,009,300 | 638,605 |
| Events in quadrant C | 7,761,697 | 15,167 |
| Events in quadrant D | 15,167,799 | 180,288 |
| Mode M9 | |||
|---|---|---|---|
| Quadrant | BADHDUFLAG | Total packets | Discarded packets |
| A | 0 | 10 | 0 |
| B | 0 | 10 | 0 |
| C | 0 | 10 | 0 |
| D | 0 | 10 | 0 |
| Mode SS | |||
|---|---|---|---|
| Quadrant | BADHDUFLAG | Total packets | Discarded packets |
| A | 0 | 128 | 0 |
| B | 0 | 128 | 0 |
| C | 0 | 128 | 0 |
| D | 0 | 128 | 0 |
| Mode M0 | |||
|---|---|---|---|
| Quadrant | BADHDUFLAG | Total packets | Discarded packets |
| A | 0 | 48318 | 0 |
| B | 0 | 16320 | 0 |
| C | 0 | 27477 | 0 |
| D | 0 | 49328 | 0 |
| Quadrant | Total seconds | Saturated seconds | Saturation percentage |
|---|---|---|---|
| A | 6254 | 5455 | 87.224177% |
| B | 6254 | 357 | 5.708347% |
| C | 6255 | 6255 | 100.000000% |
| D | 6255 | 6084 | 97.266187% |
Noise dominated data is calculated using 1-second bins in cleaned event files. If a bin has >2000 counts, and if more than 50% of those come from <1% of pixels, then it is considered to be noise-dominated and hence unusable.
| Quadrant | # 1 sec bins | Bins with >0 counts | Bins with >2000 counts | High rate bins dominated by noise | Noise dominated (total time) | Noise dominated (detector-on time) | Marked lightcurve |
|---|---|---|---|---|---|---|---|
| A | 7268 | 6253 | 5289 | 5289 | 72.77% | 84.58% | 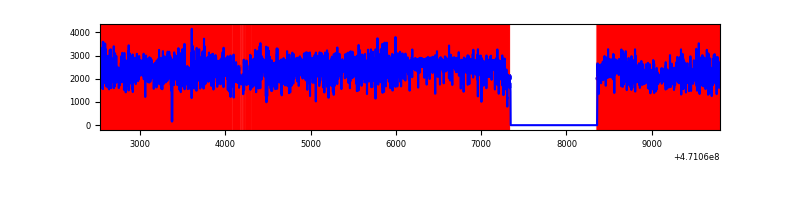 |
| B | 7269 | 6254 | 181 | 181 | 2.49% | 2.89% | 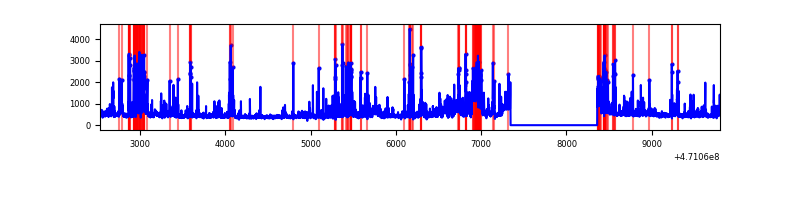 |
| C | 7269 | 6254 | 559 | 559 | 7.69% | 8.94% | 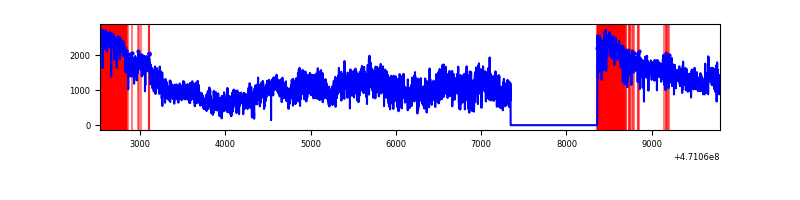 |
| D | 7269 | 6254 | 5607 | 5607 | 77.14% | 89.65% | 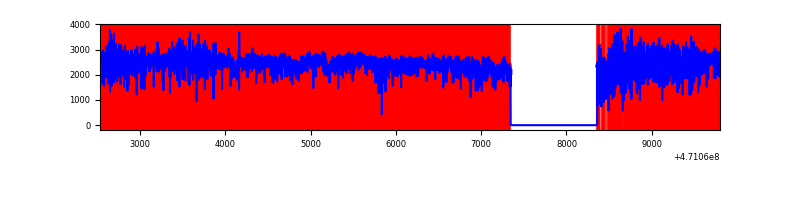 |
Top three noisy pixels from each quadrant. If the there are fewer than three noisy pixels in the level2.evt file, extra rows are filled as -1
| Pixel properties | Quadrant properties | ||||||
|---|---|---|---|---|---|---|---|
| Quadrant | DetID | PixID | Counts | Sigma | Mean | Median | Sigma |
| A | 10 | 83 | 6584740 | 52021.69 | 454 | 440 | 126.6 |
| A | 12 | 50 | 1907241 | 15065.38 | 454 | 440 | 126.6 |
| A | 0 | 98 | 722284 | 5703.19 | 454 | 440 | 126.6 |
| B | 1 | 255 | 359502 | 2559.12 | 662 | 642 | 140.2 |
| B | 10 | 44 | 314199 | 2236.06 | 662 | 642 | 140.2 |
| B | 4 | 206 | 232408 | 1652.78 | 662 | 642 | 140.2 |
| C | 15 | 180 | 2887752 | 155429.48 | 35 | 33 | 18.6 |
| C | 15 | 190 | 1725217 | 92856.83 | 35 | 33 | 18.6 |
| C | 15 | 181 | 661984 | 35629.05 | 35 | 33 | 18.6 |
| D | 15 | 40 | 3228771 | 40301.29 | 234 | 222 | 80.1 |
| D | 15 | 140 | 1953500 | 24382.35 | 234 | 222 | 80.1 |
| D | 7 | 45 | 1912757 | 23873.77 | 234 | 222 | 80.1 |
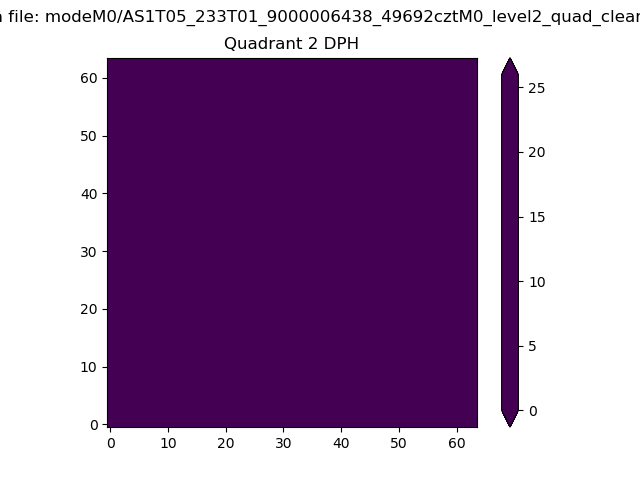
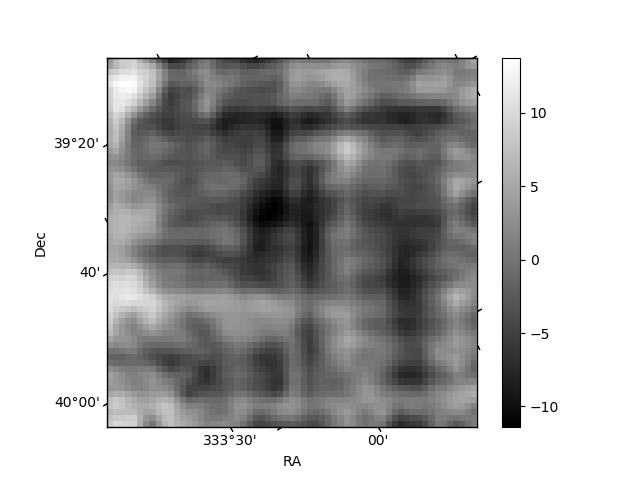
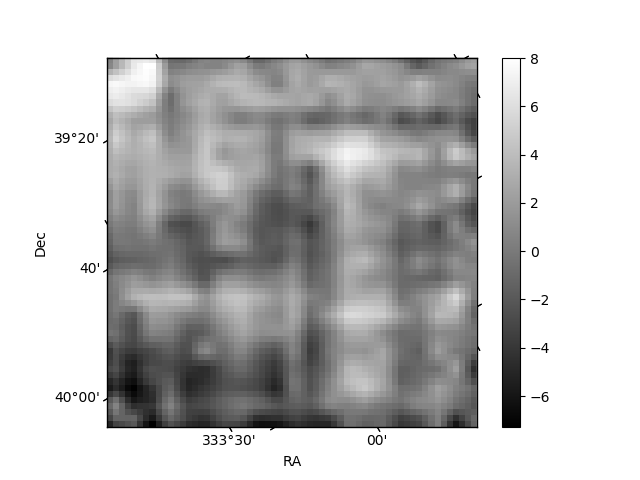
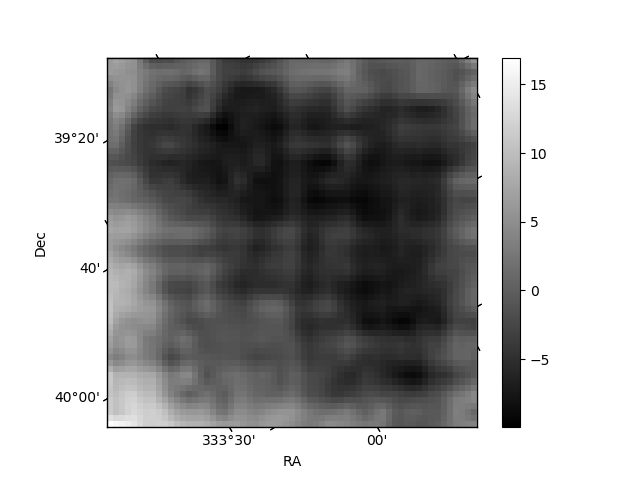
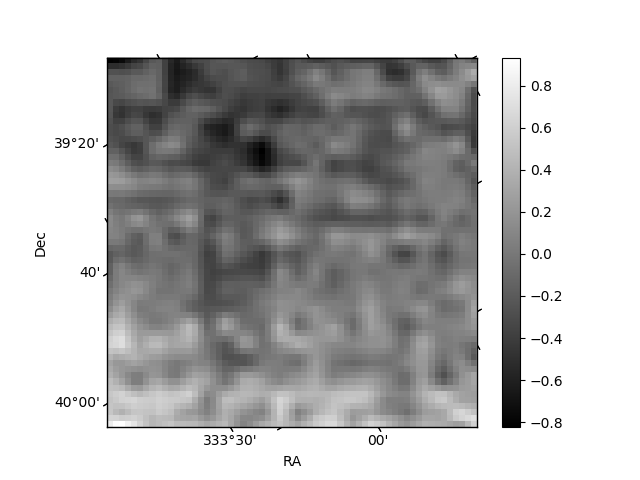
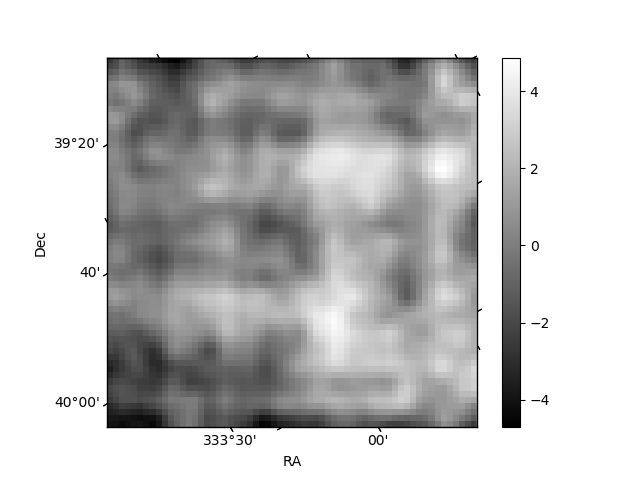
Histogram calculated using DETX and DETY for each event in the final _common_clean file
| Quadrant A | 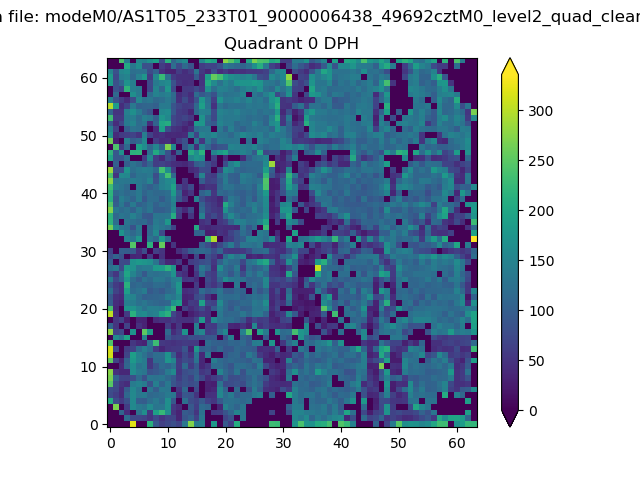 |
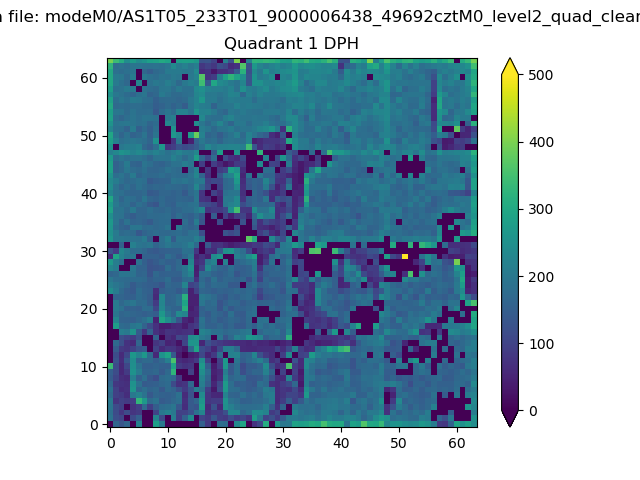 |
Quadrant B |
|---|---|---|---|
| Quadrant D | 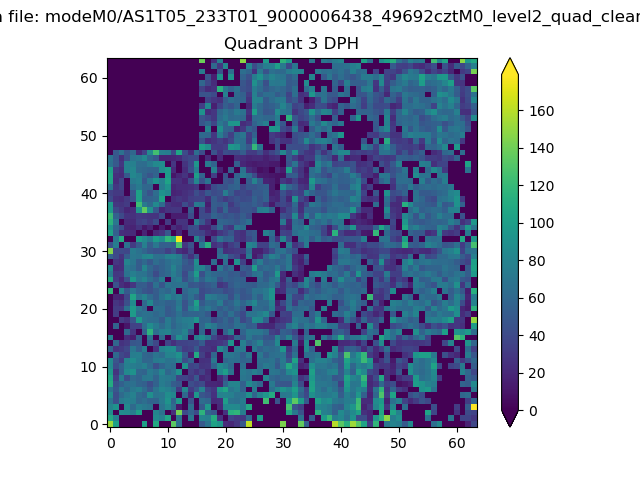 |
 |
Quadrant C |
| Plot type | Count rate plots | Images |
|---|---|---|
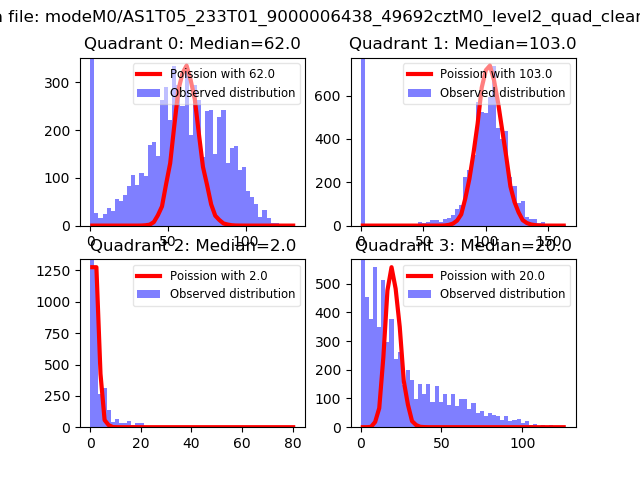
| Comparison with Poisson distribution Blue bars denote a histogram of data divided into 1 sec bins. Red curve is a Poisson curve with rate = median count rate of data. |
 |
 |
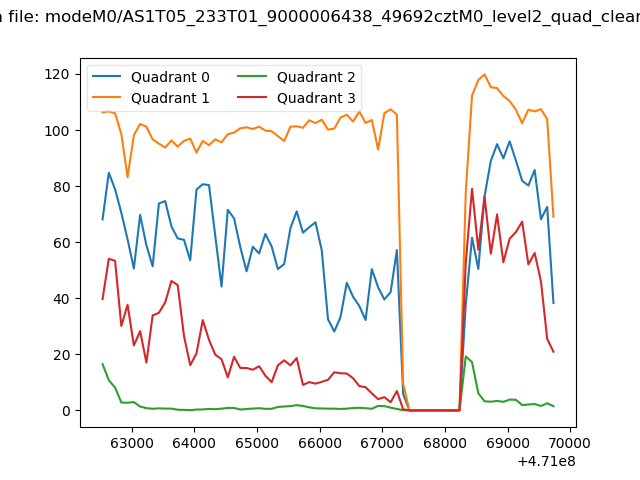
| Quadrant-wise count rates Data is divided into 100 sec bins |
 |
|
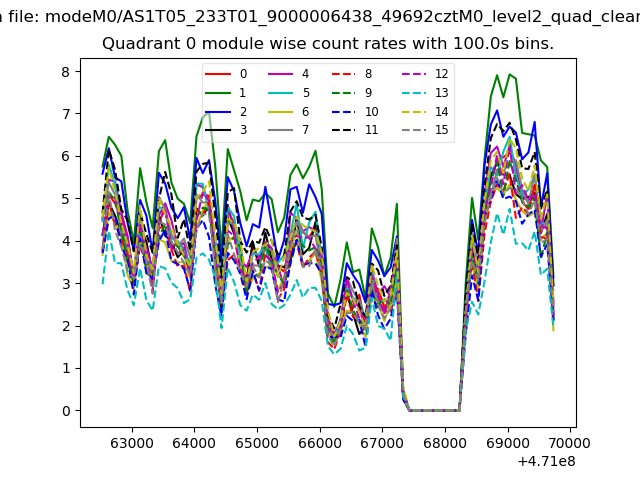
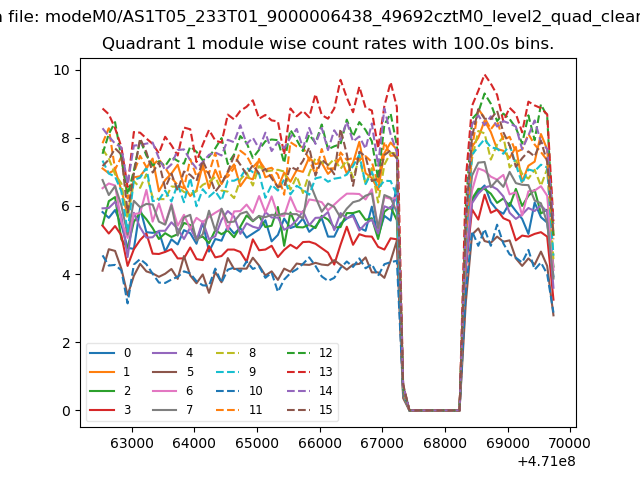
| Module-wise count rates for Quadrant A Data is divided into 100 sec bins |
 |
 |
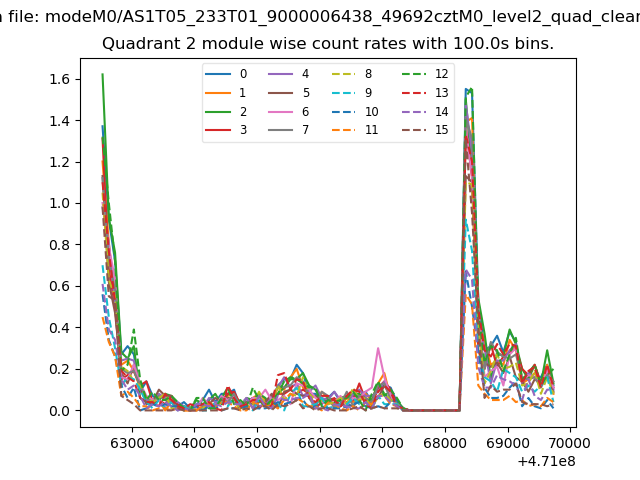
| Module-wise count rates for Quadrant B Data is divided into 100 sec bins |
 |
 |
| Module-wise count rates for Quadrant C Data is divided into 100 sec bins |
 |
 |
| Module-wise count rates for Quadrant D Data is divided into 100 sec bins |
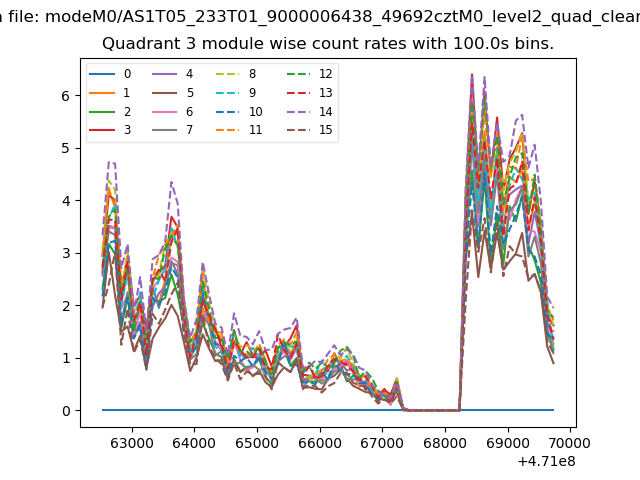 |
 |
| Parameter | Plot |
|---|---|
| CZT HV Monitor | 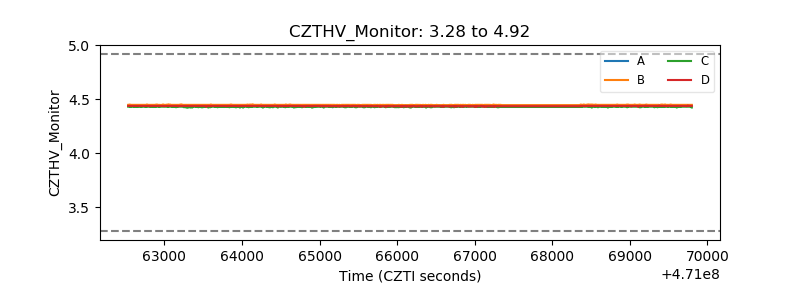 |
| D_VDD | 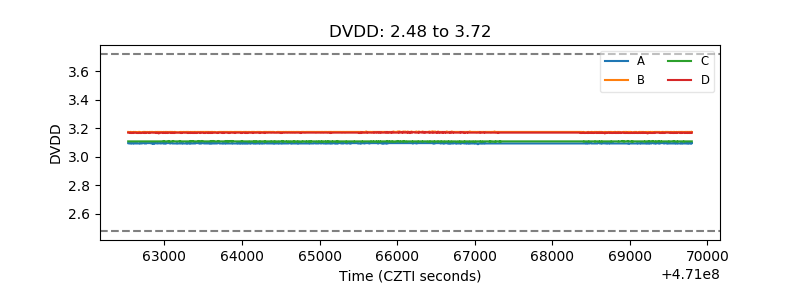 |
| Temperature 1 | 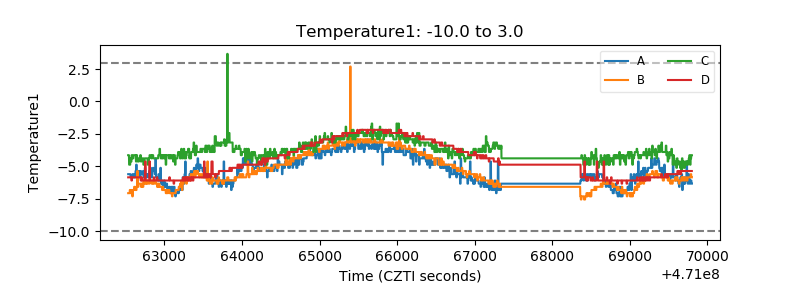 |
| Veto HV Monitor | 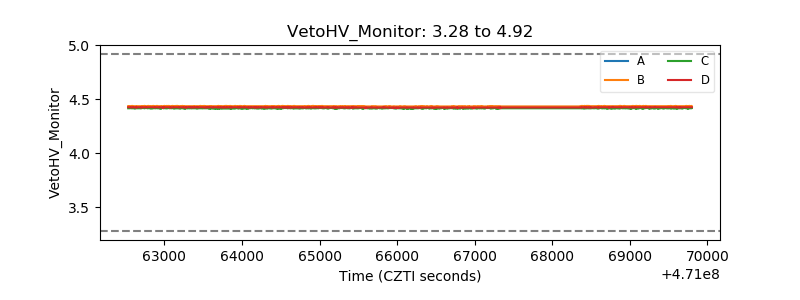 |
| Veto LLD | 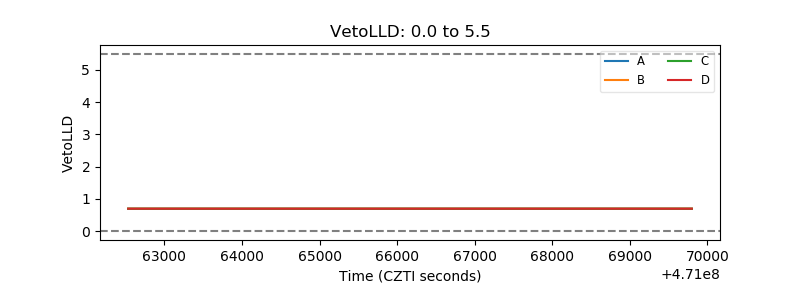 |
| Alpha Counter | 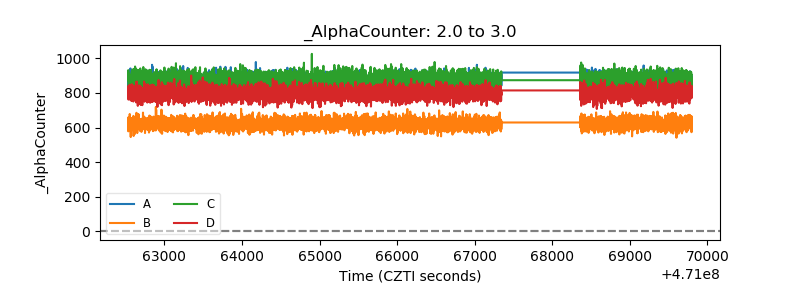 |
| _CPM_Rate | 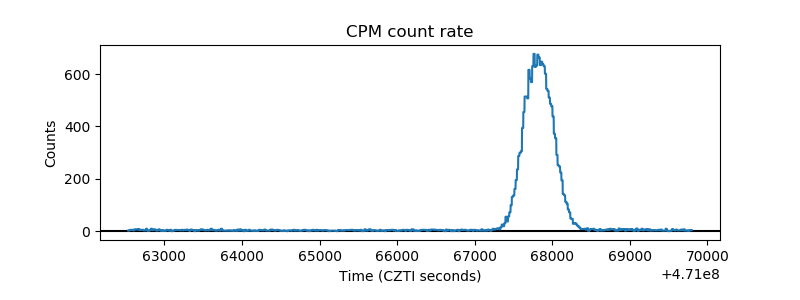 |
| CZT Counter | 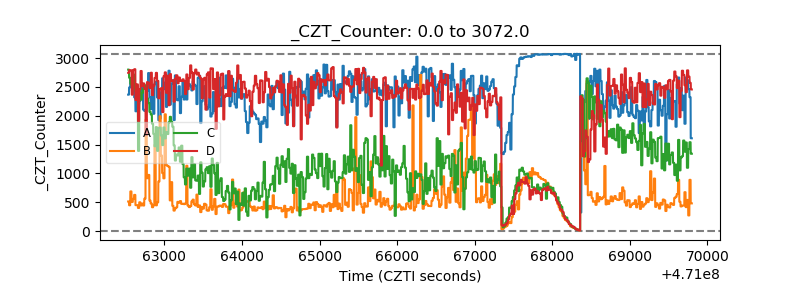 |
| +2.5 Volts monitor | 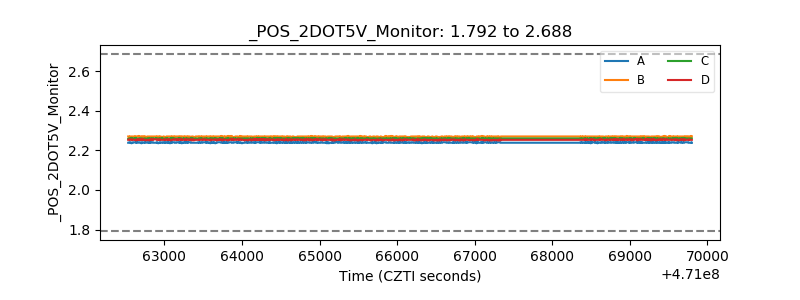 |
| +5 Volts monitor | 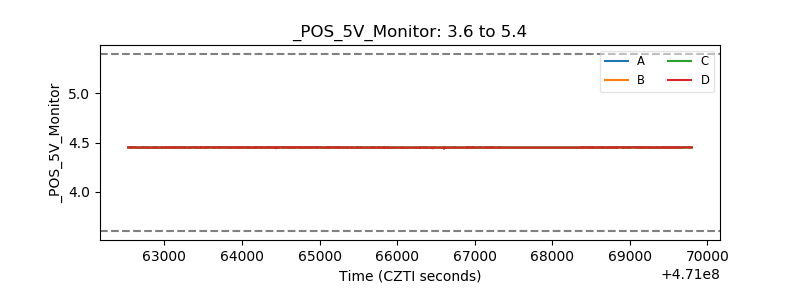 |
| _ROLL_ROT | 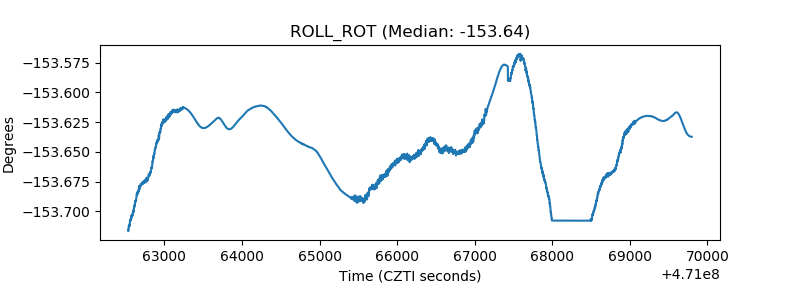 |
| _Roll_DEC | 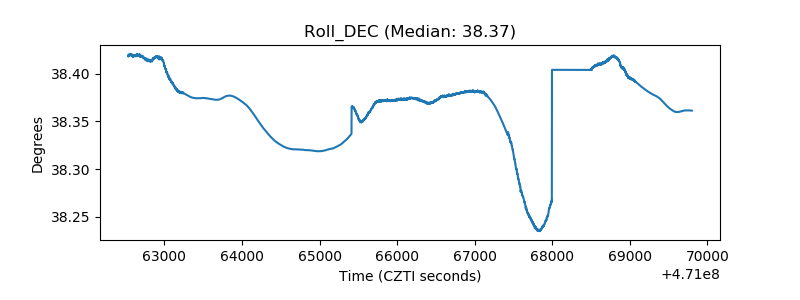 |
| _Roll_RA | 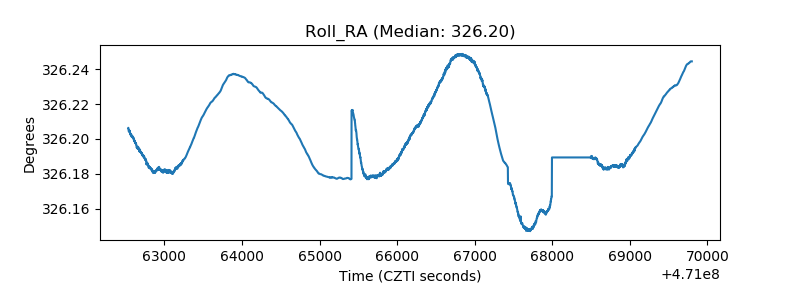 |
| Veto Counter | 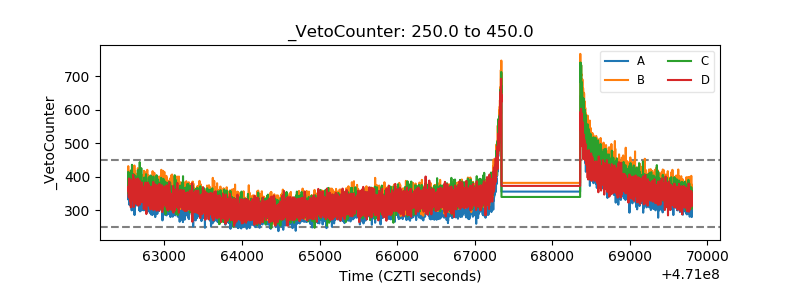 |