| Param | Original file | Final file |
|---|---|---|
| Filename | modeM0/AS1T05_233T01_9000006438_49693cztM0_level2.fits | modeM0/AS1T05_233T01_9000006438_49693cztM0_level2_quad_clean.evt |
| Size (bytes) | 1,189,448,640 | 43,689,600 |
| Size | 1.1 GB | 41.7 MB |
| Events in quadrant A | 15,144,656 | 130,568 |
| Events in quadrant B | 4,152,446 | 679,252 |
| Events in quadrant C | 8,308,236 | 3,133 |
| Events in quadrant D | 15,926,454 | 61,283 |
| Mode M9 | |||
|---|---|---|---|
| Quadrant | BADHDUFLAG | Total packets | Discarded packets |
| A | 0 | 11 | 0 |
| B | 0 | 11 | 0 |
| C | 0 | 11 | 0 |
| D | 0 | 11 | 0 |
| Mode SS | |||
|---|---|---|---|
| Quadrant | BADHDUFLAG | Total packets | Discarded packets |
| A | 0 | 130 | 0 |
| B | 0 | 130 | 0 |
| C | 0 | 130 | 0 |
| D | 0 | 130 | 0 |
| Mode M0 | |||
|---|---|---|---|
| Quadrant | BADHDUFLAG | Total packets | Discarded packets |
| A | 0 | 49338 | 1 |
| B | 0 | 16665 | 1 |
| C | 0 | 29190 | 2 |
| D | 0 | 51780 | 1 |
| Quadrant | Total seconds | Saturated seconds | Saturation percentage |
|---|---|---|---|
| A | 6425 | 5475 | 85.214008% |
| B | 6425 | 237 | 3.688716% |
| C | 6425 | 6409 | 99.750973% |
| D | 6425 | 5957 | 92.715953% |
Noise dominated data is calculated using 1-second bins in cleaned event files. If a bin has >2000 counts, and if more than 50% of those come from <1% of pixels, then it is considered to be noise-dominated and hence unusable.
| Quadrant | # 1 sec bins | Bins with >0 counts | Bins with >2000 counts | High rate bins dominated by noise | Noise dominated (total time) | Noise dominated (detector-on time) | Marked lightcurve |
|---|---|---|---|---|---|---|---|
| A | 7515 | 6425 | 5466 | 5466 | 72.73% | 85.07% | 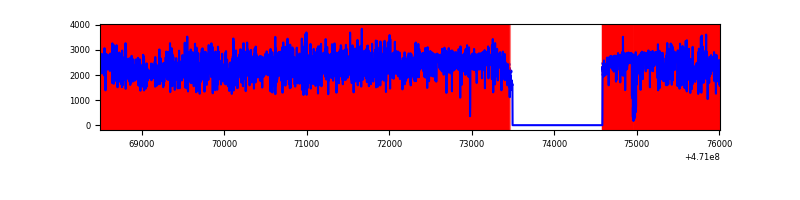 |
| B | 7515 | 6426 | 113 | 113 | 1.50% | 1.76% | 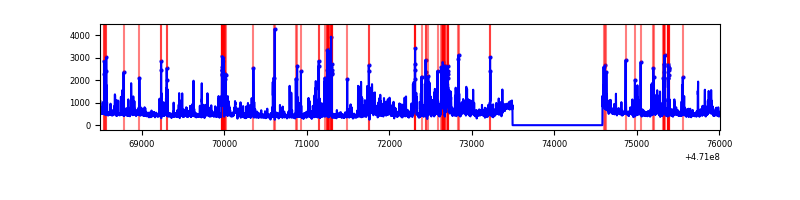 |
| C | 7514 | 6424 | 608 | 608 | 8.09% | 9.46% |  |
| D | 7514 | 6424 | 5746 | 5746 | 76.47% | 89.45% |  |
Top three noisy pixels from each quadrant. If the there are fewer than three noisy pixels in the level2.evt file, extra rows are filled as -1
| Pixel properties | Quadrant properties | ||||||
|---|---|---|---|---|---|---|---|
| Quadrant | DetID | PixID | Counts | Sigma | Mean | Median | Sigma |
| A | 10 | 83 | 6817219 | 47688.32 | 492 | 475 | 142.9 |
| A | 12 | 50 | 1592604 | 11138.16 | 492 | 475 | 142.9 |
| A | 4 | 253 | 855534 | 5981.79 | 492 | 475 | 142.9 |
| B | 4 | 206 | 314806 | 2087.32 | 707 | 685 | 150.5 |
| B | 10 | 44 | 225998 | 1497.2 | 707 | 685 | 150.5 |
| B | 3 | 233 | 194398 | 1287.21 | 707 | 685 | 150.5 |
| C | 15 | 180 | 2318327 | 87204.47 | 54 | 51 | 26.6 |
| C | 15 | 190 | 2209081 | 83095.06 | 54 | 51 | 26.6 |
| C | 15 | 196 | 759464 | 28566.15 | 54 | 51 | 26.6 |
| D | 15 | 40 | 4268323 | 38483.36 | 326 | 312 | 110.9 |
| D | 15 | 168 | 2444633 | 22039.7 | 326 | 312 | 110.9 |
| D | 15 | 106 | 1312183 | 11828.74 | 326 | 312 | 110.9 |
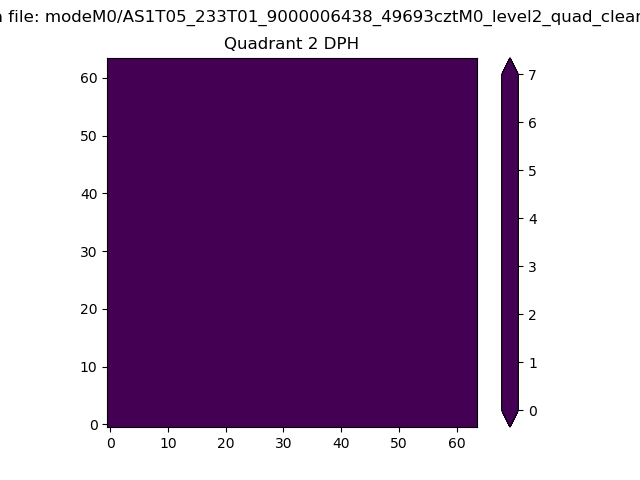
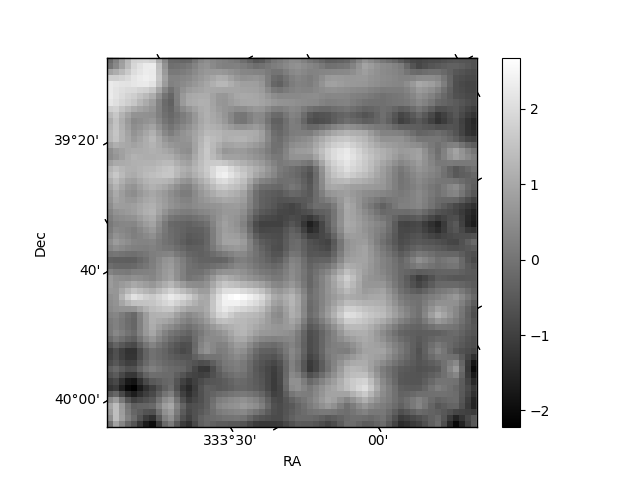
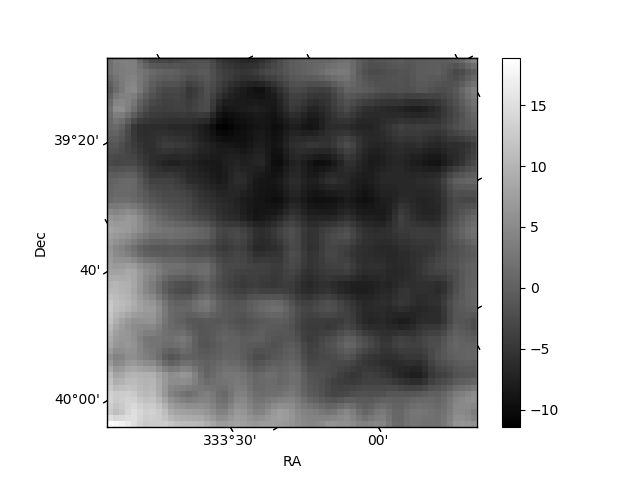
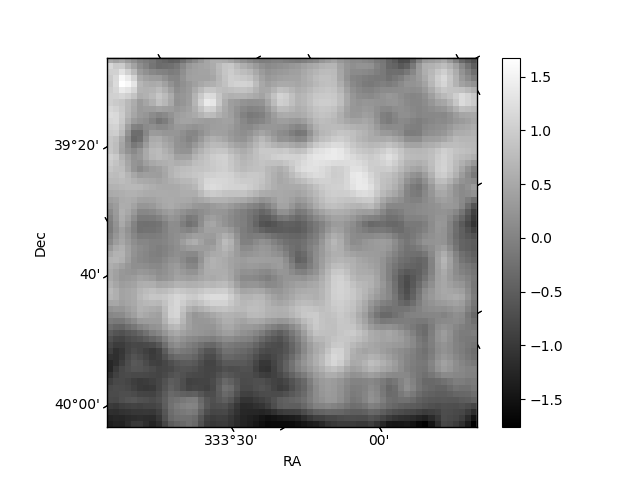
Histogram calculated using DETX and DETY for each event in the final _common_clean file
| Quadrant A | 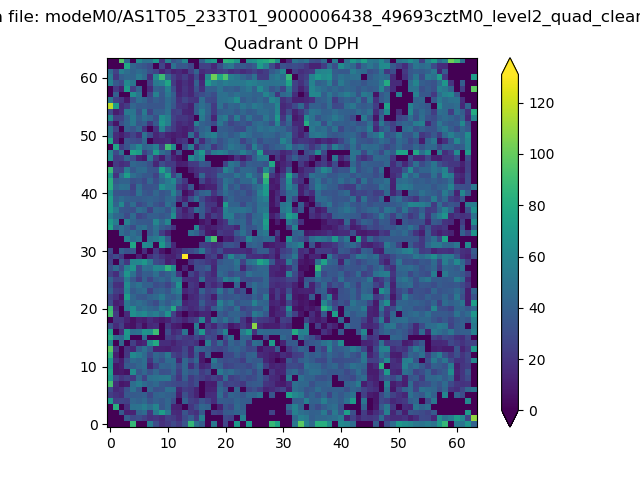 |
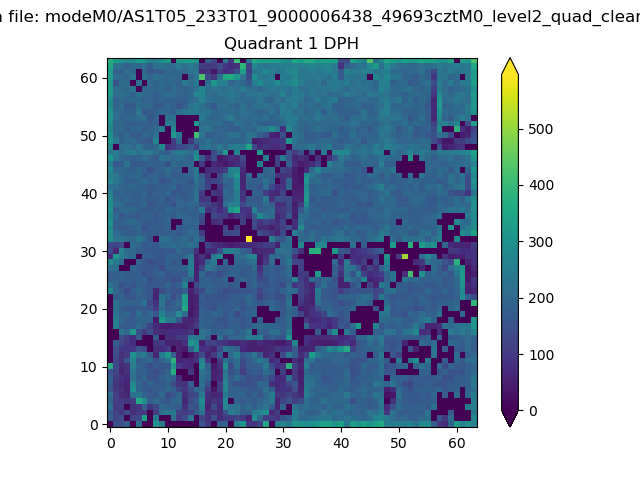 |
Quadrant B |
|---|---|---|---|
| Quadrant D | 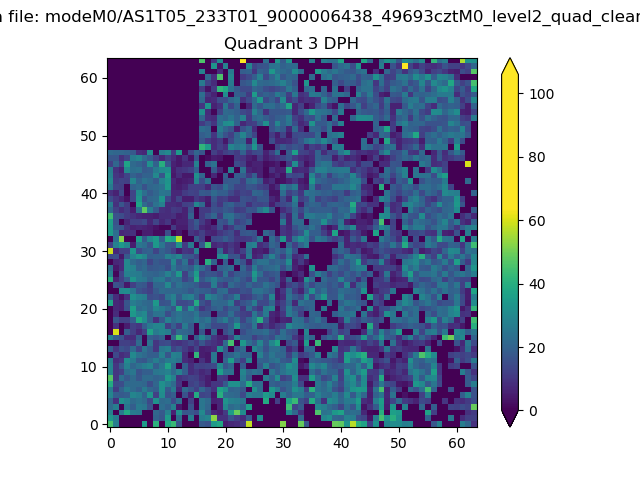 |
 |
Quadrant C |
| Plot type | Count rate plots | Images |
|---|---|---|
| Comparison with Poisson distribution Blue bars denote a histogram of data divided into 1 sec bins. Red curve is a Poisson curve with rate = median count rate of data. |
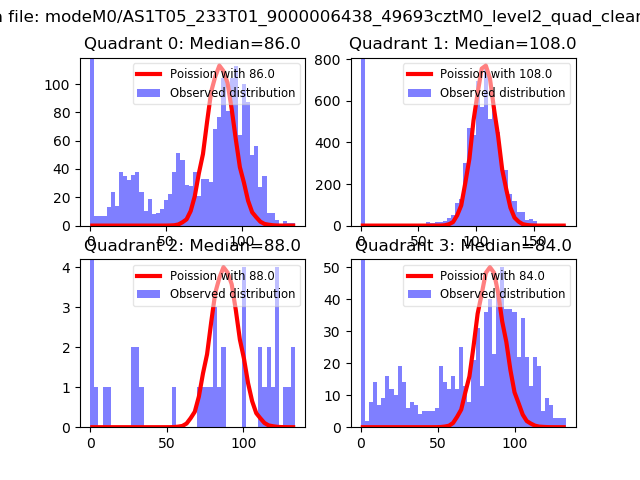 |
 |
| Quadrant-wise count rates Data is divided into 100 sec bins |
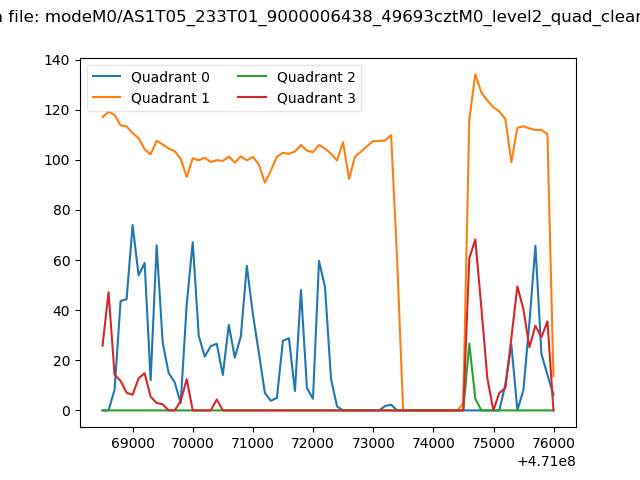 |
|
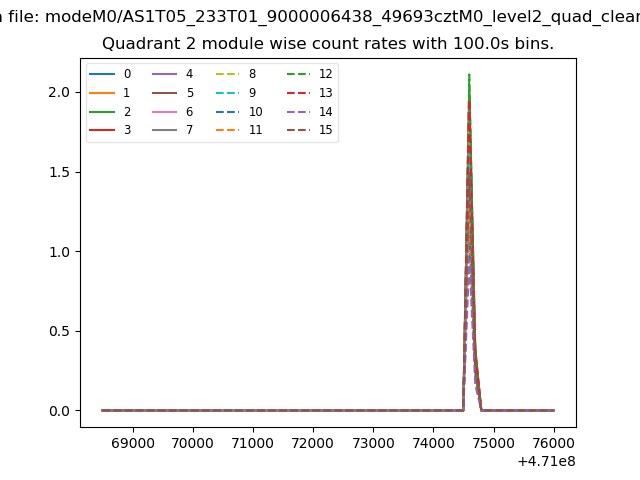
| Module-wise count rates for Quadrant A Data is divided into 100 sec bins |
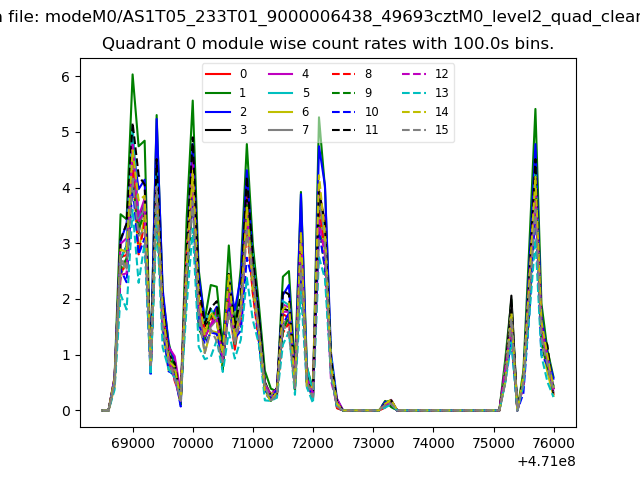 |
 |
| Module-wise count rates for Quadrant B Data is divided into 100 sec bins |
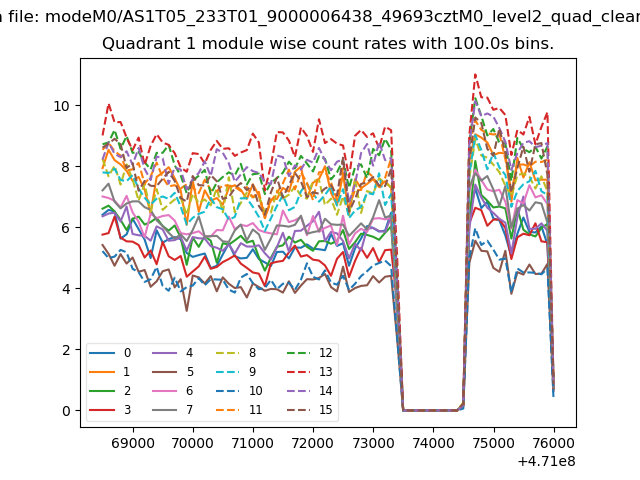 |
 |
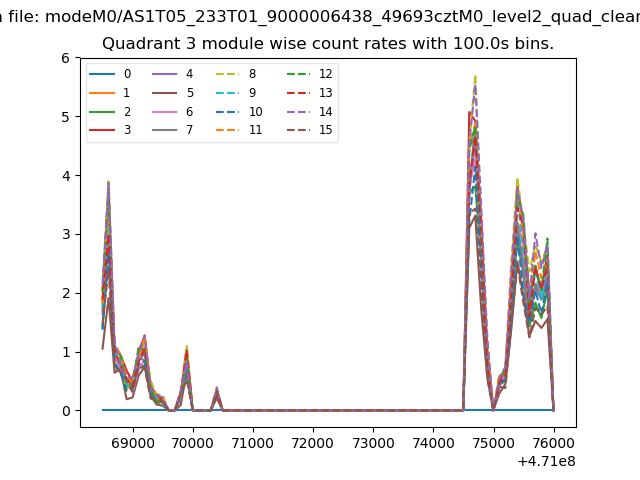
| Module-wise count rates for Quadrant C Data is divided into 100 sec bins |
 |
 |
| Module-wise count rates for Quadrant D Data is divided into 100 sec bins |
 |
 |
| Parameter | Plot |
|---|---|
| CZT HV Monitor | 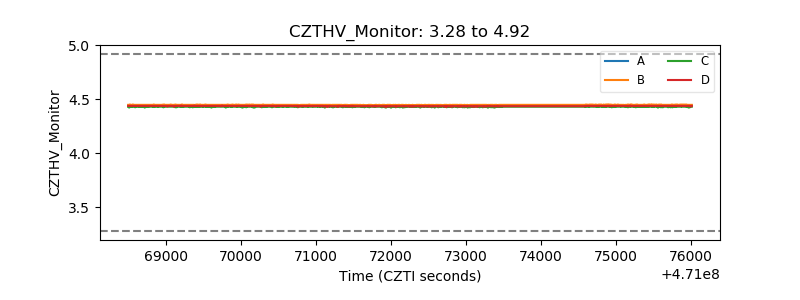 |
| D_VDD | 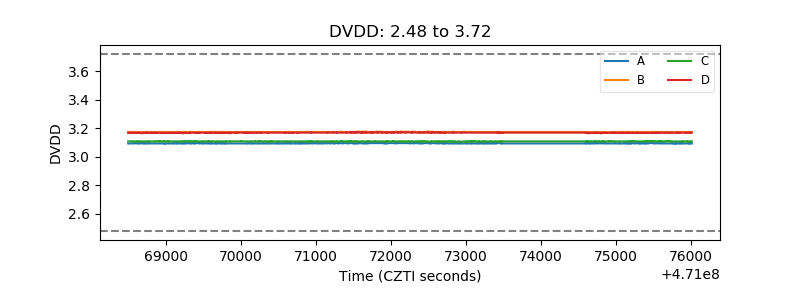 |
| Temperature 1 | 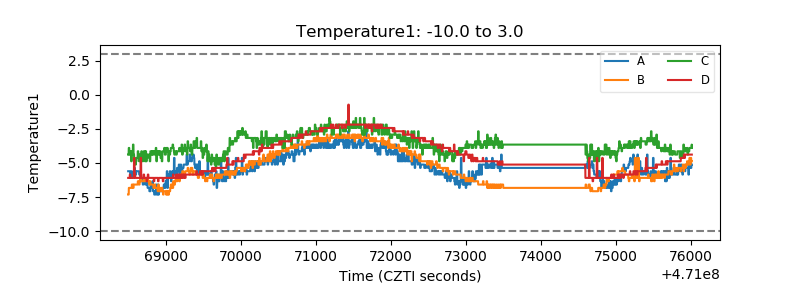 |
| Veto HV Monitor | 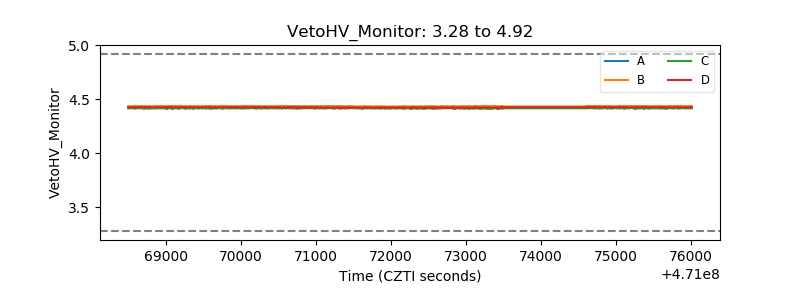 |
| Veto LLD | 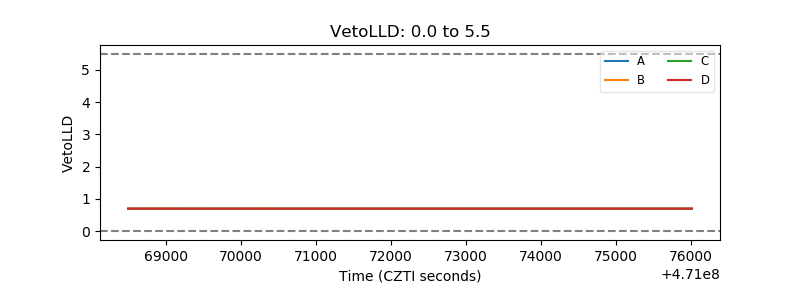 |
| Alpha Counter | 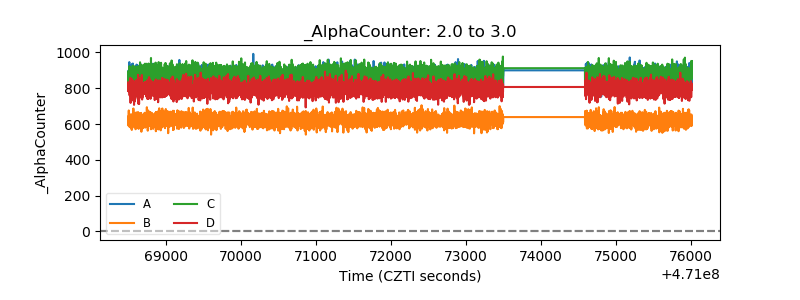 |
| _CPM_Rate | 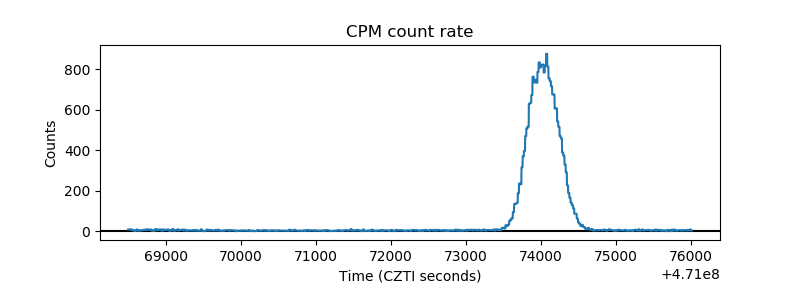 |
| CZT Counter | 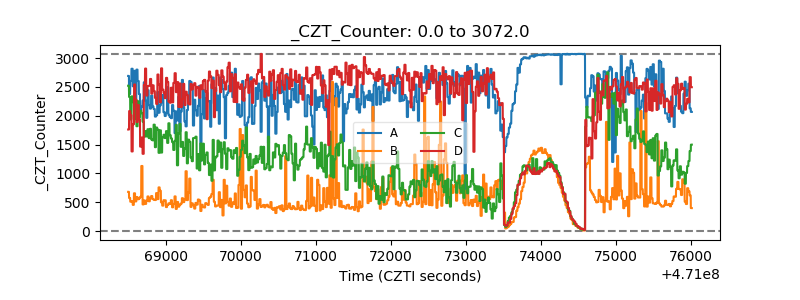 |
| +2.5 Volts monitor | 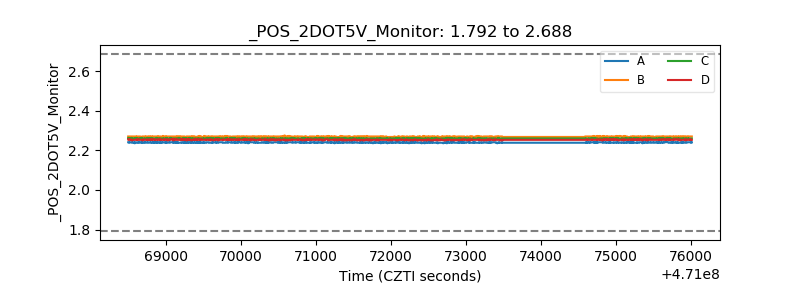 |
| +5 Volts monitor |  |
| _ROLL_ROT | 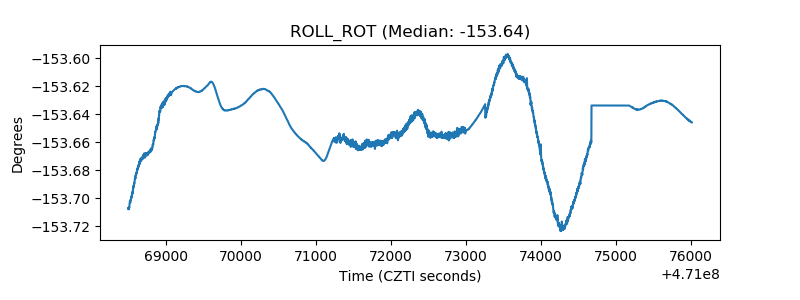 |
| _Roll_DEC | 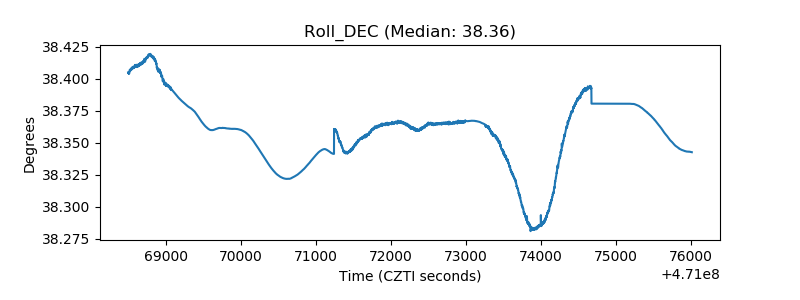 |
| _Roll_RA | 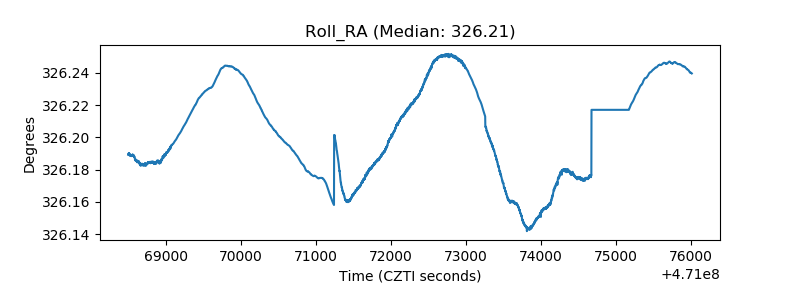 |
| Veto Counter | 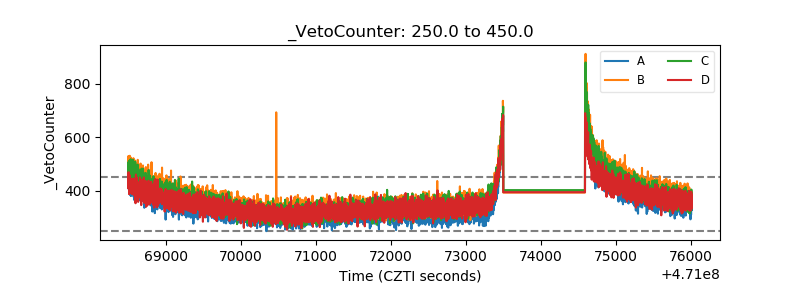 |