| Param | Original file | Final file |
|---|---|---|
| Filename | modeM0/AS1T05_233T01_9000006438_49694cztM0_level2.fits | modeM0/AS1T05_233T01_9000006438_49694cztM0_level2_quad_clean.evt |
| Size (bytes) | 1,141,729,920 | 38,545,920 |
| Size | 1.1 GB | 36.8 MB |
| Events in quadrant A | 14,434,093 | 104,703 |
| Events in quadrant B | 5,793,161 | 578,897 |
| Events in quadrant C | 7,319,066 | 1,724 |
| Events in quadrant D | 14,258,473 | 67,740 |
| Mode M9 | |||
|---|---|---|---|
| Quadrant | BADHDUFLAG | Total packets | Discarded packets |
| A | 0 | 11 | 0 |
| B | 0 | 11 | 0 |
| C | 0 | 11 | 0 |
| D | 0 | 11 | 0 |
| Mode SS | |||
|---|---|---|---|
| Quadrant | BADHDUFLAG | Total packets | Discarded packets |
| A | 0 | 120 | 0 |
| B | 0 | 120 | 0 |
| C | 0 | 120 | 0 |
| D | 0 | 120 | 0 |
| Mode M0 | |||
|---|---|---|---|
| Quadrant | BADHDUFLAG | Total packets | Discarded packets |
| A | 0 | 46866 | 1 |
| B | 0 | 21249 | 1 |
| C | 0 | 25874 | 1 |
| D | 0 | 46402 | 1 |
| Quadrant | Total seconds | Saturated seconds | Saturation percentage |
|---|---|---|---|
| A | 5920 | 5134 | 86.722973% |
| B | 5921 | 872 | 14.727242% |
| C | 5921 | 5907 | 99.763553% |
| D | 5921 | 5364 | 90.592805% |
Noise dominated data is calculated using 1-second bins in cleaned event files. If a bin has >2000 counts, and if more than 50% of those come from <1% of pixels, then it is considered to be noise-dominated and hence unusable.
| Quadrant | # 1 sec bins | Bins with >0 counts | Bins with >2000 counts | High rate bins dominated by noise | Noise dominated (total time) | Noise dominated (detector-on time) | Marked lightcurve |
|---|---|---|---|---|---|---|---|
| A | 7044 | 5919 | 5103 | 5103 | 72.44% | 86.21% | 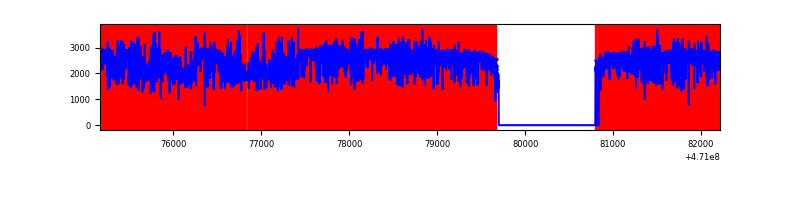 |
| B | 7046 | 5922 | 621 | 621 | 8.81% | 10.49% | 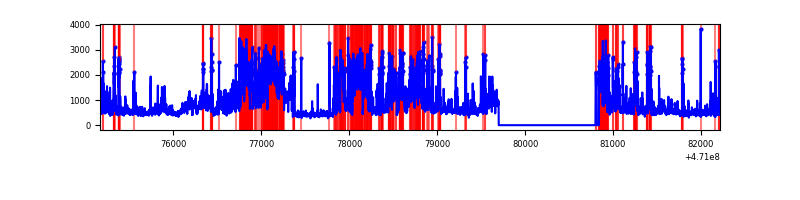 |
| C | 7045 | 5920 | 442 | 442 | 6.27% | 7.47% | 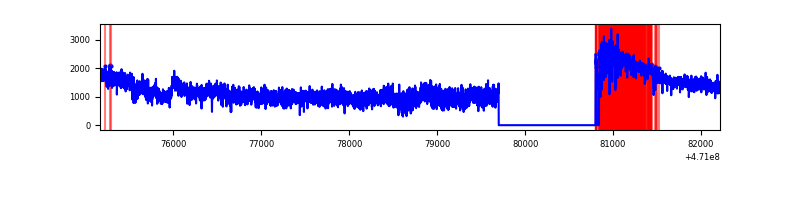 |
| D | 7045 | 5920 | 5214 | 5214 | 74.01% | 88.07% | 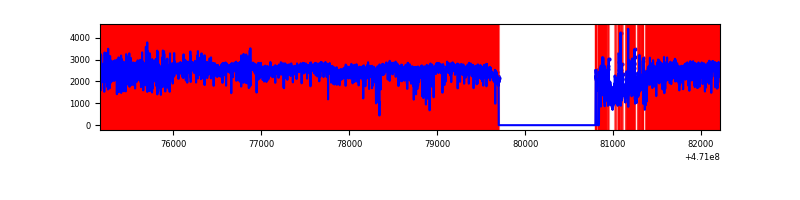 |
Top three noisy pixels from each quadrant. If the there are fewer than three noisy pixels in the level2.evt file, extra rows are filled as -1
| Pixel properties | Quadrant properties | ||||||
|---|---|---|---|---|---|---|---|
| Quadrant | DetID | PixID | Counts | Sigma | Mean | Median | Sigma |
| A | 10 | 83 | 5493678 | 50005.52 | 396 | 384 | 109.9 |
| A | 4 | 253 | 2690210 | 24485.52 | 396 | 384 | 109.9 |
| A | 12 | 50 | 1032605 | 9396.32 | 396 | 384 | 109.9 |
| B | 5 | 172 | 1917508 | 14346.32 | 634 | 614 | 133.6 |
| B | 4 | 206 | 286926 | 2142.8 | 634 | 614 | 133.6 |
| B | 1 | 255 | 234825 | 1752.87 | 634 | 614 | 133.6 |
| C | 15 | 180 | 2583376 | 104883.59 | 43 | 40 | 24.6 |
| C | 15 | 190 | 1929627 | 78341.35 | 43 | 40 | 24.6 |
| C | 15 | 181 | 760307 | 30866.88 | 43 | 40 | 24.6 |
| D | 15 | 40 | 3547557 | 38202.24 | 273 | 262 | 92.9 |
| D | 15 | 168 | 2431784 | 26186.03 | 273 | 262 | 92.9 |
| D | 7 | 45 | 1081624 | 11645.62 | 273 | 262 | 92.9 |
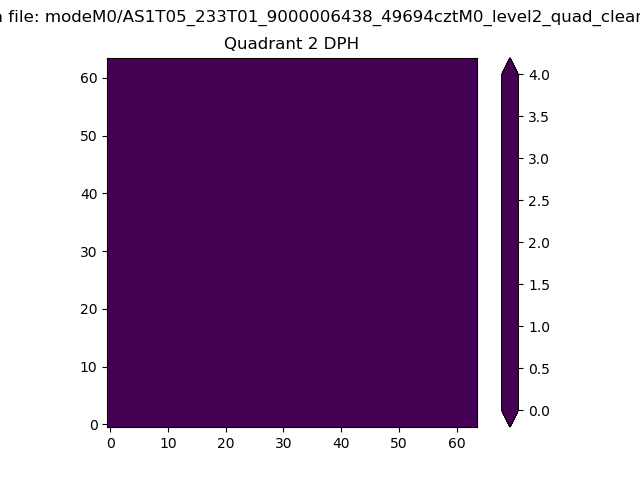
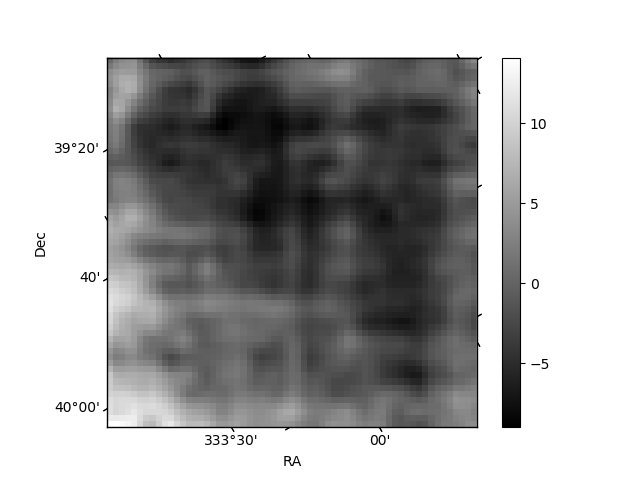
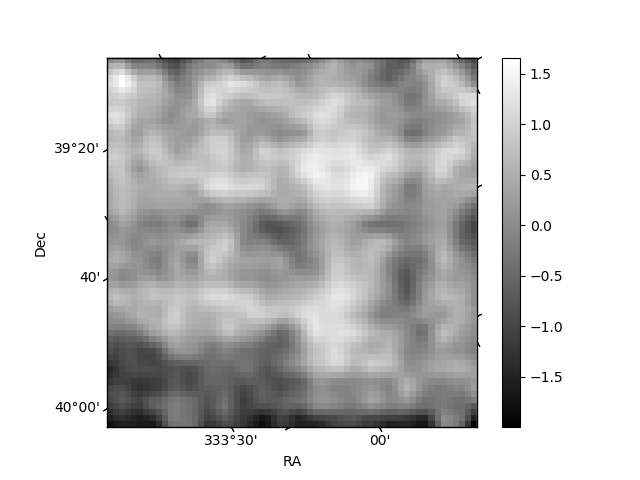
Histogram calculated using DETX and DETY for each event in the final _common_clean file
| Quadrant A | 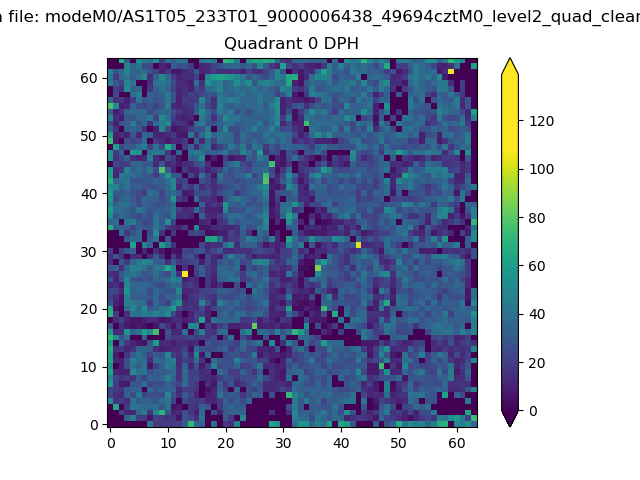 |
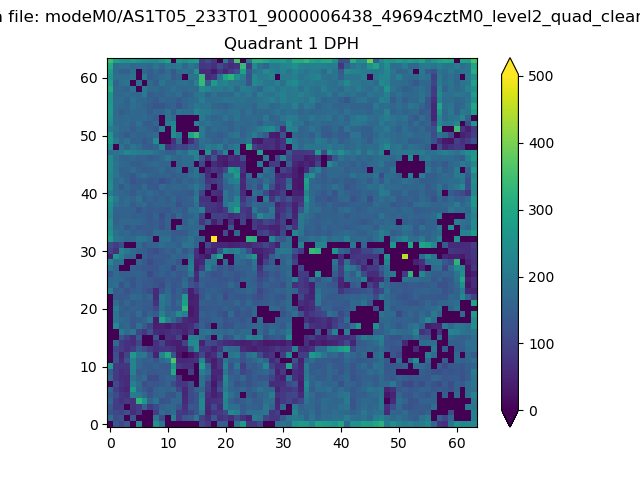 |
Quadrant B |
|---|---|---|---|
| Quadrant D | 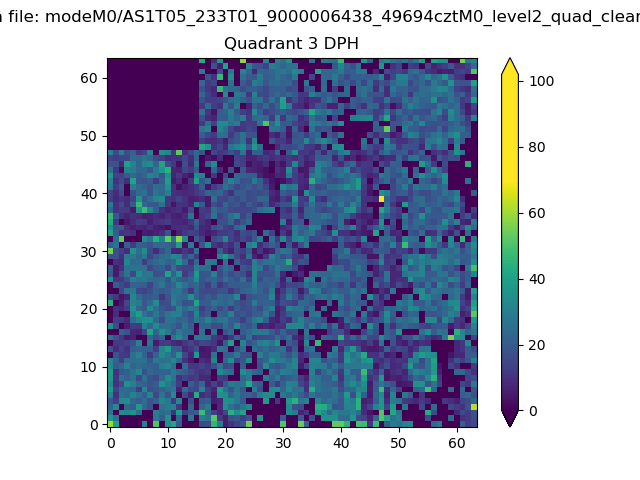 |
 |
Quadrant C |
| Plot type | Count rate plots | Images |
|---|---|---|
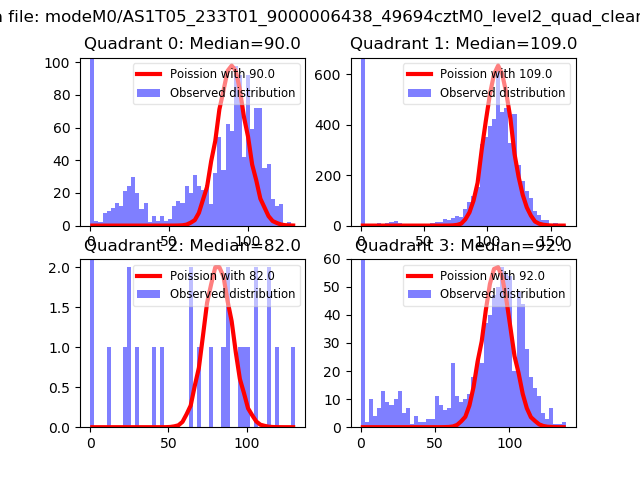
| Comparison with Poisson distribution Blue bars denote a histogram of data divided into 1 sec bins. Red curve is a Poisson curve with rate = median count rate of data. |
 |
 |
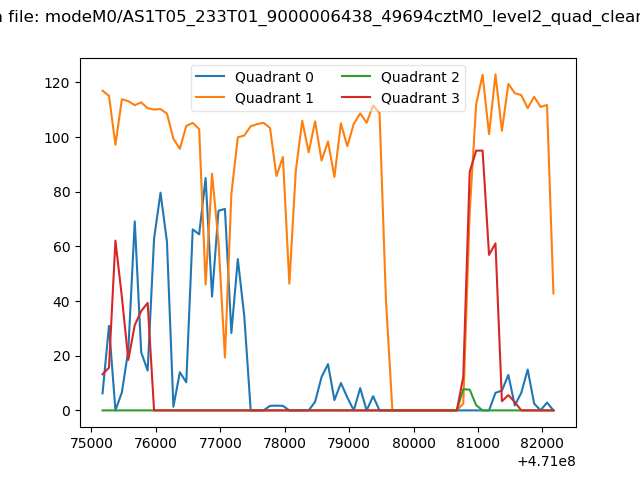
| Quadrant-wise count rates Data is divided into 100 sec bins |
 |
|
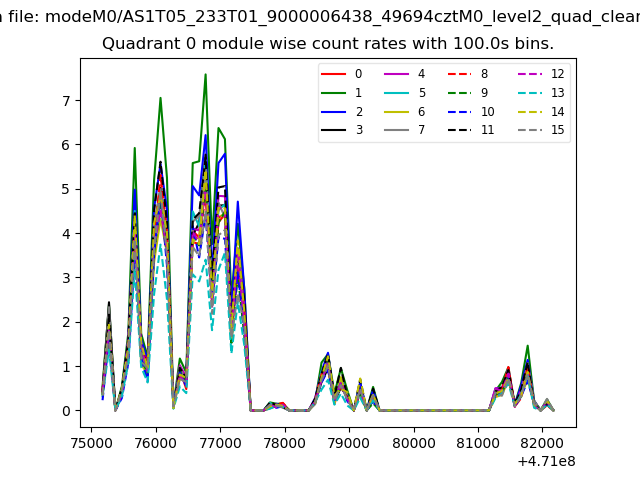
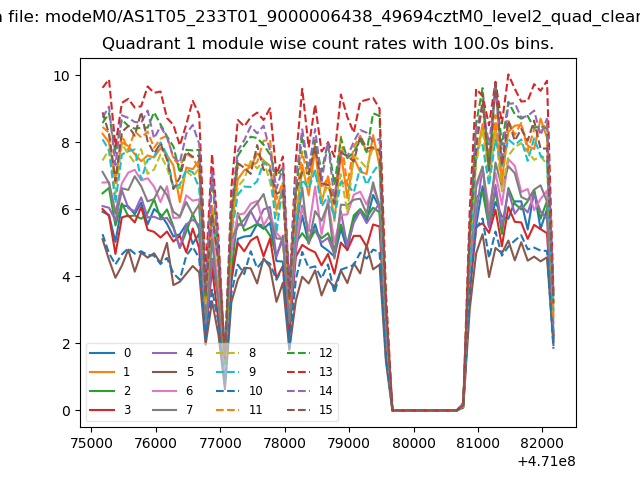
| Module-wise count rates for Quadrant A Data is divided into 100 sec bins |
 |
 |
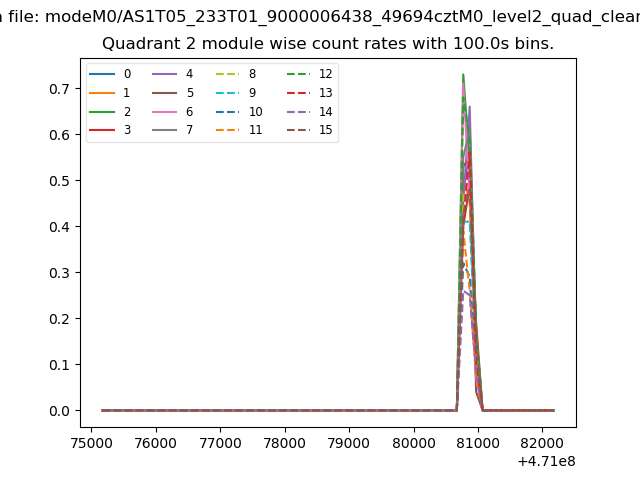
| Module-wise count rates for Quadrant B Data is divided into 100 sec bins |
 |
 |
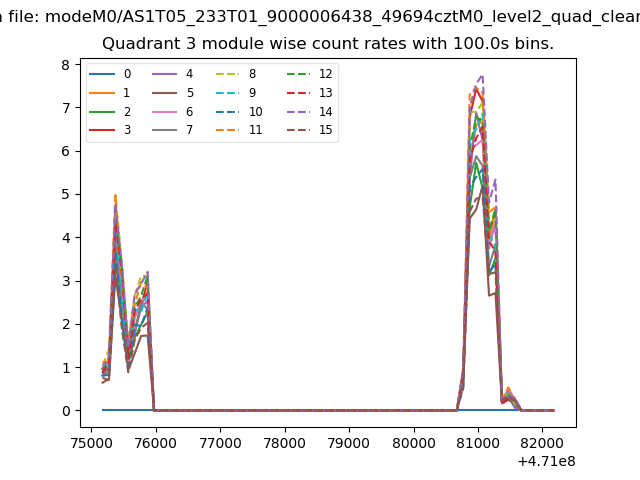
| Module-wise count rates for Quadrant C Data is divided into 100 sec bins |
 |
 |
| Module-wise count rates for Quadrant D Data is divided into 100 sec bins |
 |
 |
| Parameter | Plot |
|---|---|
| CZT HV Monitor |  |
| D_VDD | 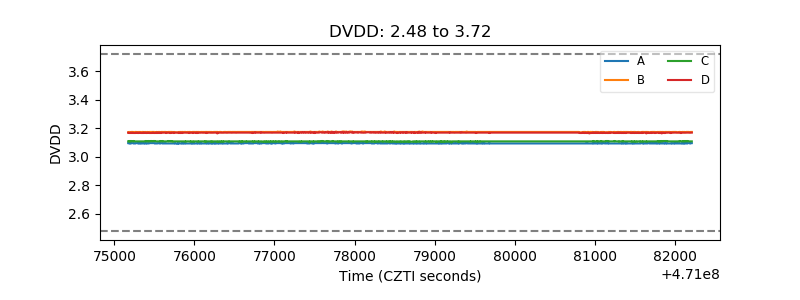 |
| Temperature 1 | 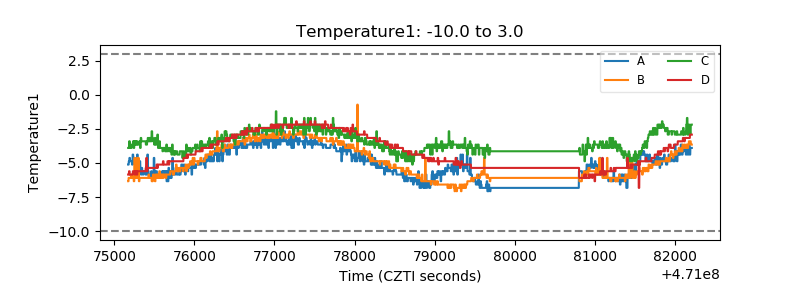 |
| Veto HV Monitor | 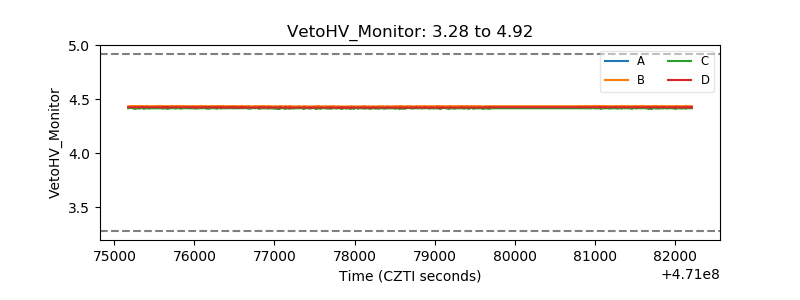 |
| Veto LLD | 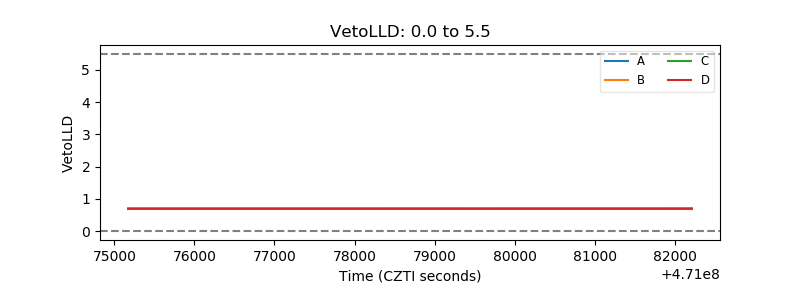 |
| Alpha Counter | 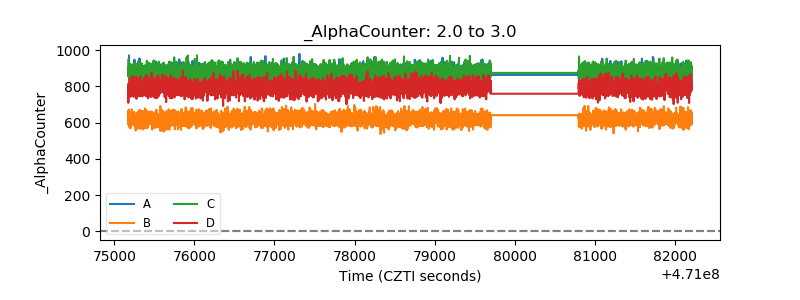 |
| _CPM_Rate | 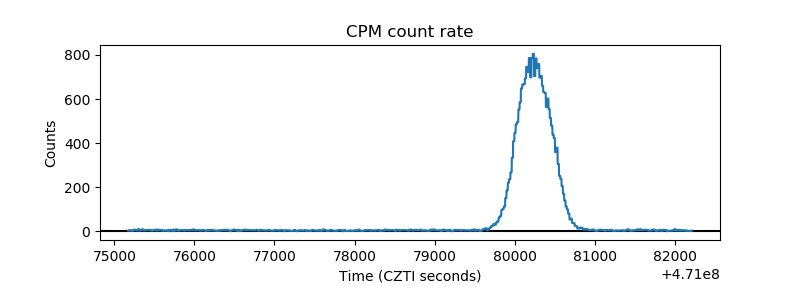 |
| CZT Counter | 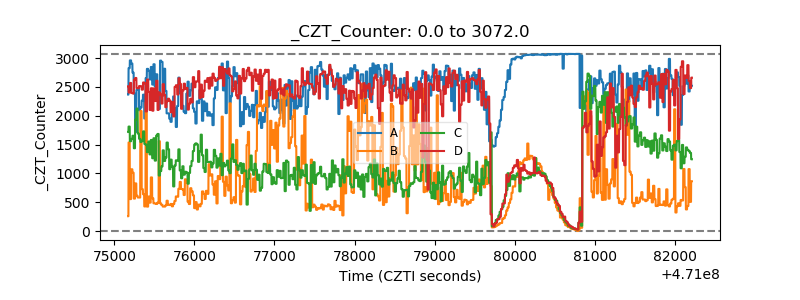 |
| +2.5 Volts monitor | 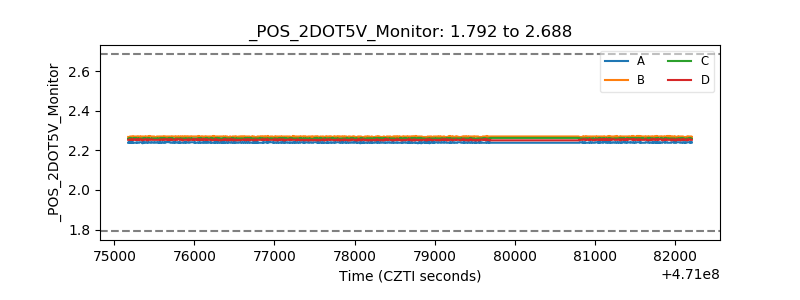 |
| +5 Volts monitor | 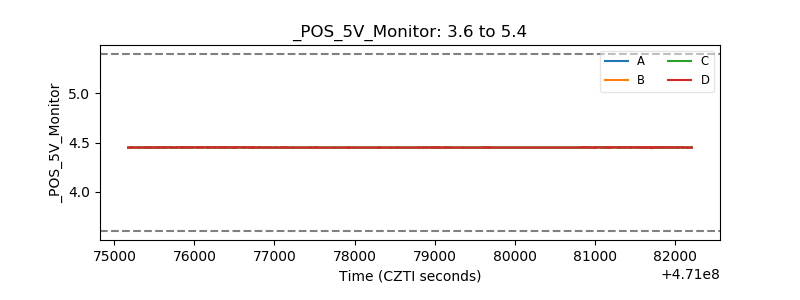 |
| _ROLL_ROT | 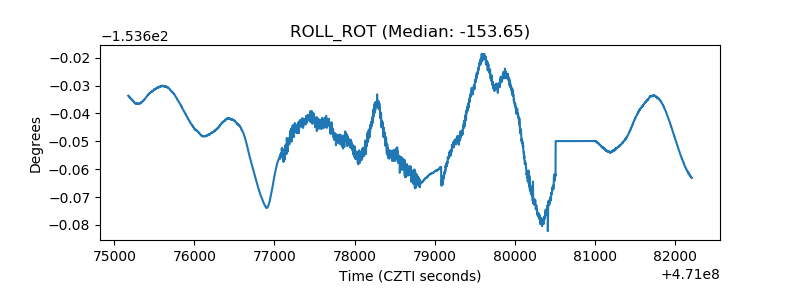 |
| _Roll_DEC | 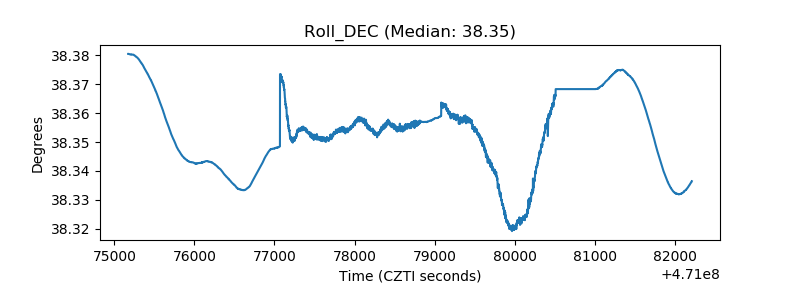 |
| _Roll_RA | 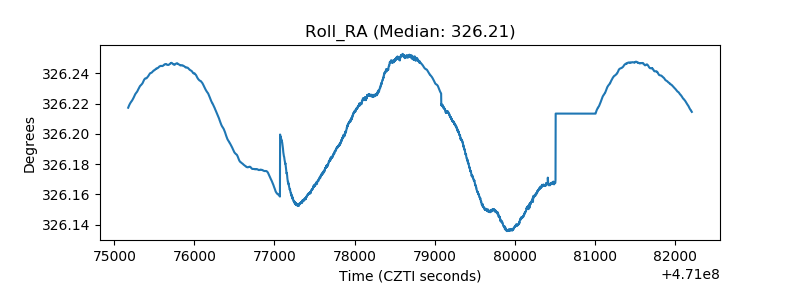 |
| Veto Counter | 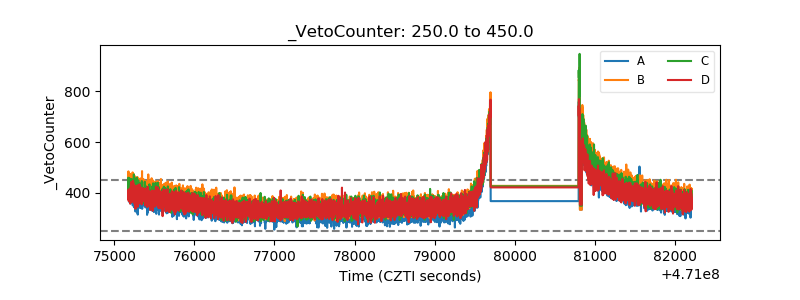 |