| Param | Original file | Final file |
|---|---|---|
| Filename | modeM0/AS1T05_233T01_9000006438_49695cztM0_level2.fits | modeM0/AS1T05_233T01_9000006438_49695cztM0_level2_quad_clean.evt |
| Size (bytes) | 1,192,152,960 | 41,051,520 |
| Size | 1.1 GB | 39.1 MB |
| Events in quadrant A | 15,546,497 | 70,332 |
| Events in quadrant B | 3,912,301 | 674,849 |
| Events in quadrant C | 8,722,068 | 5,058 |
| Events in quadrant D | 15,459,881 | 51,532 |
| Mode M9 | |||
|---|---|---|---|
| Quadrant | BADHDUFLAG | Total packets | Discarded packets |
| A | 0 | 11 | 0 |
| B | 0 | 11 | 0 |
| C | 0 | 11 | 0 |
| D | 0 | 11 | 0 |
| Mode SS | |||
|---|---|---|---|
| Quadrant | BADHDUFLAG | Total packets | Discarded packets |
| A | 0 | 130 | 0 |
| B | 0 | 130 | 0 |
| C | 0 | 130 | 0 |
| D | 0 | 130 | 0 |
| Mode M0 | |||
|---|---|---|---|
| Quadrant | BADHDUFLAG | Total packets | Discarded packets |
| A | 0 | 50492 | 6 |
| B | 0 | 15946 | 1 |
| C | 0 | 30331 | 1 |
| D | 0 | 50303 | 1 |
| Quadrant | Total seconds | Saturated seconds | Saturation percentage |
|---|---|---|---|
| A | 6315 | 5814 | 92.066508% |
| B | 6315 | 294 | 4.655582% |
| C | 6315 | 6280 | 99.445764% |
| D | 6315 | 5868 | 92.921615% |
Noise dominated data is calculated using 1-second bins in cleaned event files. If a bin has >2000 counts, and if more than 50% of those come from <1% of pixels, then it is considered to be noise-dominated and hence unusable.
| Quadrant | # 1 sec bins | Bins with >0 counts | Bins with >2000 counts | High rate bins dominated by noise | Noise dominated (total time) | Noise dominated (detector-on time) | Marked lightcurve |
|---|---|---|---|---|---|---|---|
| A | 7455 | 6315 | 5709 | 5709 | 76.58% | 90.40% | 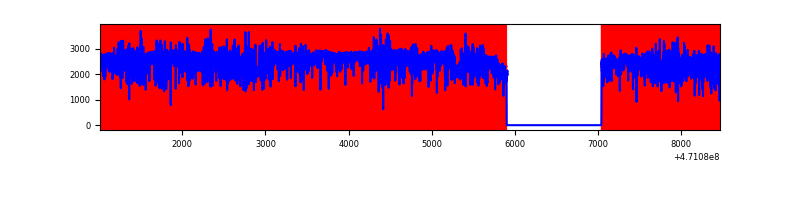 |
| B | 7455 | 6316 | 140 | 140 | 1.88% | 2.22% | 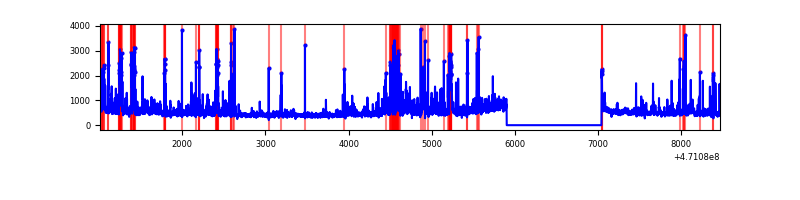 |
| C | 7454 | 6314 | 877 | 877 | 11.77% | 13.89% | 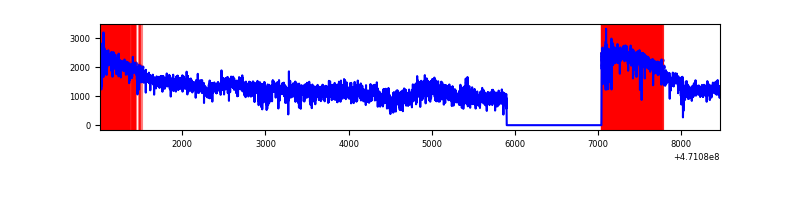 |
| D | 7454 | 6314 | 5423 | 5423 | 72.75% | 85.89% | 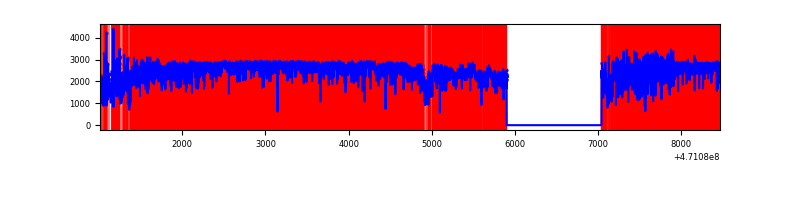 |
Top three noisy pixels from each quadrant. If the there are fewer than three noisy pixels in the level2.evt file, extra rows are filled as -1
| Pixel properties | Quadrant properties | ||||||
|---|---|---|---|---|---|---|---|
| Quadrant | DetID | PixID | Counts | Sigma | Mean | Median | Sigma |
| A | 10 | 83 | 5924420 | 47964.84 | 414 | 400 | 123.5 |
| A | 4 | 253 | 1657633 | 13418.07 | 414 | 400 | 123.5 |
| A | 12 | 50 | 1257433 | 10177.78 | 414 | 400 | 123.5 |
| B | 4 | 206 | 288844 | 1935.99 | 697 | 676 | 148.8 |
| B | 1 | 255 | 147218 | 984.51 | 697 | 676 | 148.8 |
| B | 7 | 252 | 139532 | 932.87 | 697 | 676 | 148.8 |
| C | 15 | 180 | 3318117 | 130650.7 | 59 | 57 | 25.4 |
| C | 15 | 190 | 2253637 | 88736.13 | 59 | 57 | 25.4 |
| C | 15 | 181 | 689307 | 27139.65 | 59 | 57 | 25.4 |
| D | 15 | 40 | 3749415 | 37326.97 | 258 | 244 | 100.4 |
| D | 15 | 168 | 2048931 | 20396.85 | 258 | 244 | 100.4 |
| D | 15 | 184 | 1589867 | 15826.38 | 258 | 244 | 100.4 |
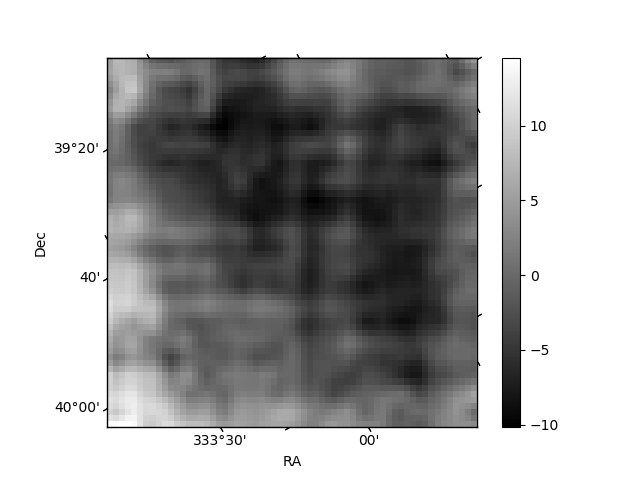
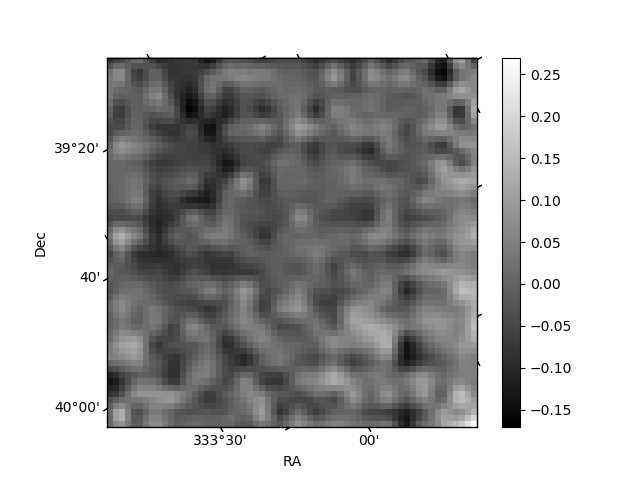
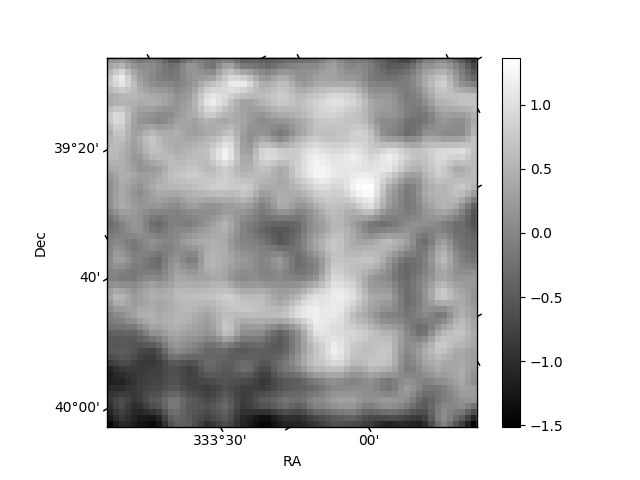
Histogram calculated using DETX and DETY for each event in the final _common_clean file
| Quadrant A | 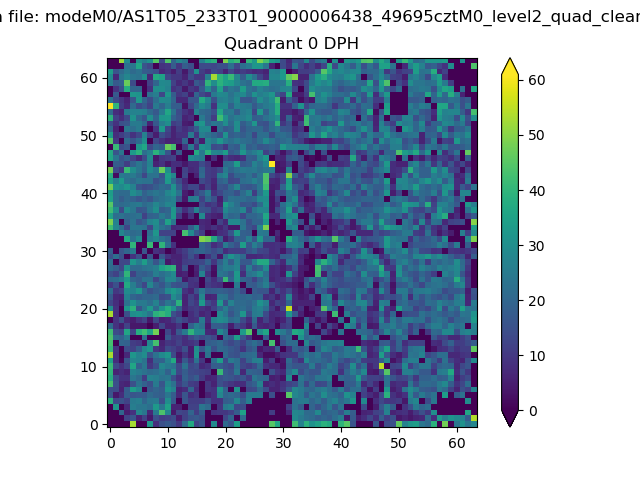 |
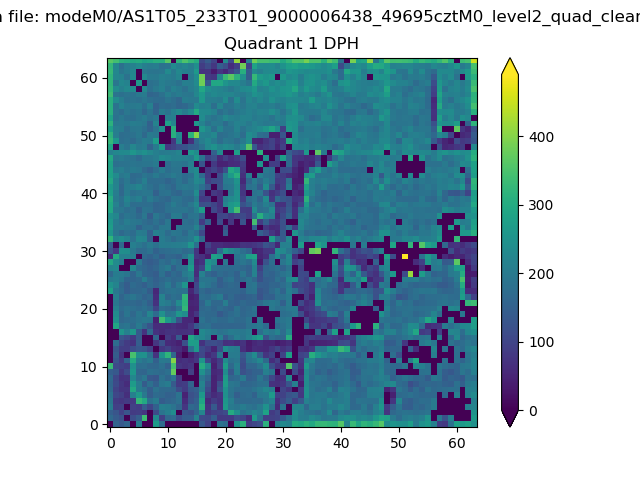 |
Quadrant B |
|---|---|---|---|
| Quadrant D | 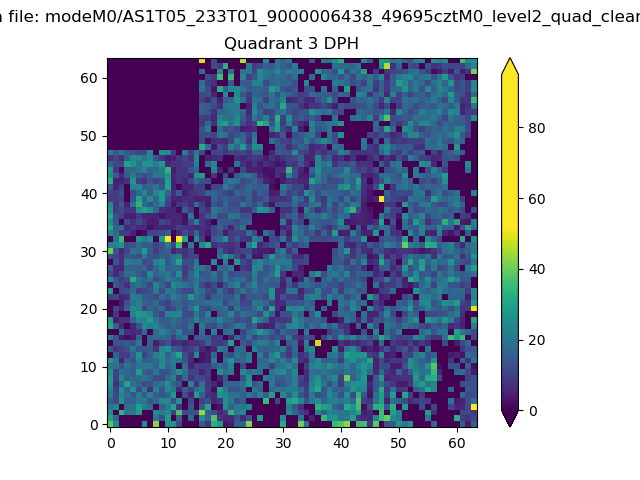 |
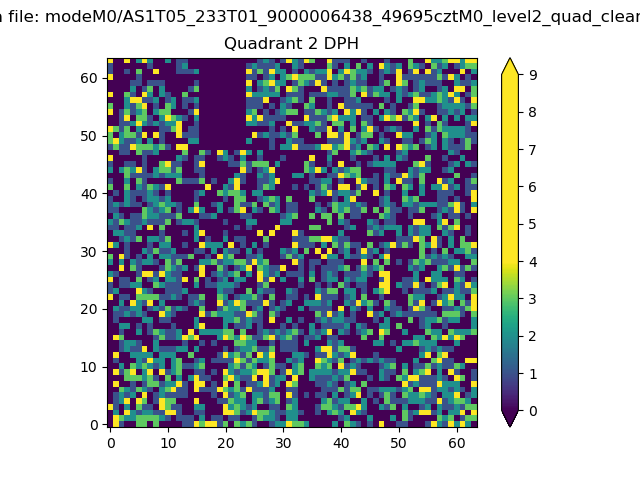 |
Quadrant C |
| Plot type | Count rate plots | Images |
|---|---|---|
| Comparison with Poisson distribution Blue bars denote a histogram of data divided into 1 sec bins. Red curve is a Poisson curve with rate = median count rate of data. |
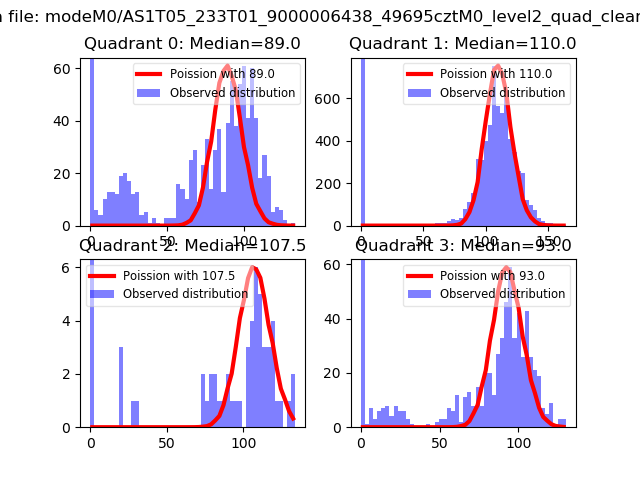 |
 |
| Quadrant-wise count rates Data is divided into 100 sec bins |
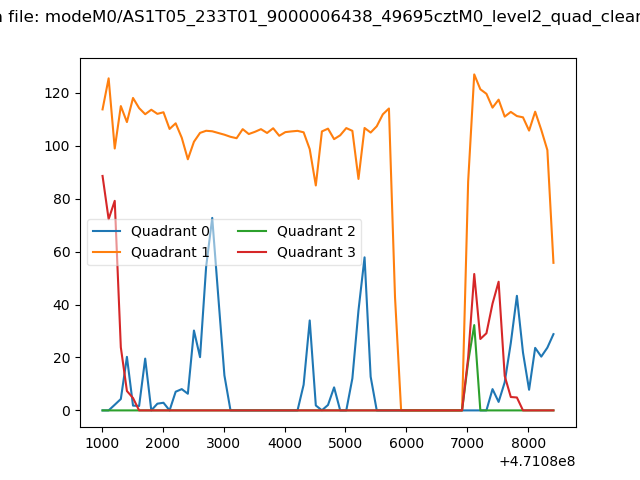 |
|
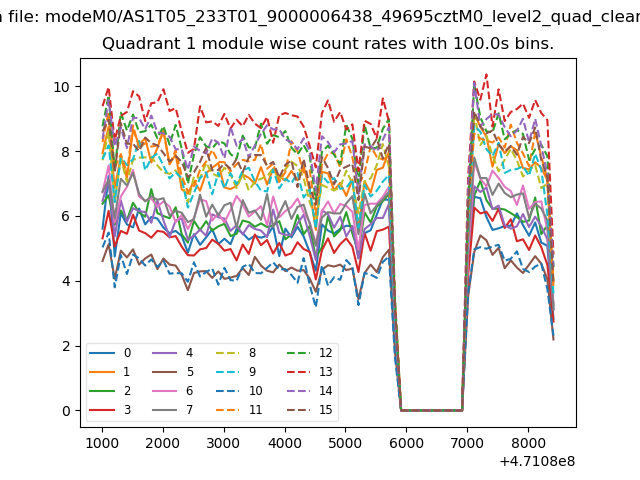
| Module-wise count rates for Quadrant A Data is divided into 100 sec bins |
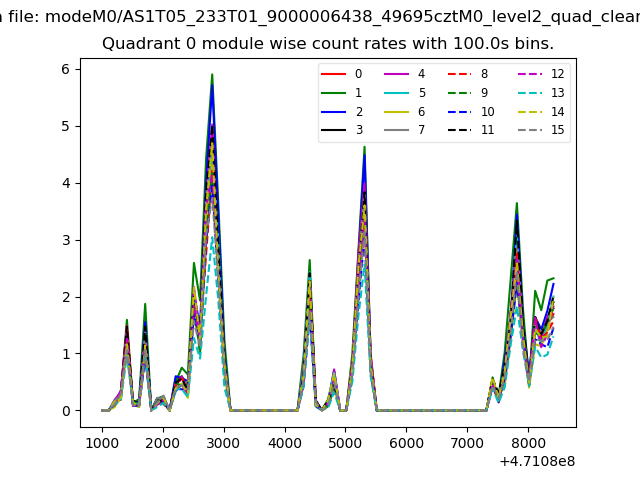 |
 |
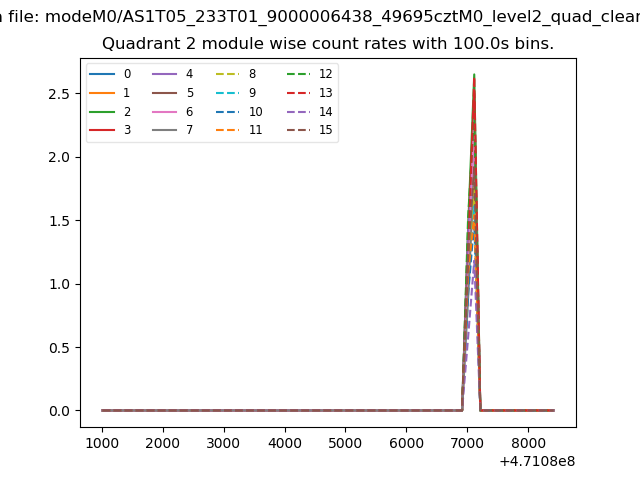
| Module-wise count rates for Quadrant B Data is divided into 100 sec bins |
 |
 |
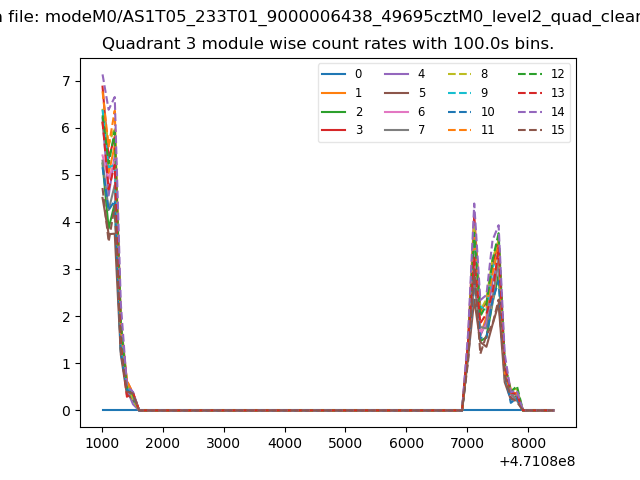
| Module-wise count rates for Quadrant C Data is divided into 100 sec bins |
 |
 |
| Module-wise count rates for Quadrant D Data is divided into 100 sec bins |
 |
 |
| Parameter | Plot |
|---|---|
| CZT HV Monitor | 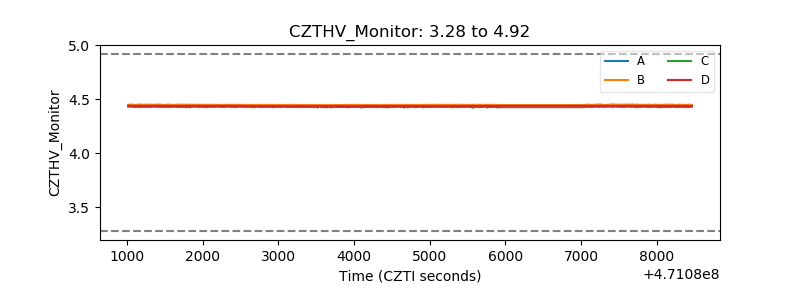 |
| D_VDD | 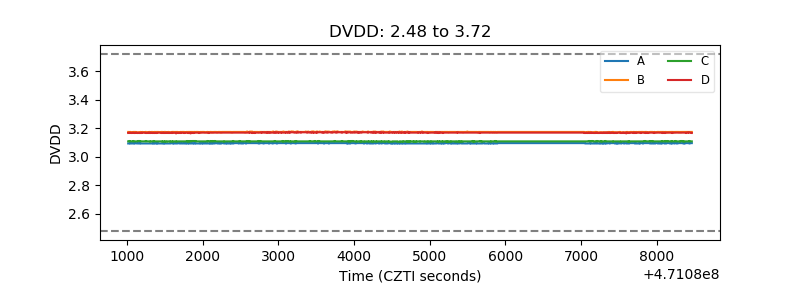 |
| Temperature 1 | 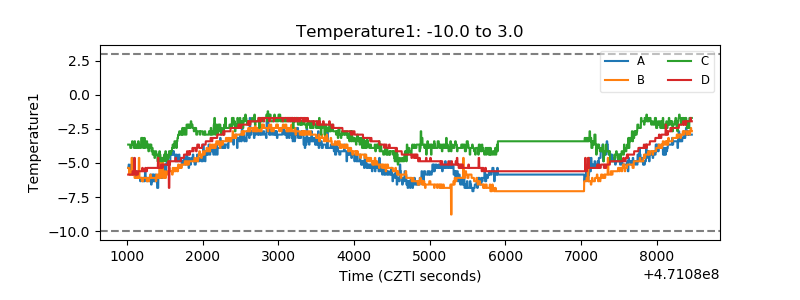 |
| Veto HV Monitor |  |
| Veto LLD | 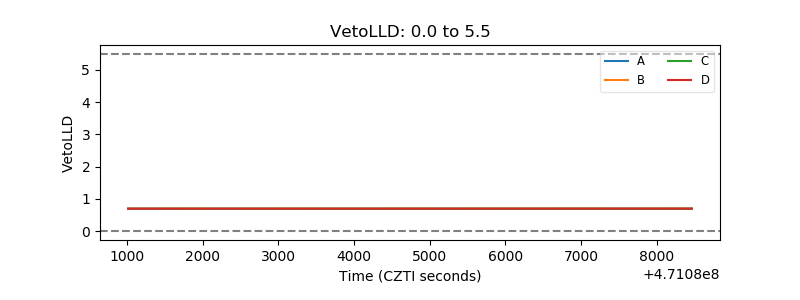 |
| Alpha Counter | 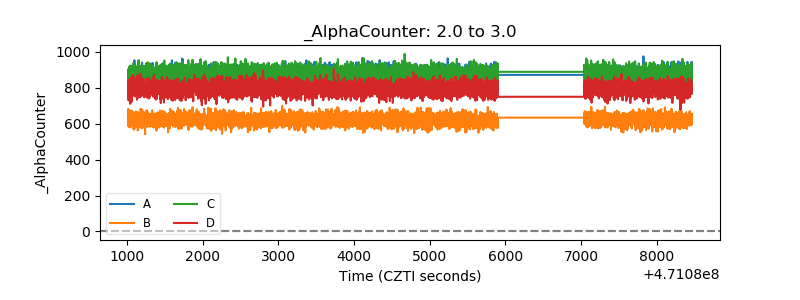 |
| _CPM_Rate | 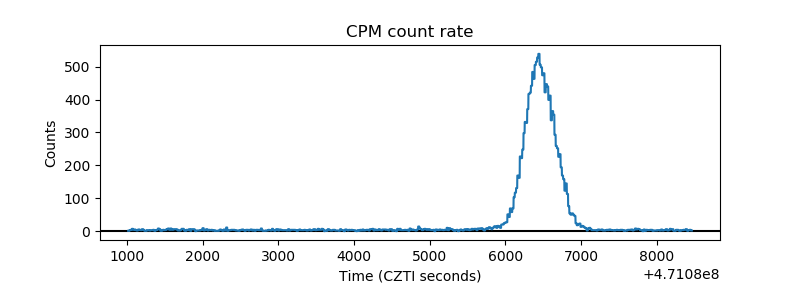 |
| CZT Counter | 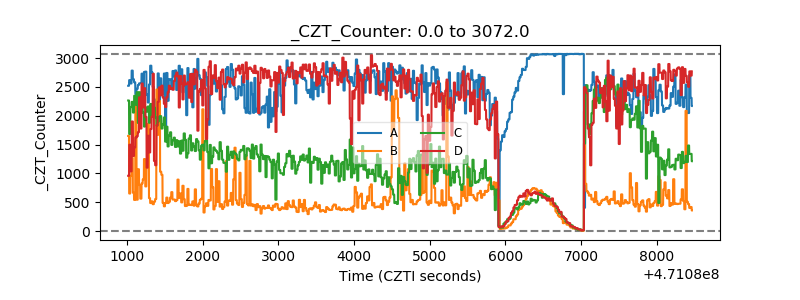 |
| +2.5 Volts monitor | 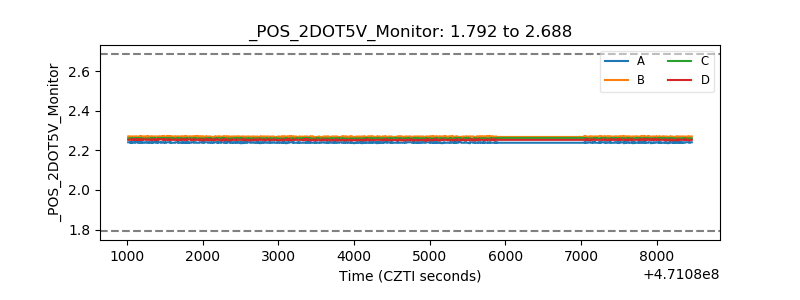 |
| +5 Volts monitor | 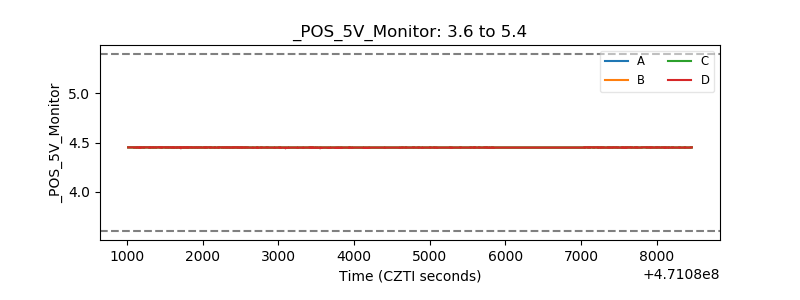 |
| _ROLL_ROT | 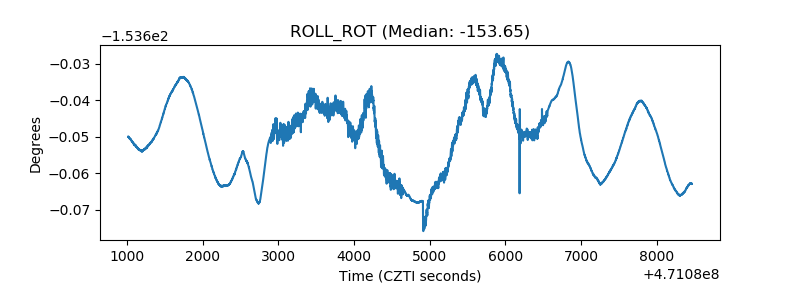 |
| _Roll_DEC | 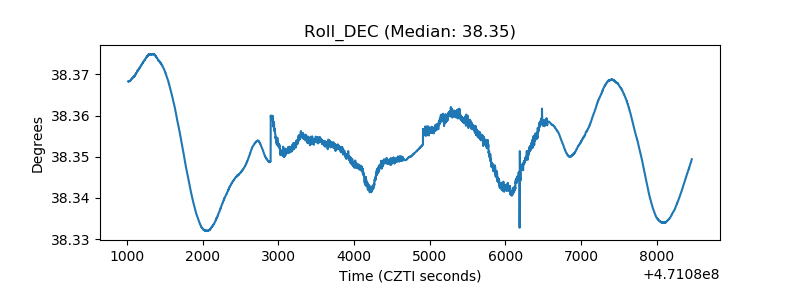 |
| _Roll_RA | 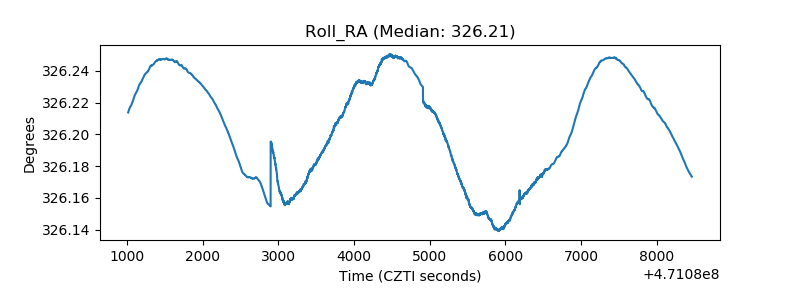 |
| Veto Counter | 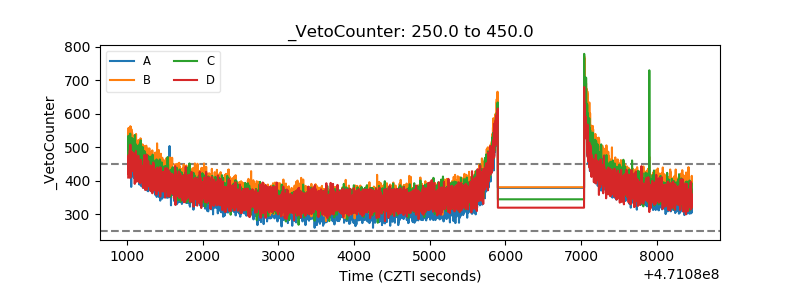 |