| Param | Original file | Final file |
|---|---|---|
| Filename | modeM0/AS1T05_233T01_9000006438_49697cztM0_level2.fits | modeM0/AS1T05_233T01_9000006438_49697cztM0_level2_quad_clean.evt |
| Size (bytes) | 1,153,800,000 | 51,681,600 |
| Size | 1.1 GB | 49.3 MB |
| Events in quadrant A | 15,027,479 | 357,553 |
| Events in quadrant B | 3,611,554 | 632,278 |
| Events in quadrant C | 7,566,048 | 15,480 |
| Events in quadrant D | 16,028,634 | 122,022 |
| Mode M9 | |||
|---|---|---|---|
| Quadrant | BADHDUFLAG | Total packets | Discarded packets |
| A | 0 | 8 | 0 |
| B | 0 | 8 | 0 |
| C | 0 | 8 | 0 |
| D | 0 | 8 | 0 |
| Mode SS | |||
|---|---|---|---|
| Quadrant | BADHDUFLAG | Total packets | Discarded packets |
| A | 0 | 124 | 0 |
| B | 0 | 124 | 0 |
| C | 0 | 124 | 0 |
| D | 0 | 124 | 0 |
| Mode M0 | |||
|---|---|---|---|
| Quadrant | BADHDUFLAG | Total packets | Discarded packets |
| A | 0 | 48874 | 0 |
| B | 0 | 14911 | 0 |
| C | 0 | 26817 | 0 |
| D | 0 | 51827 | 0 |
| Quadrant | Total seconds | Saturated seconds | Saturation percentage |
|---|---|---|---|
| A | 6147 | 5697 | 92.679356% |
| B | 6147 | 202 | 3.286156% |
| C | 6146 | 6146 | 100.000000% |
| D | 6146 | 6099 | 99.235275% |
Noise dominated data is calculated using 1-second bins in cleaned event files. If a bin has >2000 counts, and if more than 50% of those come from <1% of pixels, then it is considered to be noise-dominated and hence unusable.
| Quadrant | # 1 sec bins | Bins with >0 counts | Bins with >2000 counts | High rate bins dominated by noise | Noise dominated (total time) | Noise dominated (detector-on time) | Marked lightcurve |
|---|---|---|---|---|---|---|---|
| A | 6942 | 6146 | 5555 | 5555 | 80.02% | 90.38% | 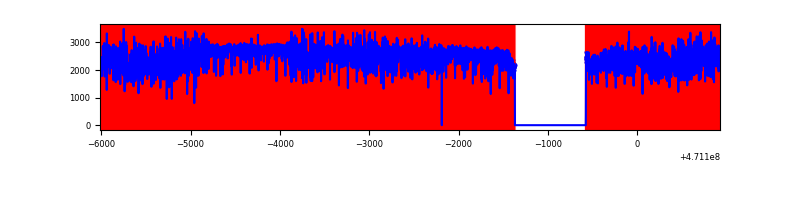 |
| B | 6943 | 6149 | 106 | 106 | 1.53% | 1.72% | 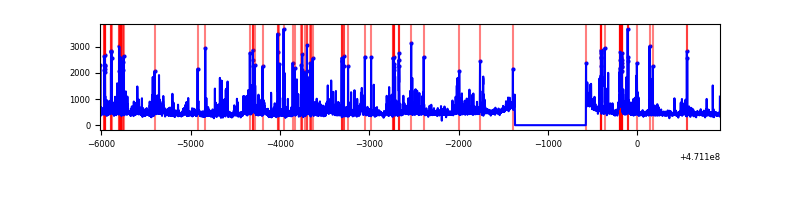 |
| C | 6941 | 6145 | 518 | 518 | 7.46% | 8.43% | 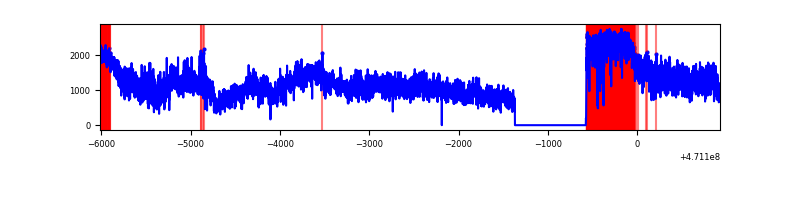 |
| D | 6941 | 6145 | 5855 | 5855 | 84.35% | 95.28% | 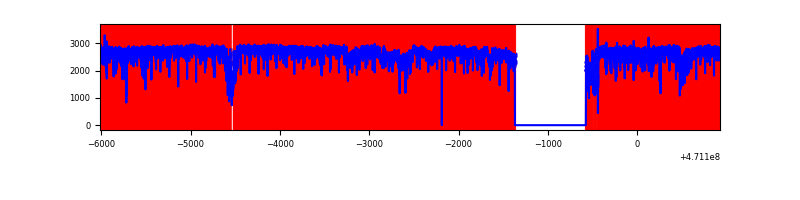 |
Top three noisy pixels from each quadrant. If the there are fewer than three noisy pixels in the level2.evt file, extra rows are filled as -1
| Pixel properties | Quadrant properties | ||||||
|---|---|---|---|---|---|---|---|
| Quadrant | DetID | PixID | Counts | Sigma | Mean | Median | Sigma |
| A | 10 | 83 | 6208845 | 53002.5 | 415 | 401 | 117.1 |
| A | 3 | 130 | 1626336 | 13880.87 | 415 | 401 | 117.1 |
| A | 12 | 50 | 1229007 | 10488.81 | 415 | 401 | 117.1 |
| B | 4 | 206 | 316345 | 2300.63 | 649 | 628 | 137.2 |
| B | 5 | 185 | 115930 | 840.2 | 649 | 628 | 137.2 |
| B | 1 | 255 | 97433 | 705.42 | 649 | 628 | 137.2 |
| C | 15 | 180 | 1698716 | 75801.84 | 36 | 33 | 22.4 |
| C | 15 | 190 | 1571977 | 70146.25 | 36 | 33 | 22.4 |
| C | 15 | 181 | 1304413 | 58206.51 | 36 | 33 | 22.4 |
| D | 15 | 40 | 4079487 | 59981.65 | 168 | 159 | 68.0 |
| D | 15 | 184 | 3573861 | 52547.02 | 168 | 159 | 68.0 |
| D | 15 | 168 | 1807196 | 26570.32 | 168 | 159 | 68.0 |
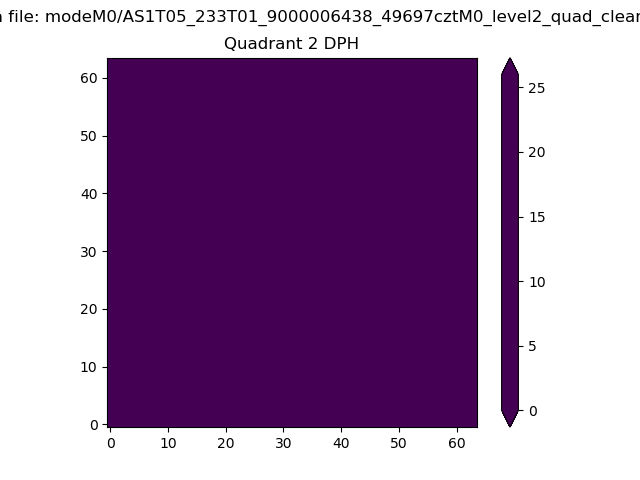
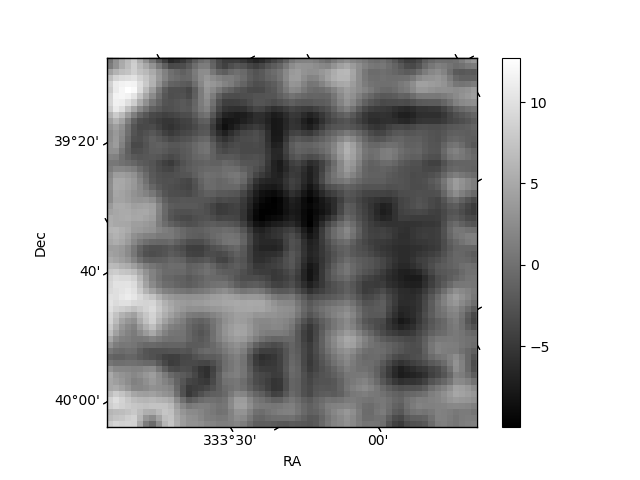
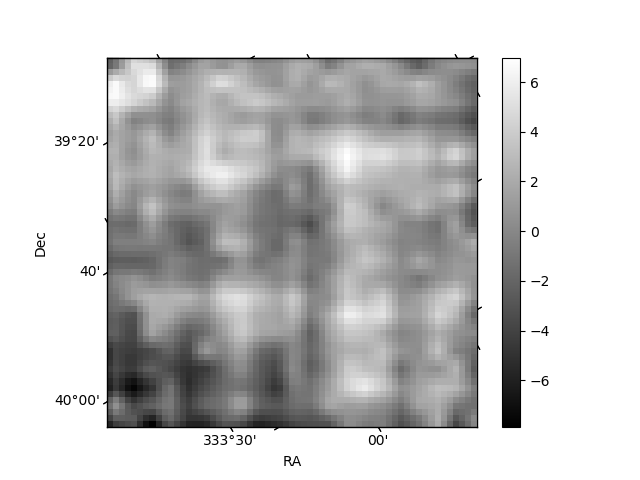
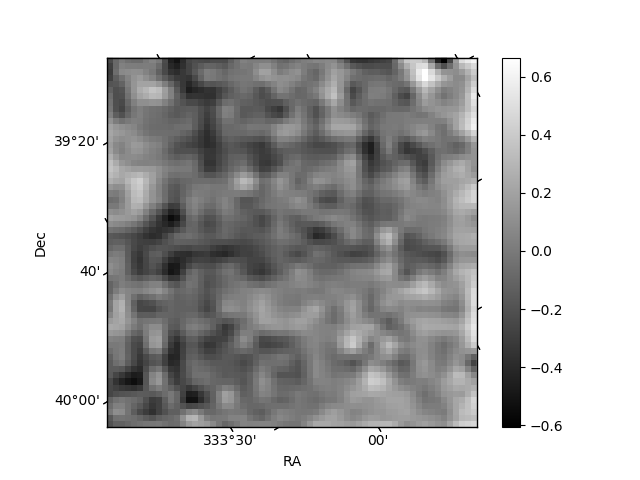
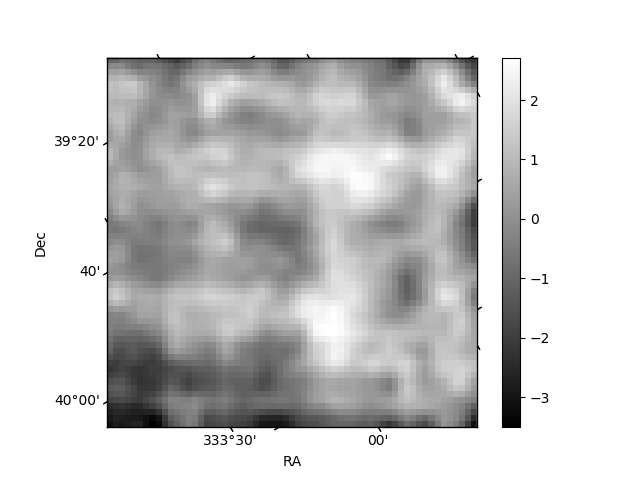
Histogram calculated using DETX and DETY for each event in the final _common_clean file
| Quadrant A | 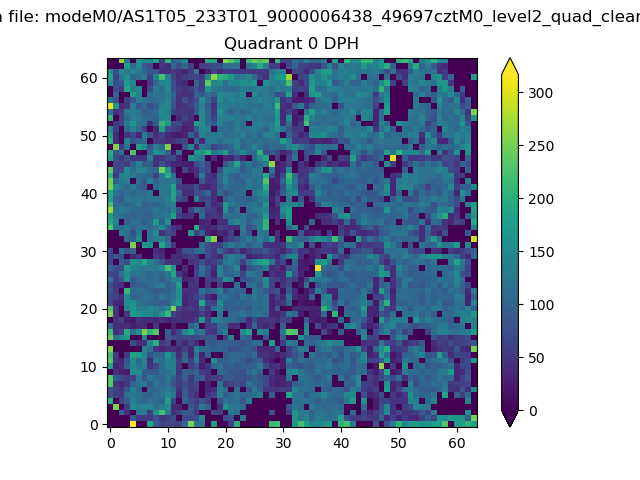 |
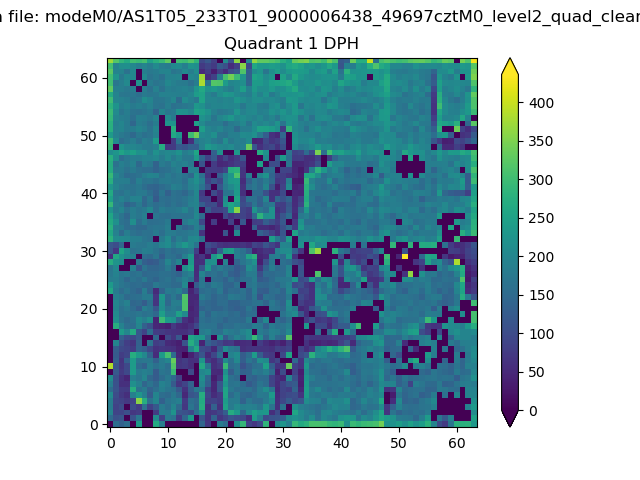 |
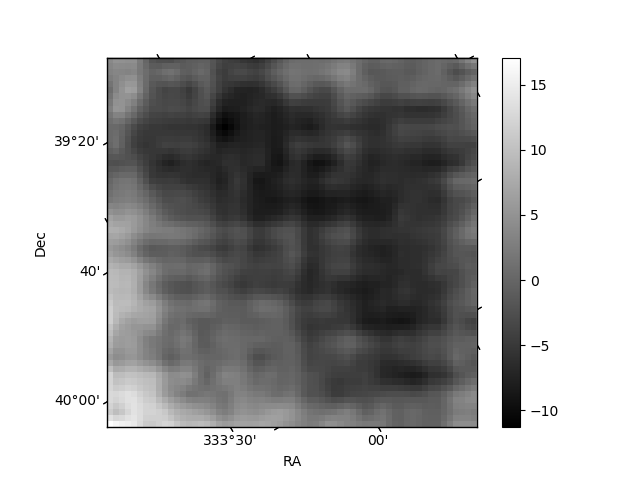
Quadrant B |
|---|---|---|---|
| Quadrant D | 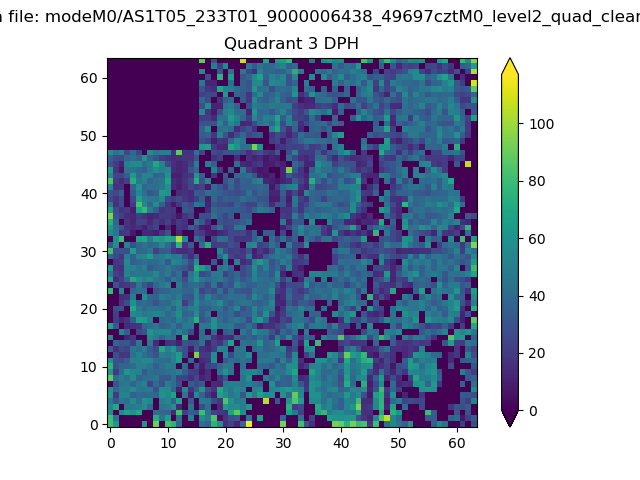 |
 |
Quadrant C |
| Plot type | Count rate plots | Images |
|---|---|---|
| Comparison with Poisson distribution Blue bars denote a histogram of data divided into 1 sec bins. Red curve is a Poisson curve with rate = median count rate of data. |
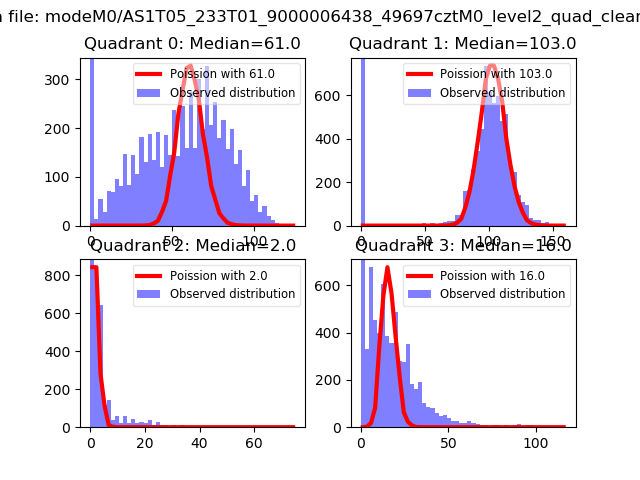 |
 |
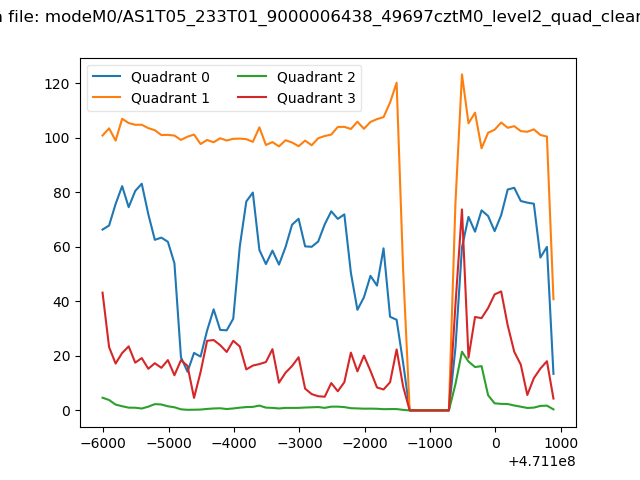
| Quadrant-wise count rates Data is divided into 100 sec bins |
 |
|
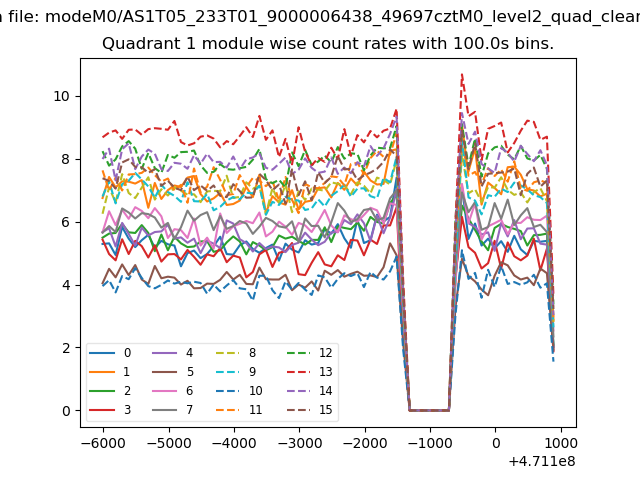
| Module-wise count rates for Quadrant A Data is divided into 100 sec bins |
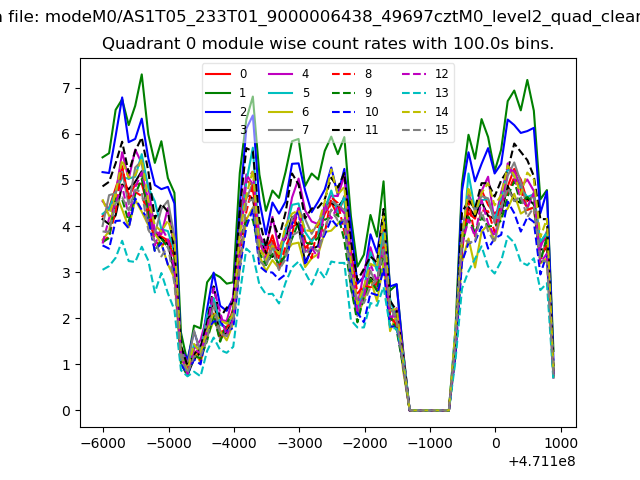 |
 |
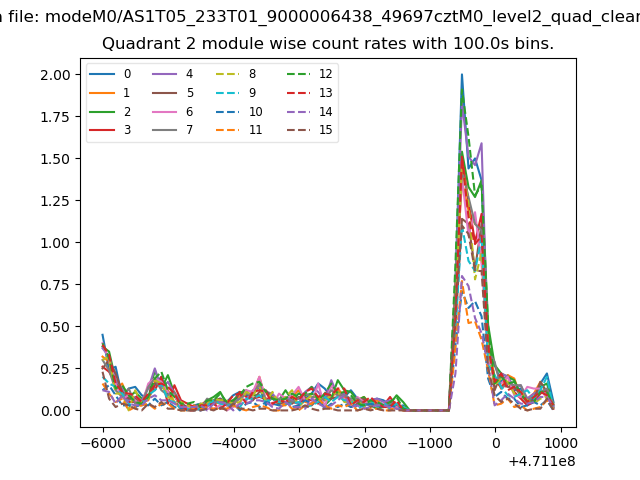
| Module-wise count rates for Quadrant B Data is divided into 100 sec bins |
 |
 |
| Module-wise count rates for Quadrant C Data is divided into 100 sec bins |
 |
 |
| Module-wise count rates for Quadrant D Data is divided into 100 sec bins |
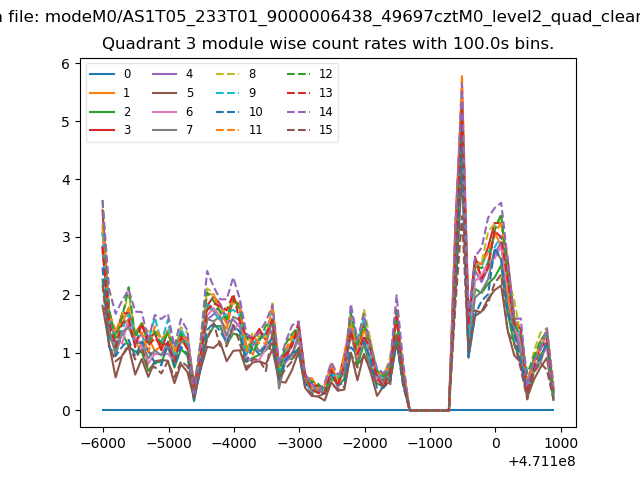 |
 |
| Parameter | Plot |
|---|---|
| CZT HV Monitor | 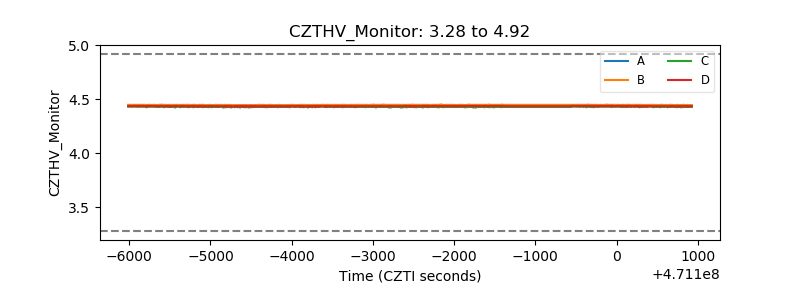 |
| D_VDD | 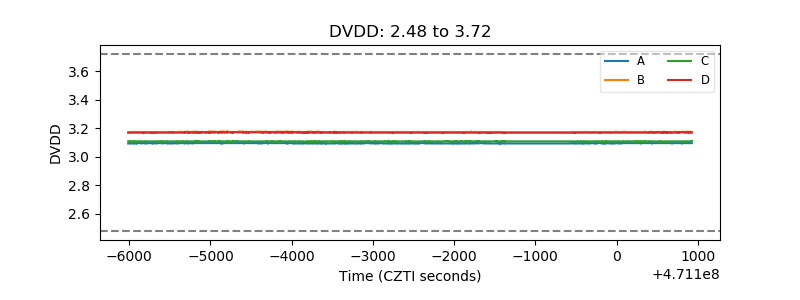 |
| Temperature 1 | 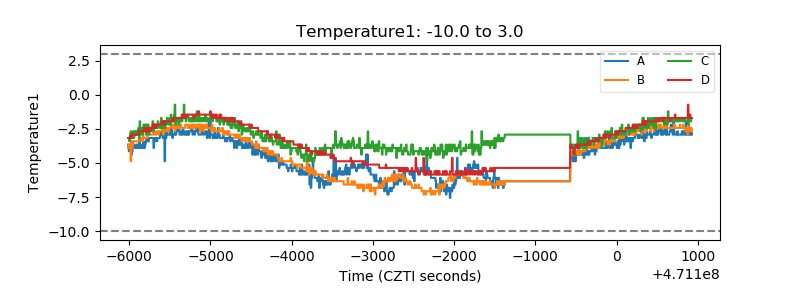 |
| Veto HV Monitor | 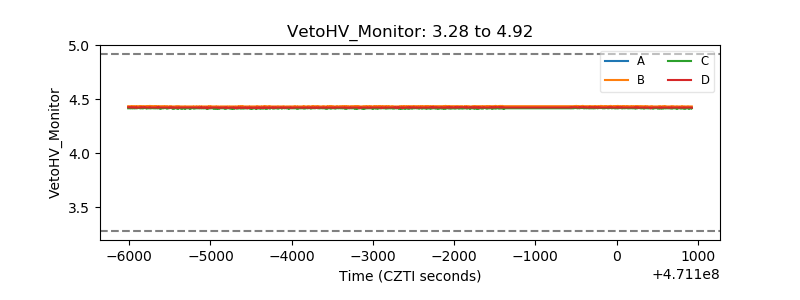 |
| Veto LLD | 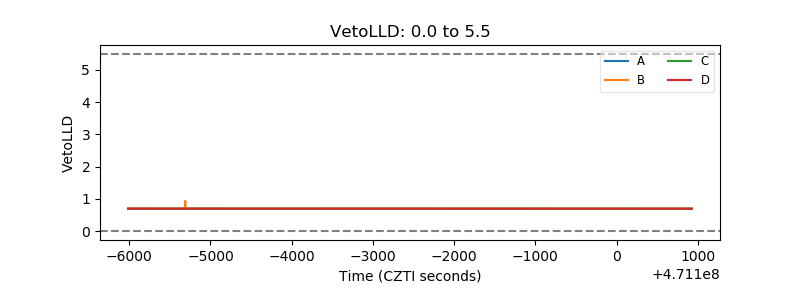 |
| Alpha Counter | 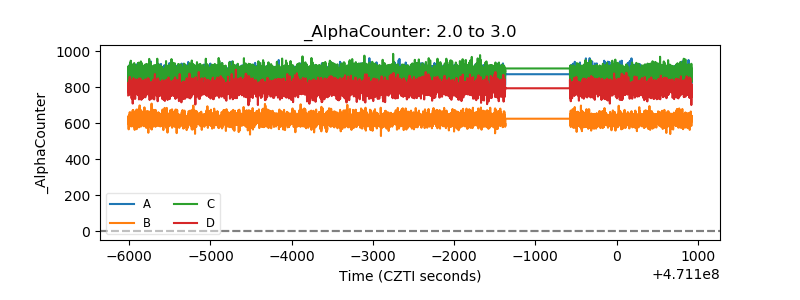 |
| _CPM_Rate | 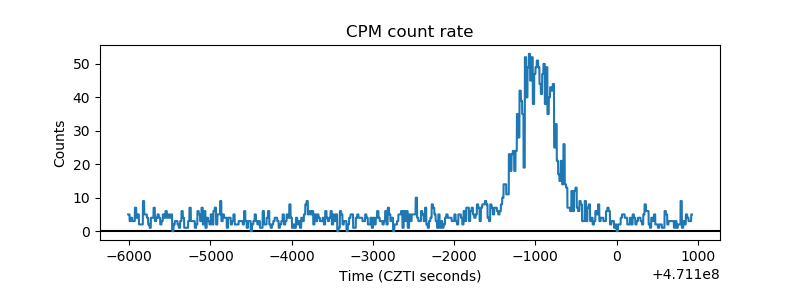 |
| CZT Counter | 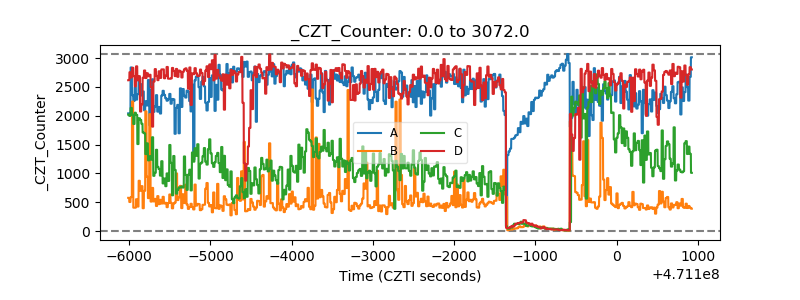 |
| +2.5 Volts monitor | 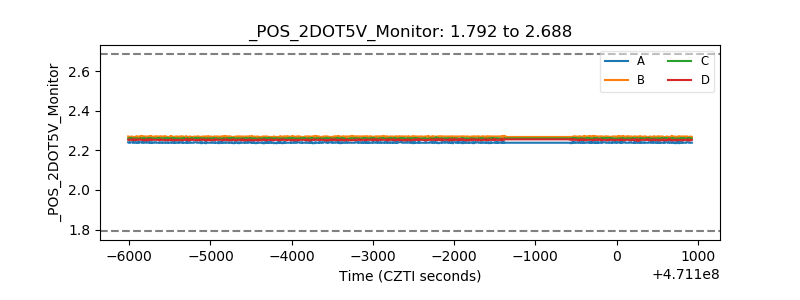 |
| +5 Volts monitor | 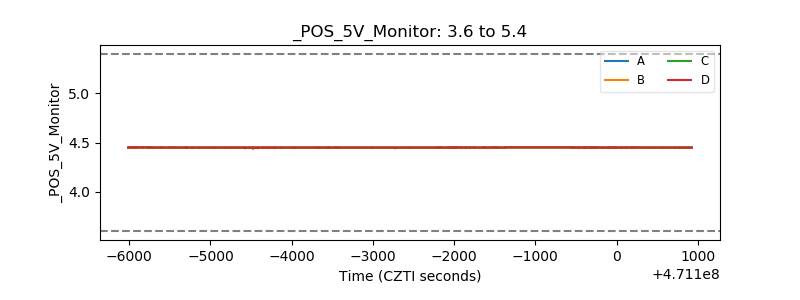 |
| _ROLL_ROT | 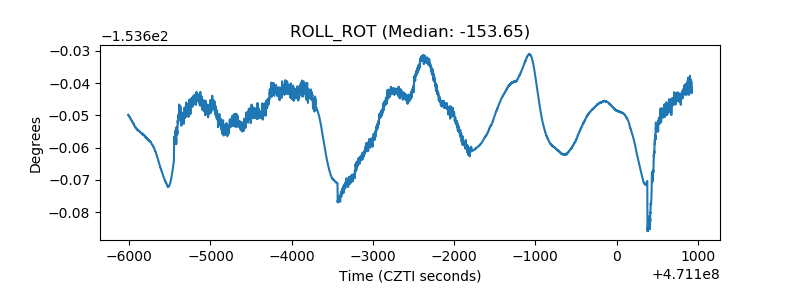 |
| _Roll_DEC | 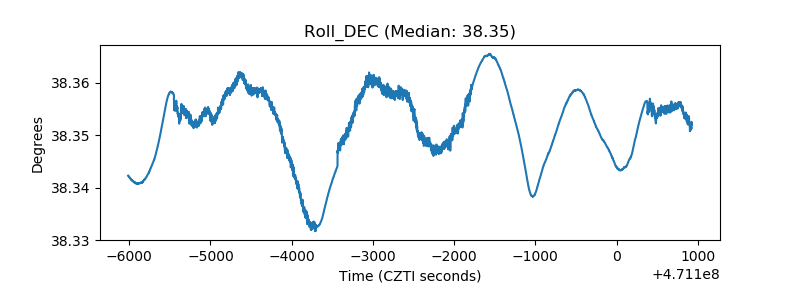 |
| _Roll_RA | 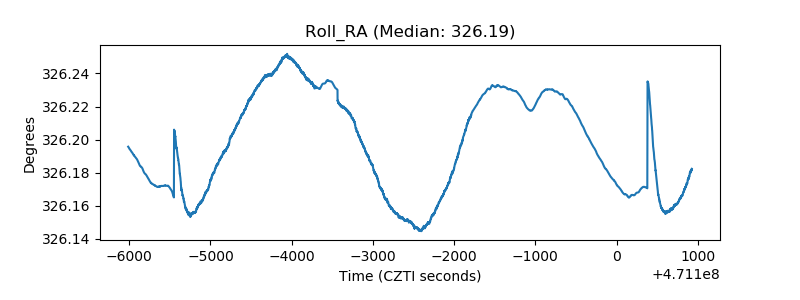 |
| Veto Counter | 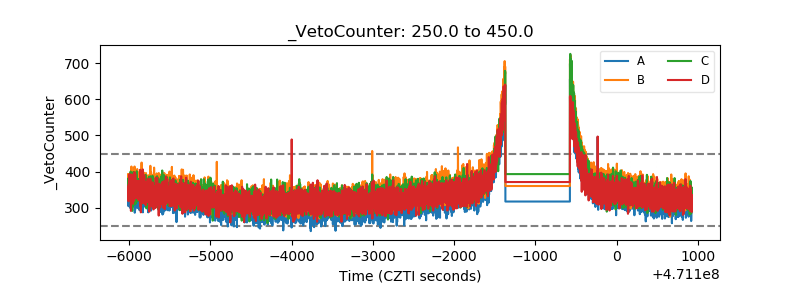 |