| Param | Original file | Final file |
|---|---|---|
| Filename | modeM0/AS1T05_233T01_9000006438_49699cztM0_level2.fits | modeM0/AS1T05_233T01_9000006438_49699cztM0_level2_quad_clean.evt |
| Size (bytes) | 1,348,951,680 | 49,743,360 |
| Size | 1.3 GB | 47.4 MB |
| Events in quadrant A | 18,323,476 | 251,722 |
| Events in quadrant B | 6,807,783 | 669,067 |
| Events in quadrant C | 6,394,638 | 3,556 |
| Events in quadrant D | 17,849,500 | 69,183 |
| Mode SS | |||
|---|---|---|---|
| Quadrant | BADHDUFLAG | Total packets | Discarded packets |
| A | 0 | 144 | 0 |
| B | 0 | 144 | 0 |
| C | 0 | 144 | 0 |
| D | 0 | 144 | 0 |
| Mode M0 | |||
|---|---|---|---|
| Quadrant | BADHDUFLAG | Total packets | Discarded packets |
| A | 0 | 59360 | 0 |
| B | 0 | 25080 | 0 |
| C | 0 | 24153 | 0 |
| D | 0 | 57956 | 0 |
| Quadrant | Total seconds | Saturated seconds | Saturation percentage |
|---|---|---|---|
| A | 7203 | 7177 | 99.639039% |
| B | 7204 | 1111 | 15.421988% |
| C | 7204 | 7204 | 100.000000% |
| D | 7204 | 7204 | 100.000000% |
Noise dominated data is calculated using 1-second bins in cleaned event files. If a bin has >2000 counts, and if more than 50% of those come from <1% of pixels, then it is considered to be noise-dominated and hence unusable.
| Quadrant | # 1 sec bins | Bins with >0 counts | Bins with >2000 counts | High rate bins dominated by noise | Noise dominated (total time) | Noise dominated (detector-on time) | Marked lightcurve |
|---|---|---|---|---|---|---|---|
| A | 7202 | 7202 | 7034 | 7034 | 97.67% | 97.67% | 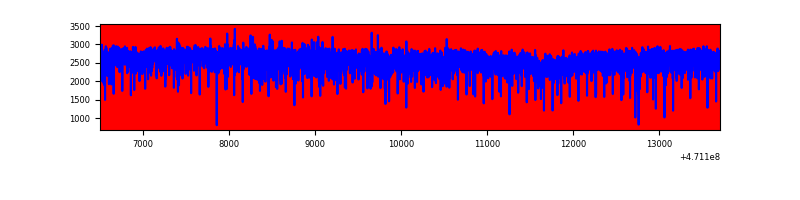 |
| B | 7204 | 7204 | 948 | 948 | 13.16% | 13.16% | 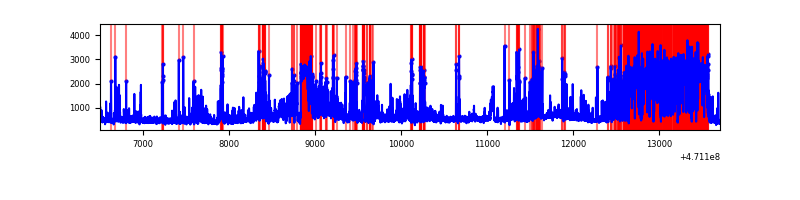 |
| C | 7203 | 7203 | 0 | 0 | 0.00% | 0.00% | 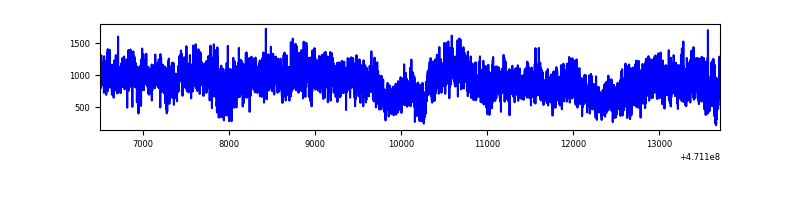 |
| D | 7203 | 7203 | 6642 | 6642 | 92.21% | 92.21% | 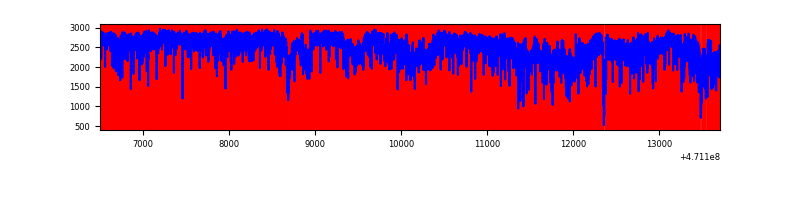 |
Top three noisy pixels from each quadrant. If the there are fewer than three noisy pixels in the level2.evt file, extra rows are filled as -1
| Pixel properties | Quadrant properties | ||||||
|---|---|---|---|---|---|---|---|
| Quadrant | DetID | PixID | Counts | Sigma | Mean | Median | Sigma |
| A | 10 | 83 | 5967608 | 61676.91 | 300 | 288 | 96.8 |
| A | 3 | 130 | 3157975 | 32637.16 | 300 | 288 | 96.8 |
| A | 0 | 98 | 2665486 | 27546.9 | 300 | 288 | 96.8 |
| B | 3 | 232 | 1731574 | 11399.82 | 702 | 681 | 151.8 |
| B | 4 | 206 | 583236 | 3836.76 | 702 | 681 | 151.8 |
| B | 10 | 44 | 387046 | 2544.64 | 702 | 681 | 151.8 |
| C | 15 | 180 | 1379852 | 160338.15 | 15 | 14 | 8.6 |
| C | 15 | 190 | 1139363 | 132393.16 | 15 | 14 | 8.6 |
| C | 15 | 181 | 775325 | 90091.69 | 15 | 14 | 8.6 |
| D | 15 | 122 | 6151104 | 91023.07 | 105 | 96 | 67.6 |
| D | 15 | 40 | 2618737 | 38750.84 | 105 | 96 | 67.6 |
| D | 15 | 168 | 2246648 | 33244.64 | 105 | 96 | 67.6 |
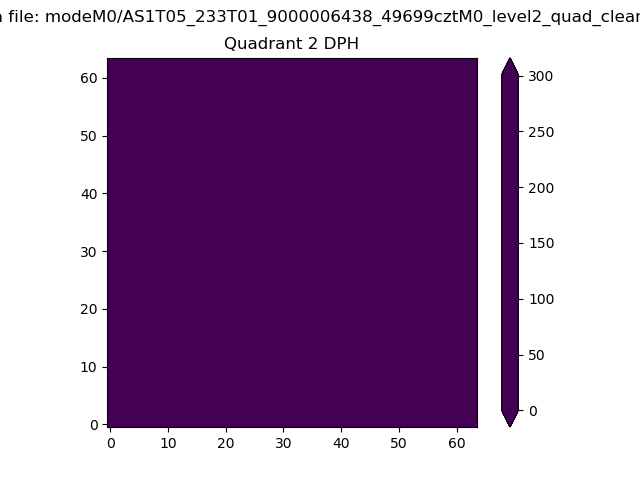
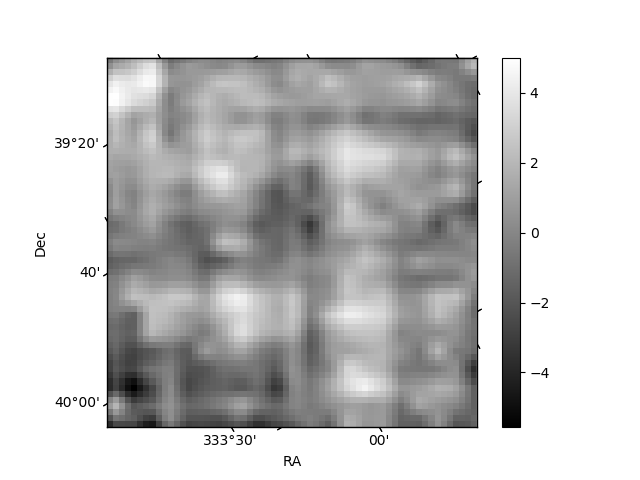
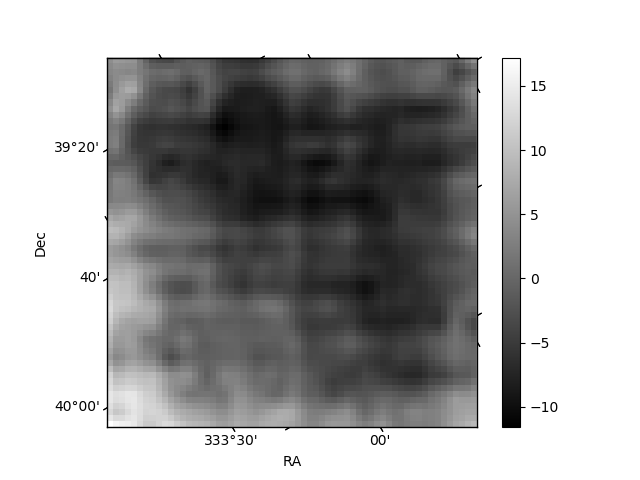
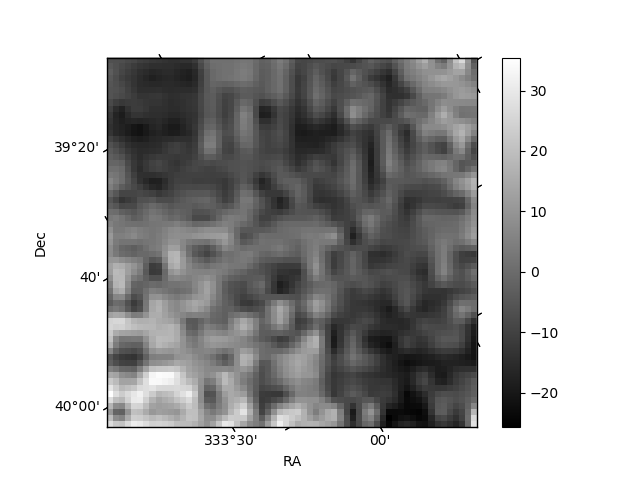
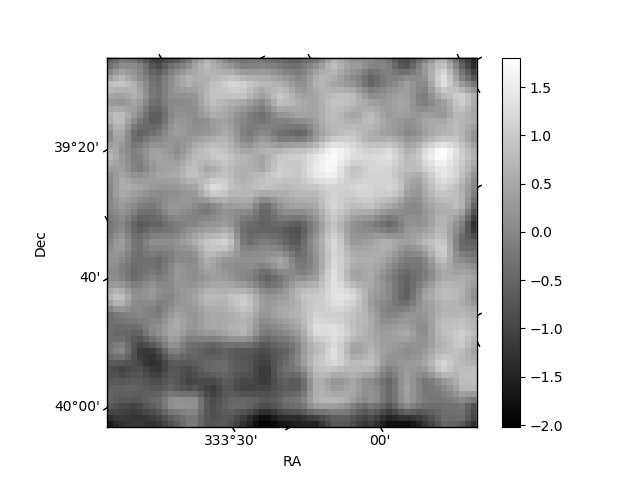
Histogram calculated using DETX and DETY for each event in the final _common_clean file
| Quadrant A | 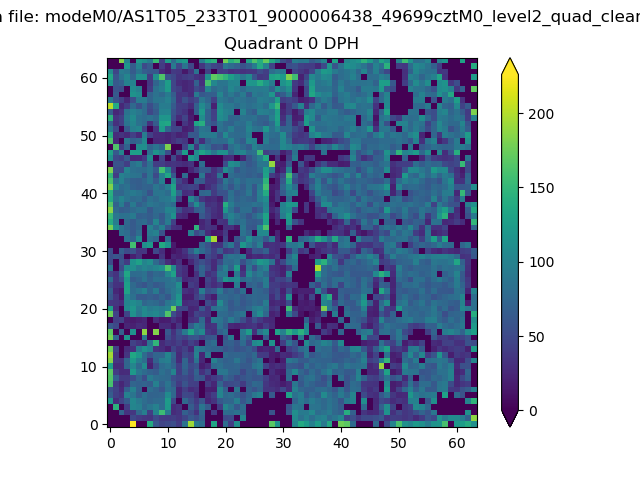 |
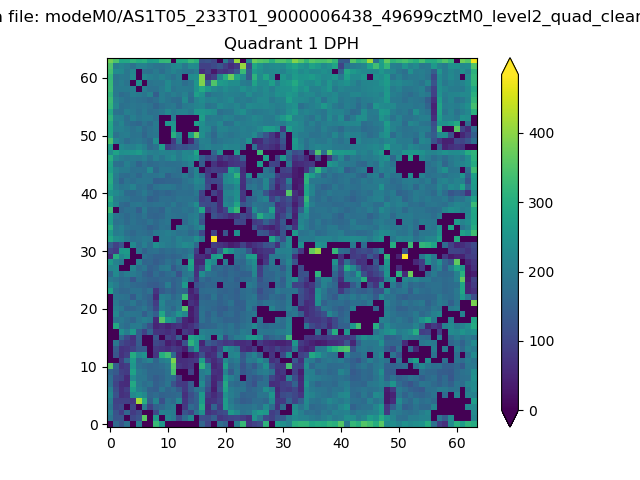 |
Quadrant B |
|---|---|---|---|
| Quadrant D | 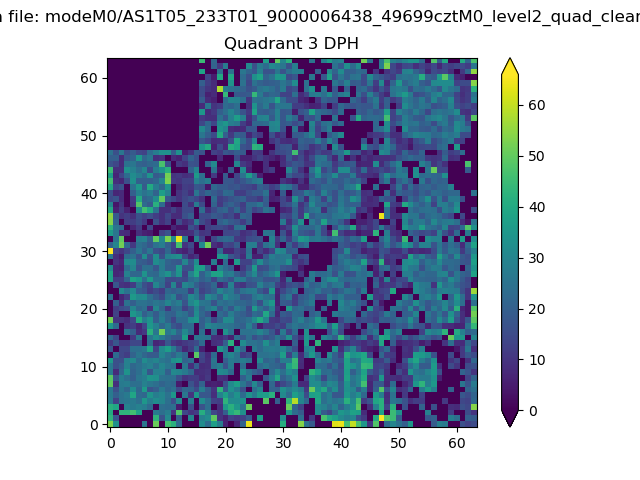 |
 |
Quadrant C |
| Plot type | Count rate plots | Images |
|---|---|---|
| Comparison with Poisson distribution Blue bars denote a histogram of data divided into 1 sec bins. Red curve is a Poisson curve with rate = median count rate of data. |
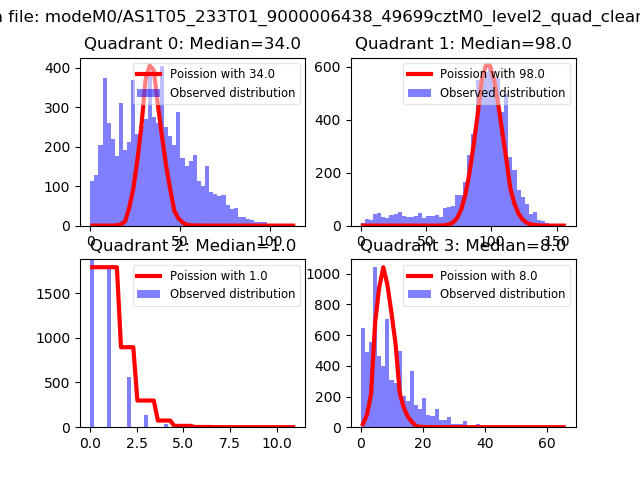 |
 |
| Quadrant-wise count rates Data is divided into 100 sec bins |
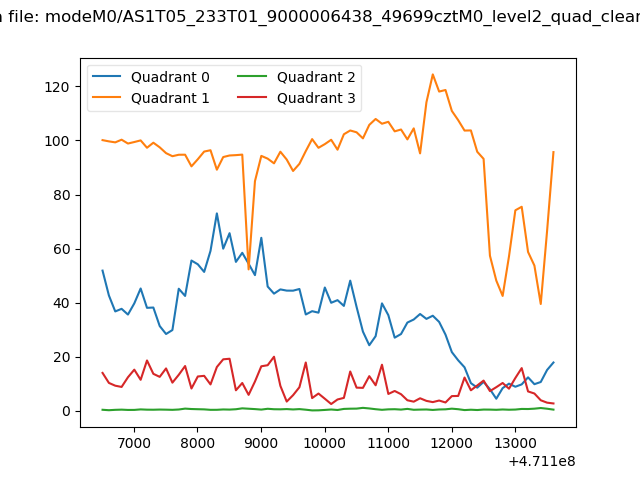 |
|
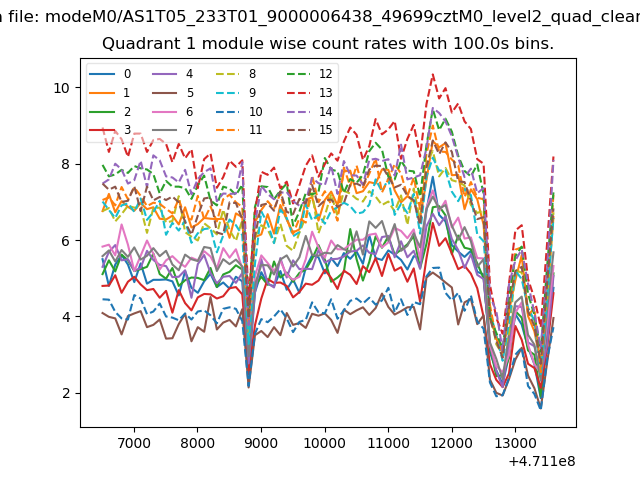
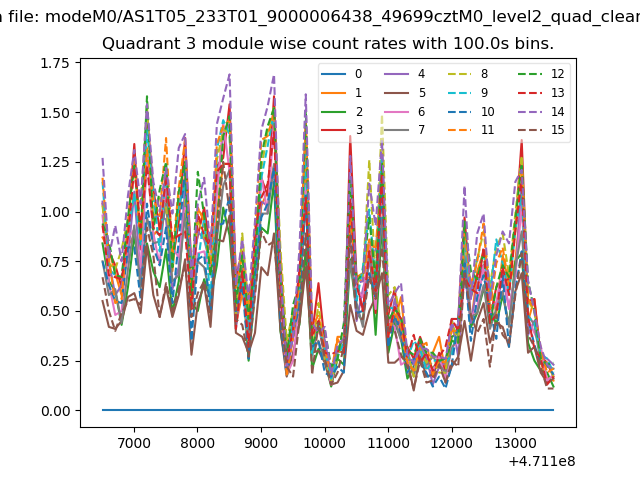
| Module-wise count rates for Quadrant A Data is divided into 100 sec bins |
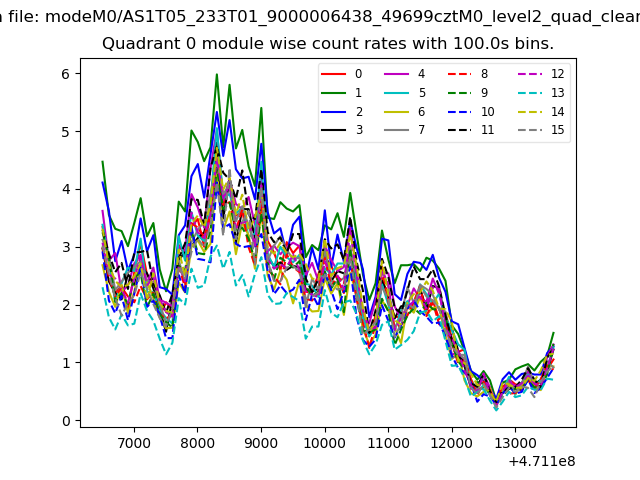 |
 |
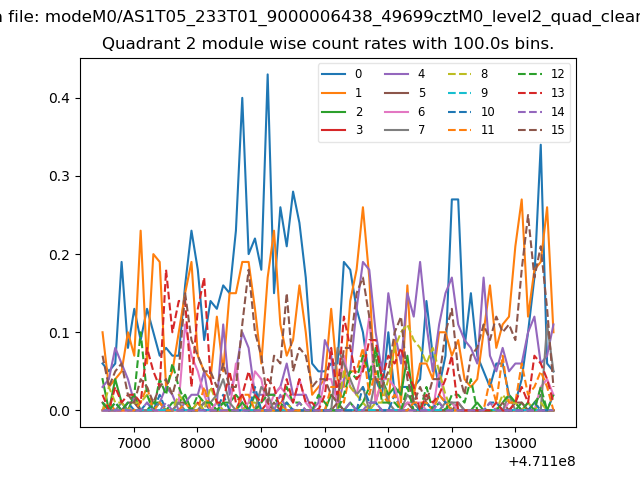
| Module-wise count rates for Quadrant B Data is divided into 100 sec bins |
 |
 |
| Module-wise count rates for Quadrant C Data is divided into 100 sec bins |
 |
 |
| Module-wise count rates for Quadrant D Data is divided into 100 sec bins |
 |
 |
| Parameter | Plot |
|---|---|
| CZT HV Monitor | 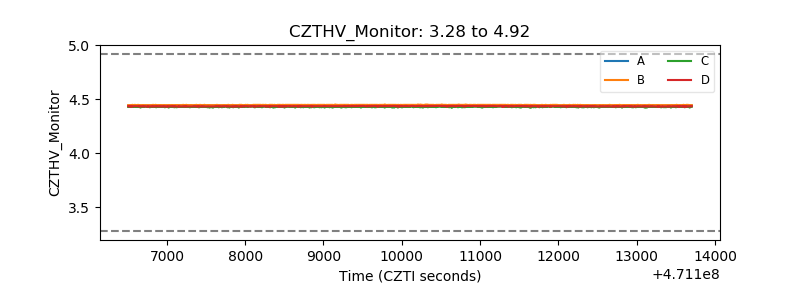 |
| D_VDD | 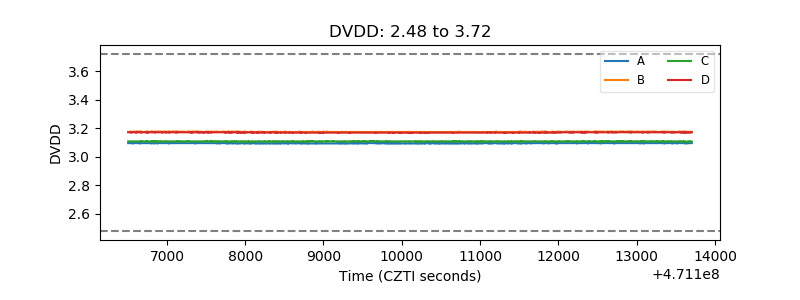 |
| Temperature 1 | 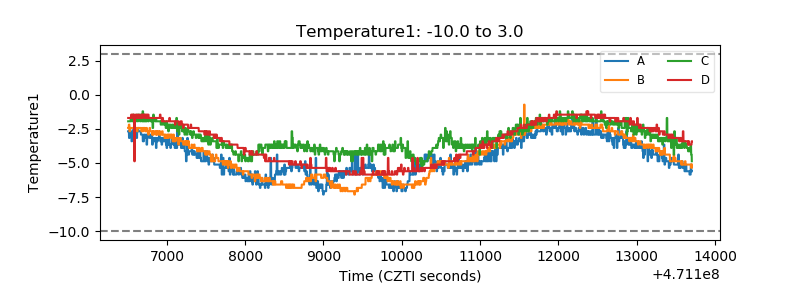 |
| Veto HV Monitor | 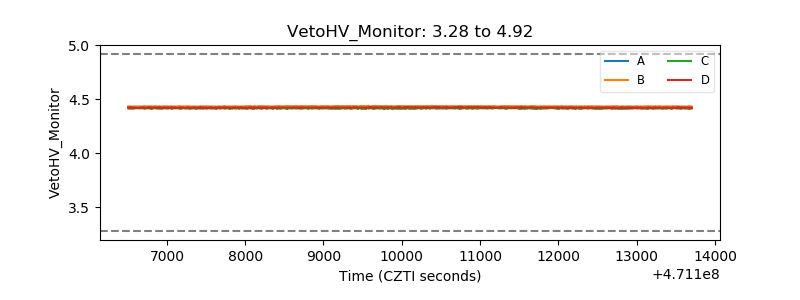 |
| Veto LLD | 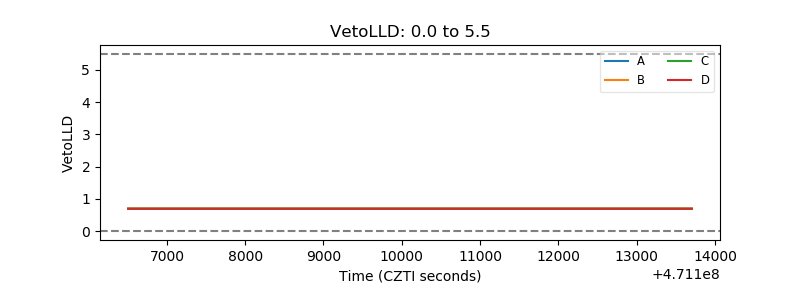 |
| Alpha Counter | 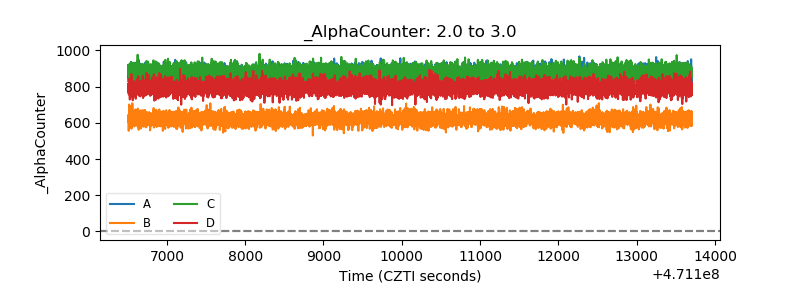 |
| _CPM_Rate | 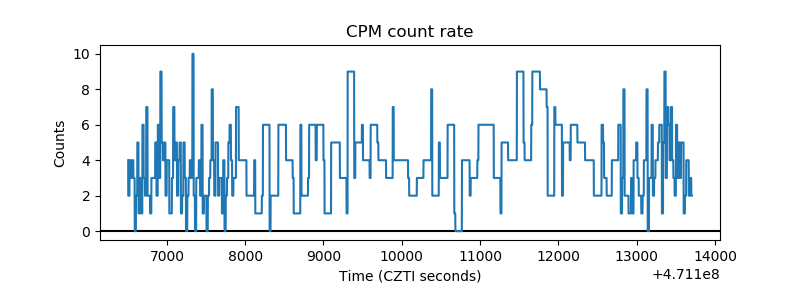 |
| CZT Counter | 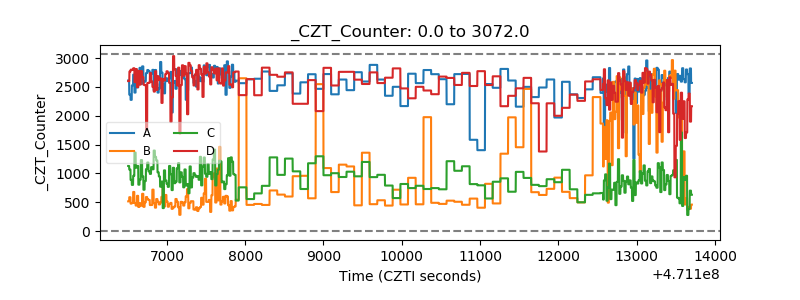 |
| +2.5 Volts monitor | 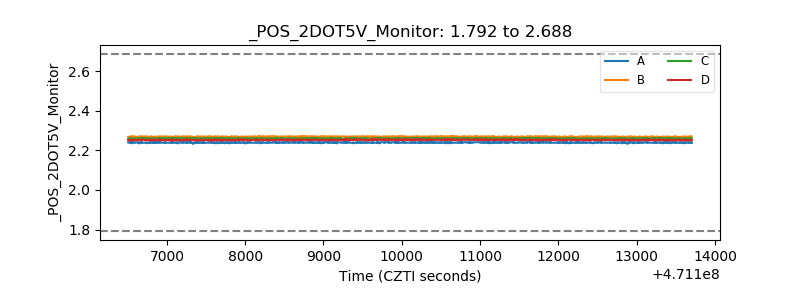 |
| +5 Volts monitor | 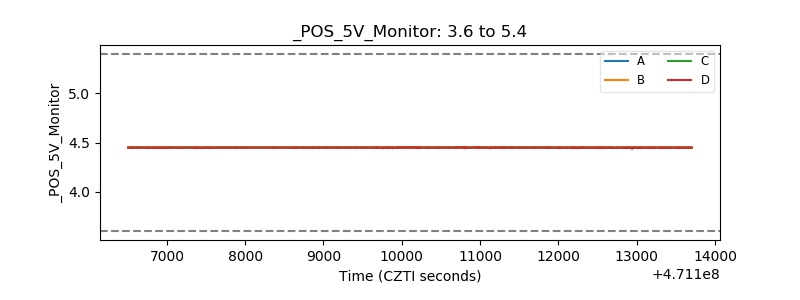 |
| _ROLL_ROT | 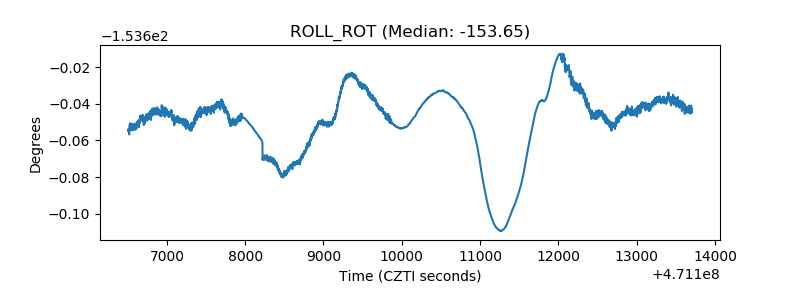 |
| _Roll_DEC | 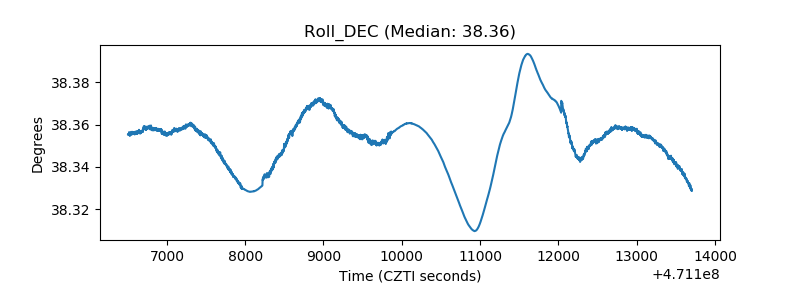 |
| _Roll_RA | 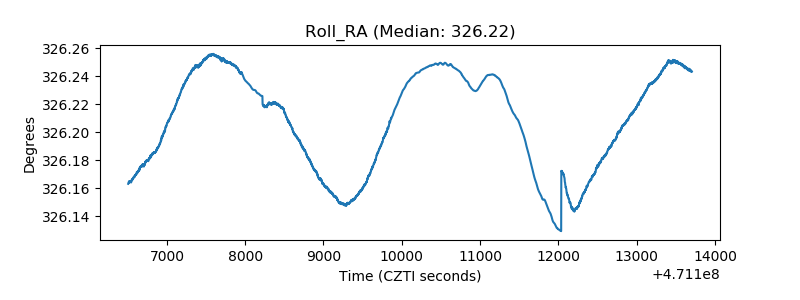 |
| Veto Counter | 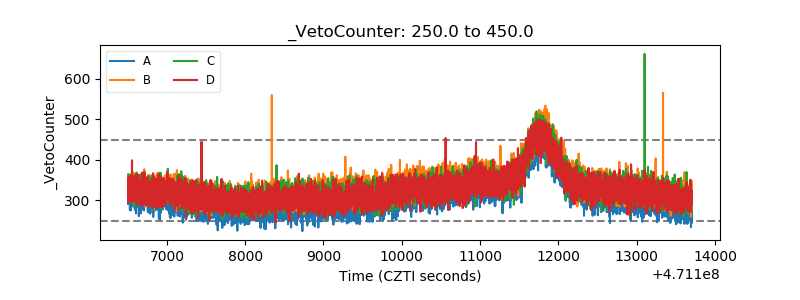 |