| Param | Original file | Final file |
|---|---|---|
| Filename | modeM0/AS1T05_233T01_9000006438_49705cztM0_level2.fits | modeM0/AS1T05_233T01_9000006438_49705cztM0_level2_quad_clean.evt |
| Size (bytes) | 1,222,125,120 | 55,869,120 |
| Size | 1.1 GB | 53.3 MB |
| Events in quadrant A | 15,200,129 | 351,220 |
| Events in quadrant B | 4,497,201 | 626,219 |
| Events in quadrant C | 9,348,532 | 30,443 |
| Events in quadrant D | 15,708,352 | 237,368 |
| Mode M9 | |||
|---|---|---|---|
| Quadrant | BADHDUFLAG | Total packets | Discarded packets |
| A | 0 | 9 | 0 |
| B | 0 | 9 | 0 |
| C | 0 | 9 | 0 |
| D | 0 | 9 | 0 |
| Mode SS | |||
|---|---|---|---|
| Quadrant | BADHDUFLAG | Total packets | Discarded packets |
| A | 0 | 128 | 0 |
| B | 0 | 128 | 0 |
| C | 0 | 128 | 0 |
| D | 0 | 128 | 0 |
| Mode M0 | |||
|---|---|---|---|
| Quadrant | BADHDUFLAG | Total packets | Discarded packets |
| A | 0 | 49473 | 0 |
| B | 0 | 17751 | 0 |
| C | 0 | 32103 | 0 |
| D | 0 | 51016 | 0 |
| Quadrant | Total seconds | Saturated seconds | Saturation percentage |
|---|---|---|---|
| A | 6270 | 5640 | 89.952153% |
| B | 6269 | 397 | 6.332748% |
| C | 6270 | 6270 | 100.000000% |
| D | 6270 | 5945 | 94.816587% |
Noise dominated data is calculated using 1-second bins in cleaned event files. If a bin has >2000 counts, and if more than 50% of those come from <1% of pixels, then it is considered to be noise-dominated and hence unusable.
| Quadrant | # 1 sec bins | Bins with >0 counts | Bins with >2000 counts | High rate bins dominated by noise | Noise dominated (total time) | Noise dominated (detector-on time) | Marked lightcurve |
|---|---|---|---|---|---|---|---|
| A | 7214 | 6269 | 5789 | 5789 | 80.25% | 92.34% | 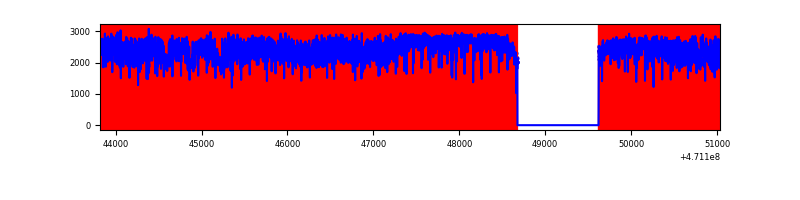 |
| B | 7214 | 6269 | 241 | 241 | 3.34% | 3.84% | 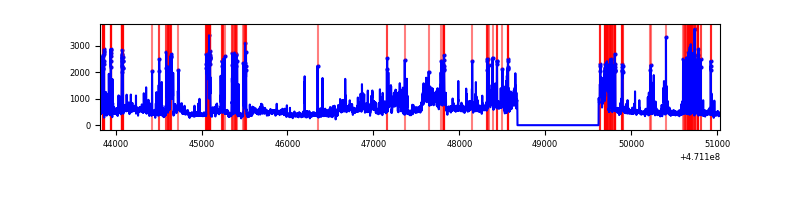 |
| C | 7214 | 6269 | 1179 | 1179 | 16.34% | 18.81% | 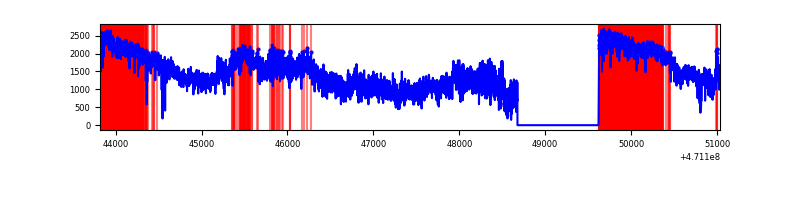 |
| D | 7214 | 6269 | 5851 | 5851 | 81.11% | 93.33% | 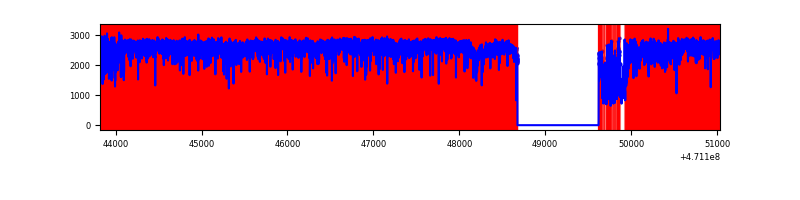 |
Top three noisy pixels from each quadrant. If the there are fewer than three noisy pixels in the level2.evt file, extra rows are filled as -1
| Pixel properties | Quadrant properties | ||||||
|---|---|---|---|---|---|---|---|
| Quadrant | DetID | PixID | Counts | Sigma | Mean | Median | Sigma |
| A | 10 | 83 | 6481710 | 56071.09 | 414 | 400 | 115.6 |
| A | 12 | 50 | 1493986 | 12921.31 | 414 | 400 | 115.6 |
| A | 3 | 130 | 1009859 | 8733.03 | 414 | 400 | 115.6 |
| B | 4 | 249 | 491917 | 3513.79 | 655 | 632 | 139.8 |
| B | 1 | 255 | 424115 | 3028.85 | 655 | 632 | 139.8 |
| B | 4 | 169 | 375233 | 2679.24 | 655 | 632 | 139.8 |
| C | 15 | 180 | 2746315 | 101834.3 | 51 | 48 | 27.0 |
| C | 15 | 190 | 2448806 | 90802.37 | 51 | 48 | 27.0 |
| C | 15 | 181 | 968559 | 35913.35 | 51 | 48 | 27.0 |
| D | 15 | 40 | 4903284 | 49719.69 | 303 | 291 | 98.6 |
| D | 15 | 168 | 1757524 | 17819.54 | 303 | 291 | 98.6 |
| D | 2 | 165 | 1165162 | 11812.58 | 303 | 291 | 98.6 |
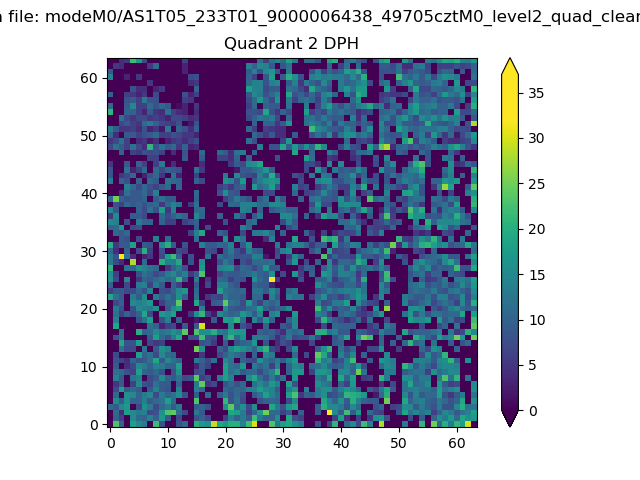
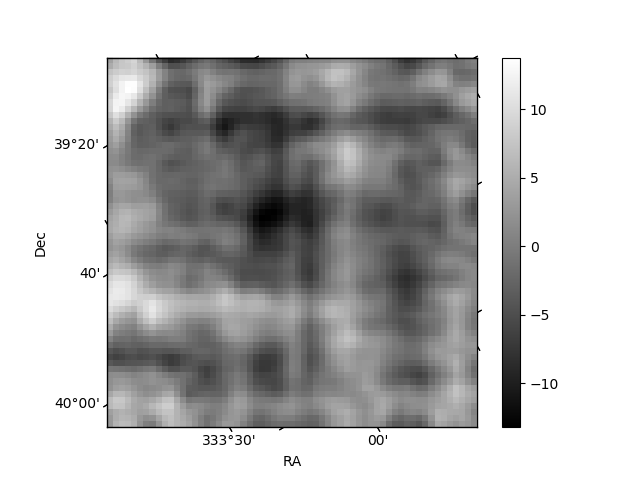
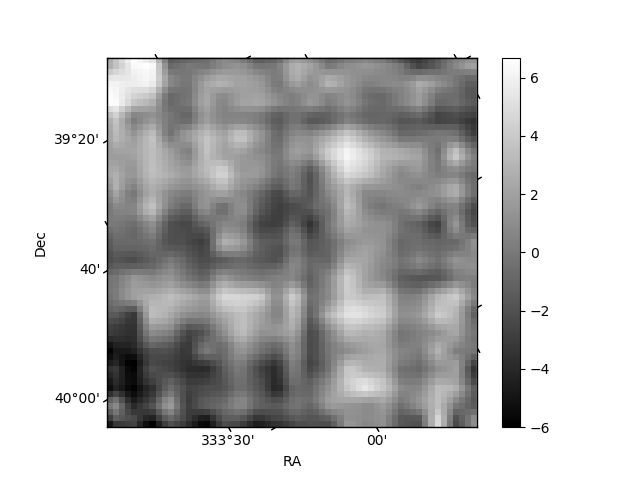
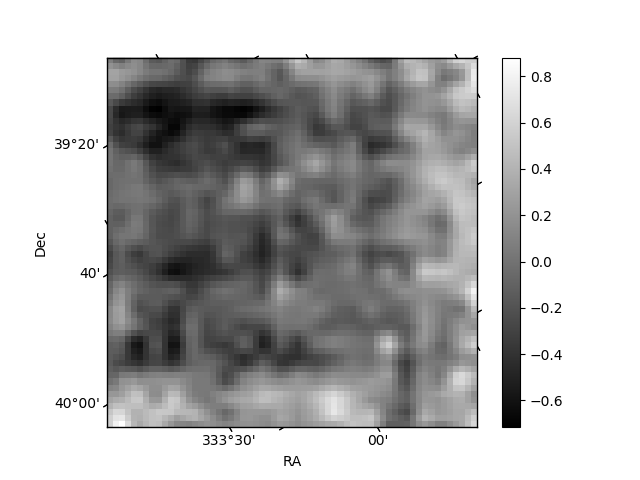
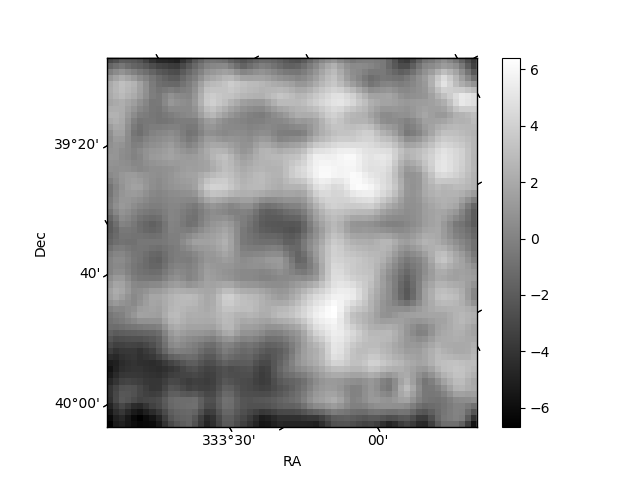
Histogram calculated using DETX and DETY for each event in the final _common_clean file
| Quadrant A | 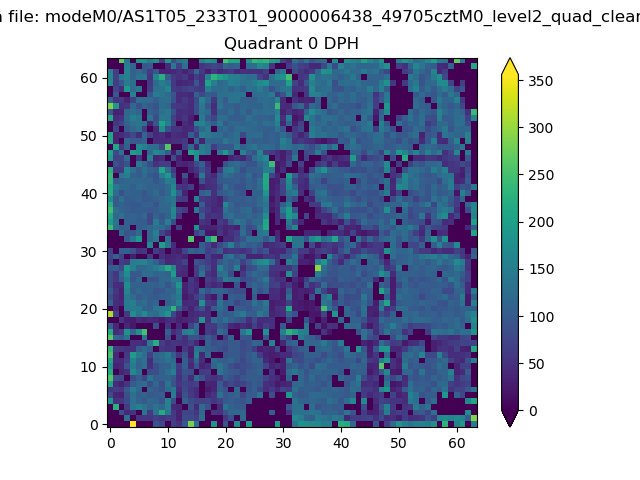 |
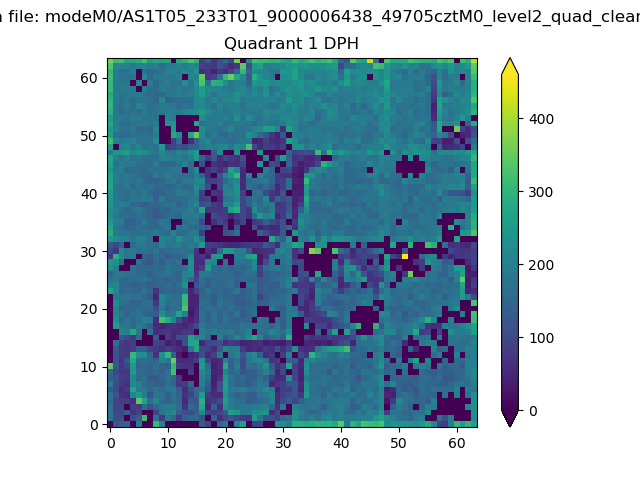 |
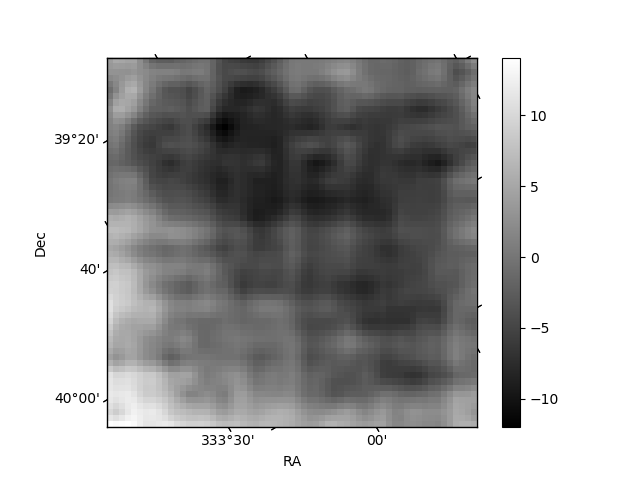
Quadrant B |
|---|---|---|---|
| Quadrant D | 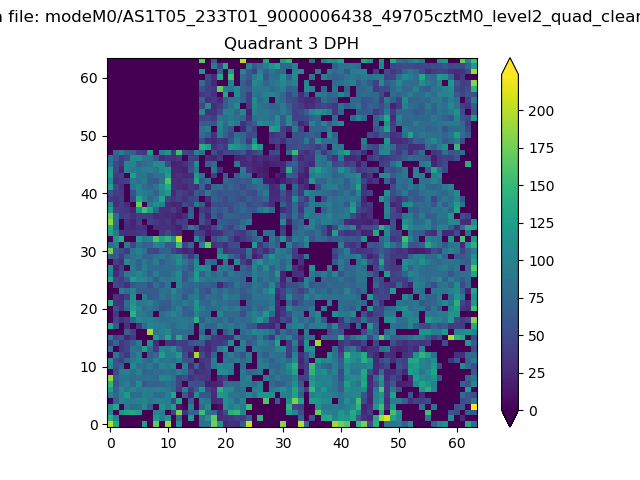 |
 |
Quadrant C |
| Plot type | Count rate plots | Images |
|---|---|---|
| Comparison with Poisson distribution Blue bars denote a histogram of data divided into 1 sec bins. Red curve is a Poisson curve with rate = median count rate of data. |
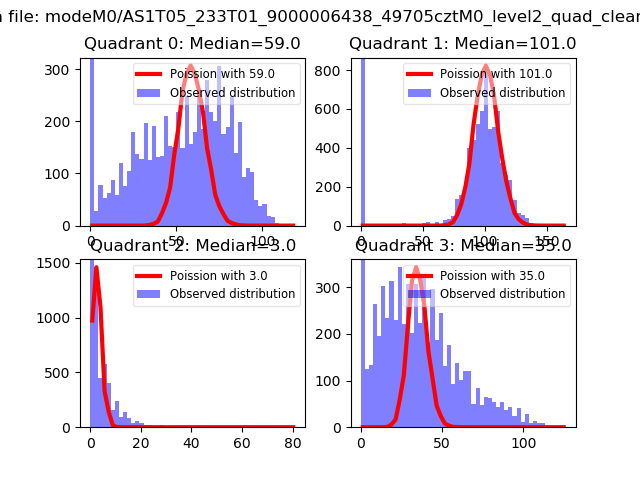 |
 |
| Quadrant-wise count rates Data is divided into 100 sec bins |
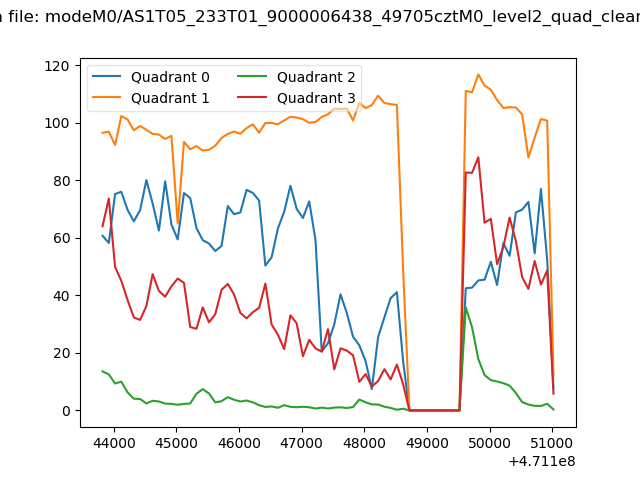 |
|
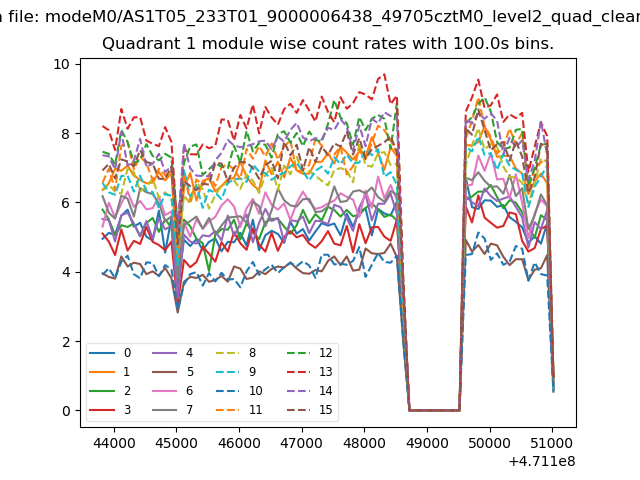
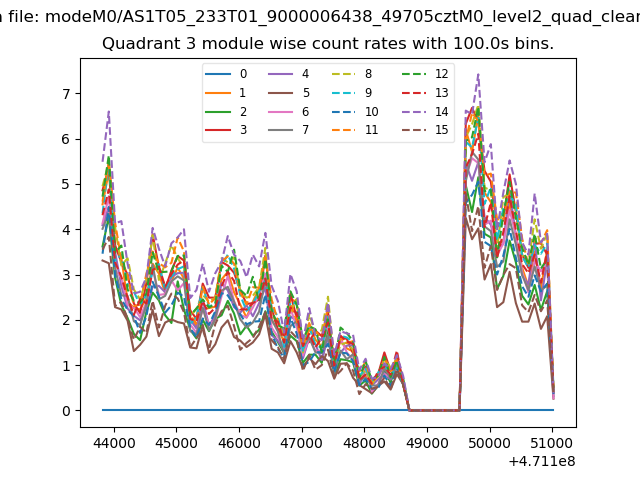
| Module-wise count rates for Quadrant A Data is divided into 100 sec bins |
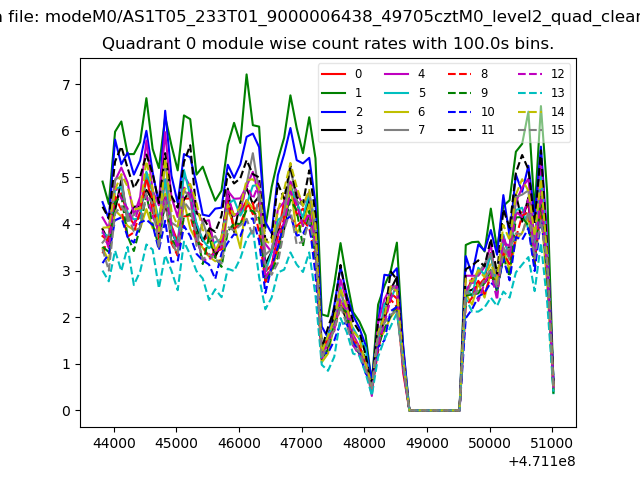 |
 |
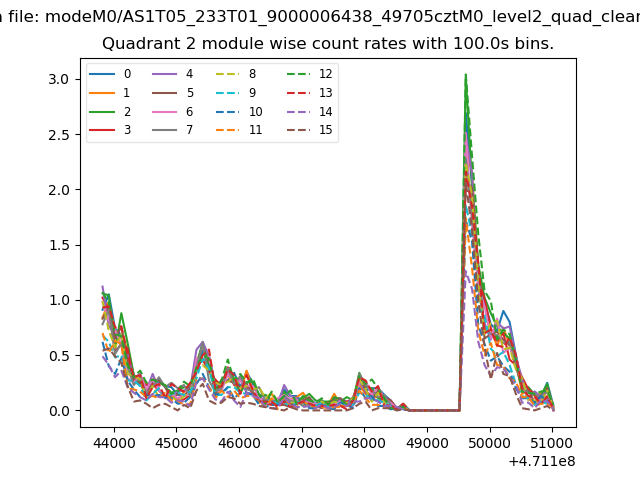
| Module-wise count rates for Quadrant B Data is divided into 100 sec bins |
 |
 |
| Module-wise count rates for Quadrant C Data is divided into 100 sec bins |
 |
 |
| Module-wise count rates for Quadrant D Data is divided into 100 sec bins |
 |
 |
| Parameter | Plot |
|---|---|
| CZT HV Monitor | 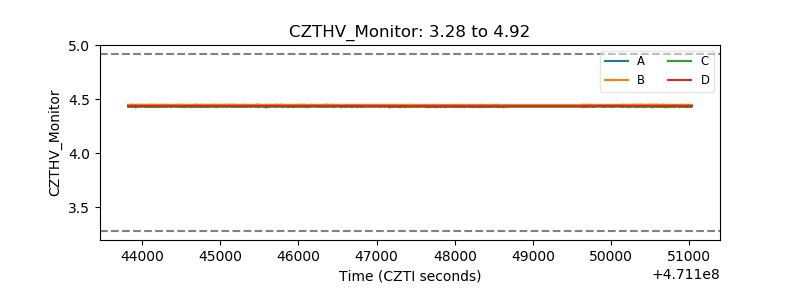 |
| D_VDD | 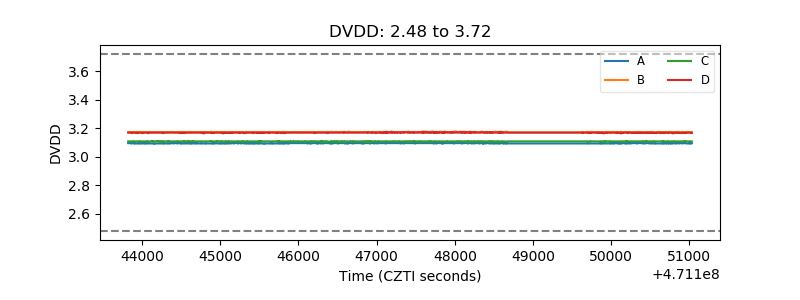 |
| Temperature 1 | 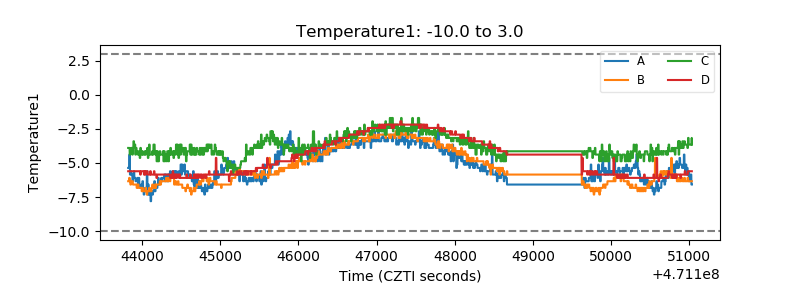 |
| Veto HV Monitor | 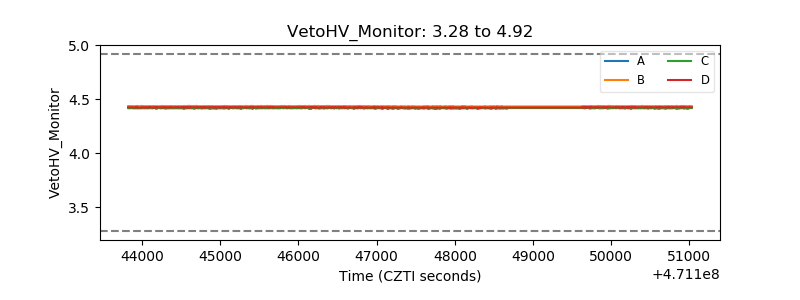 |
| Veto LLD | 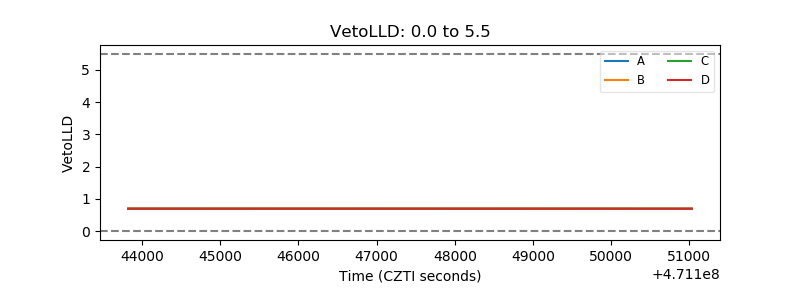 |
| Alpha Counter | 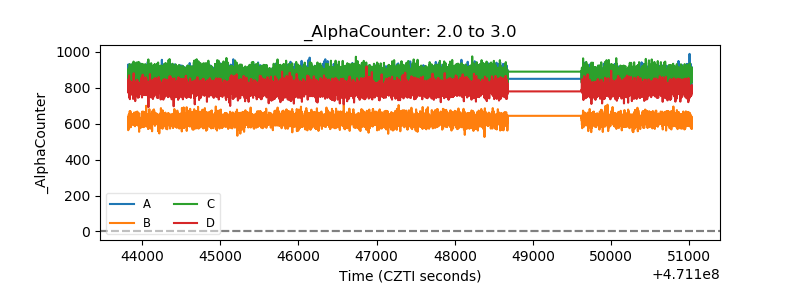 |
| _CPM_Rate | 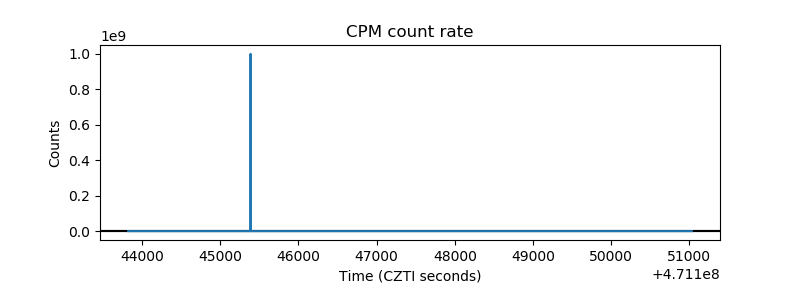 |
| CZT Counter | 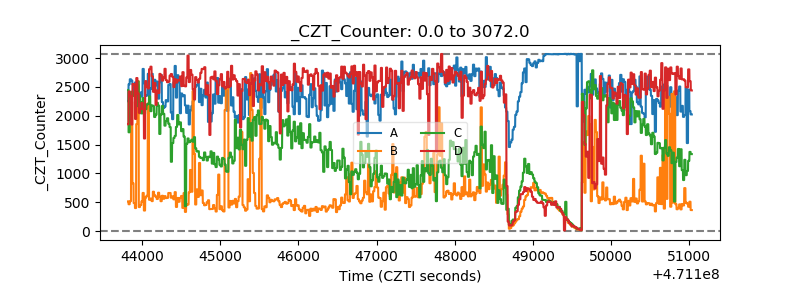 |
| +2.5 Volts monitor | 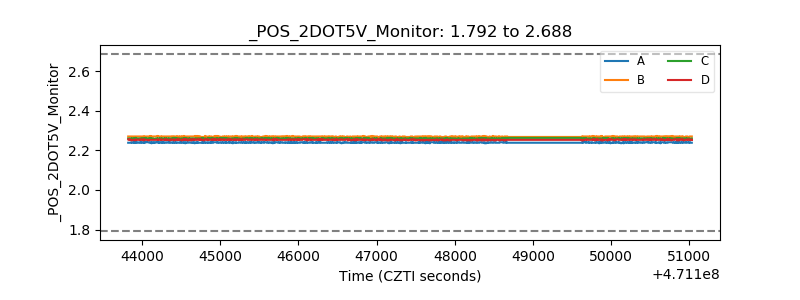 |
| +5 Volts monitor | 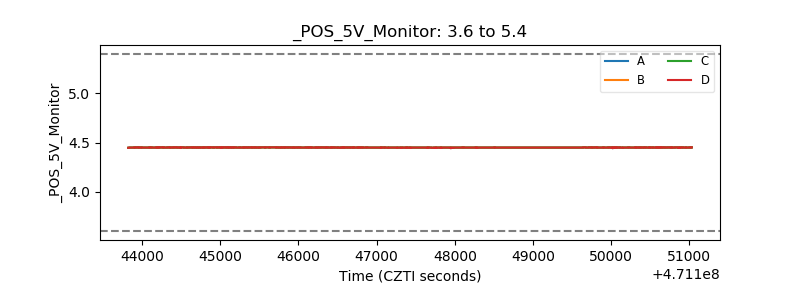 |
| _ROLL_ROT | 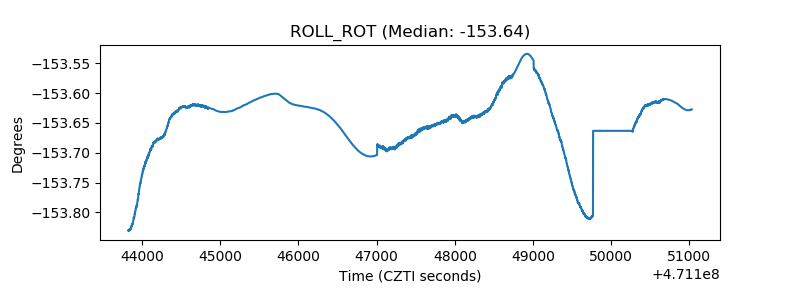 |
| _Roll_DEC | 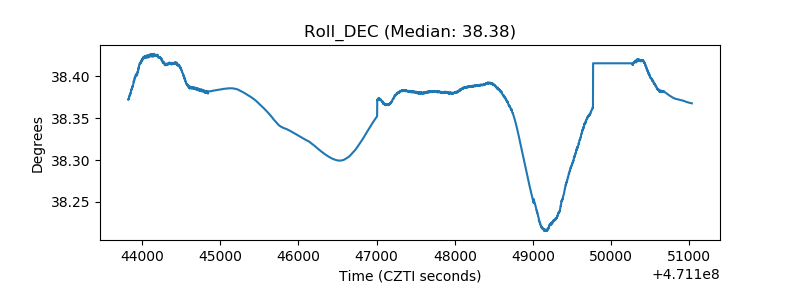 |
| _Roll_RA | 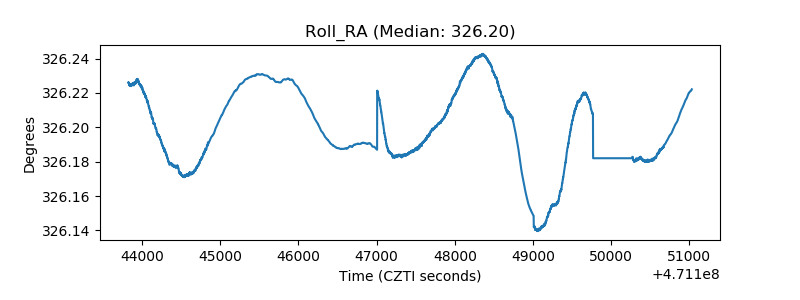 |
| Veto Counter | 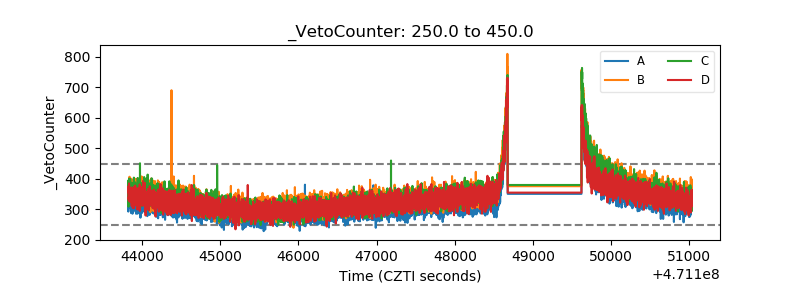 |