| Param | Original file | Final file |
|---|---|---|
| Filename | modeM0/AS1T05_233T01_9000006438_49707cztM0_level2.fits | modeM0/AS1T05_233T01_9000006438_49707cztM0_level2_quad_clean.evt |
| Size (bytes) | 1,123,666,560 | 55,313,280 |
| Size | 1.0 GB | 52.8 MB |
| Events in quadrant A | 13,967,936 | 404,394 |
| Events in quadrant B | 4,212,910 | 612,736 |
| Events in quadrant C | 7,957,280 | 24,028 |
| Events in quadrant D | 14,997,642 | 212,419 |
| Mode M9 | |||
|---|---|---|---|
| Quadrant | BADHDUFLAG | Total packets | Discarded packets |
| A | 0 | 11 | 0 |
| B | 0 | 11 | 0 |
| C | 0 | 11 | 0 |
| D | 0 | 11 | 0 |
| Mode SS | |||
|---|---|---|---|
| Quadrant | BADHDUFLAG | Total packets | Discarded packets |
| A | 0 | 120 | 0 |
| B | 0 | 120 | 0 |
| C | 0 | 120 | 0 |
| D | 0 | 120 | 0 |
| Mode M0 | |||
|---|---|---|---|
| Quadrant | BADHDUFLAG | Total packets | Discarded packets |
| A | 0 | 45534 | 0 |
| B | 0 | 16659 | 0 |
| C | 0 | 27788 | 0 |
| D | 0 | 48547 | 0 |
| Quadrant | Total seconds | Saturated seconds | Saturation percentage |
|---|---|---|---|
| A | 5921 | 5095 | 86.049654% |
| B | 5922 | 408 | 6.889564% |
| C | 5922 | 5922 | 100.000000% |
| D | 5921 | 5793 | 97.838203% |
Noise dominated data is calculated using 1-second bins in cleaned event files. If a bin has >2000 counts, and if more than 50% of those come from <1% of pixels, then it is considered to be noise-dominated and hence unusable.
| Quadrant | # 1 sec bins | Bins with >0 counts | Bins with >2000 counts | High rate bins dominated by noise | Noise dominated (total time) | Noise dominated (detector-on time) | Marked lightcurve |
|---|---|---|---|---|---|---|---|
| A | 6990 | 5920 | 5379 | 5379 | 76.95% | 90.86% | 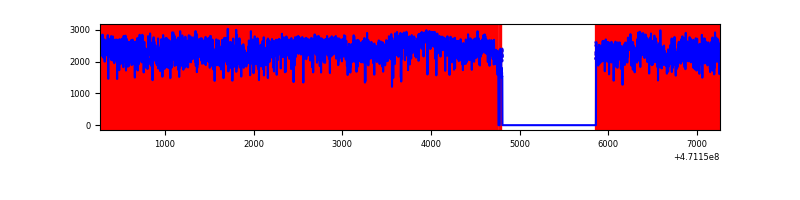 |
| B | 6992 | 5922 | 233 | 233 | 3.33% | 3.93% | 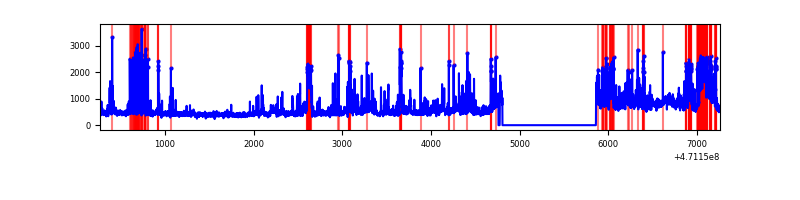 |
| C | 6991 | 5921 | 694 | 694 | 9.93% | 11.72% | 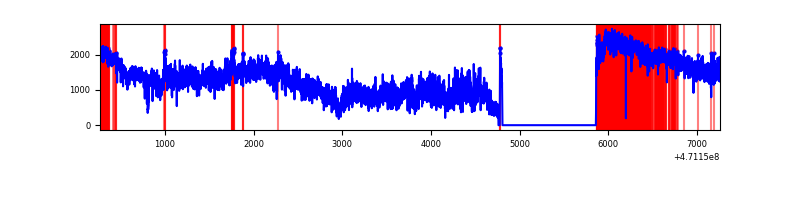 |
| D | 6990 | 5920 | 5585 | 5585 | 79.90% | 94.34% |  |
Top three noisy pixels from each quadrant. If the there are fewer than three noisy pixels in the level2.evt file, extra rows are filled as -1
| Pixel properties | Quadrant properties | ||||||
|---|---|---|---|---|---|---|---|
| Quadrant | DetID | PixID | Counts | Sigma | Mean | Median | Sigma |
| A | 10 | 83 | 6931439 | 53741.97 | 463 | 449 | 129.0 |
| A | 12 | 50 | 1469472 | 11390.61 | 463 | 449 | 129.0 |
| A | 3 | 130 | 631986 | 4896.85 | 463 | 449 | 129.0 |
| B | 5 | 172 | 474392 | 3502.75 | 630 | 612 | 135.3 |
| B | 1 | 255 | 370991 | 2738.28 | 630 | 612 | 135.3 |
| B | 5 | 185 | 179795 | 1324.73 | 630 | 612 | 135.3 |
| C | 15 | 180 | 2471748 | 103021.61 | 42 | 40 | 24.0 |
| C | 15 | 190 | 1881499 | 78419.83 | 42 | 40 | 24.0 |
| C | 15 | 181 | 953583 | 39743.99 | 42 | 40 | 24.0 |
| D | 15 | 40 | 3625145 | 39888.6 | 270 | 258 | 90.9 |
| D | 7 | 61 | 1252085 | 13775.22 | 270 | 258 | 90.9 |
| D | 4 | 99 | 1092245 | 12016.33 | 270 | 258 | 90.9 |
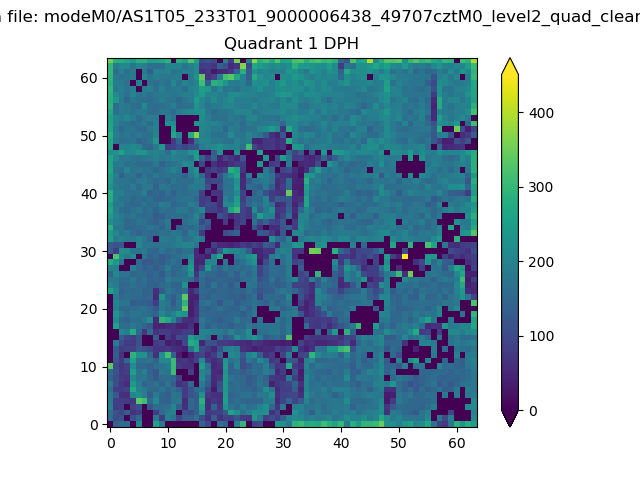
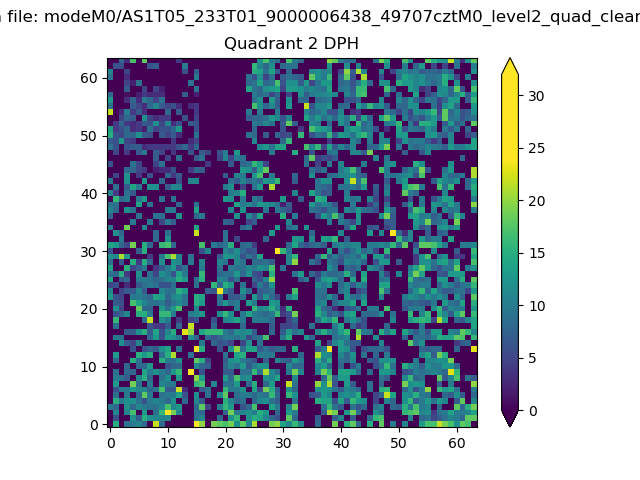
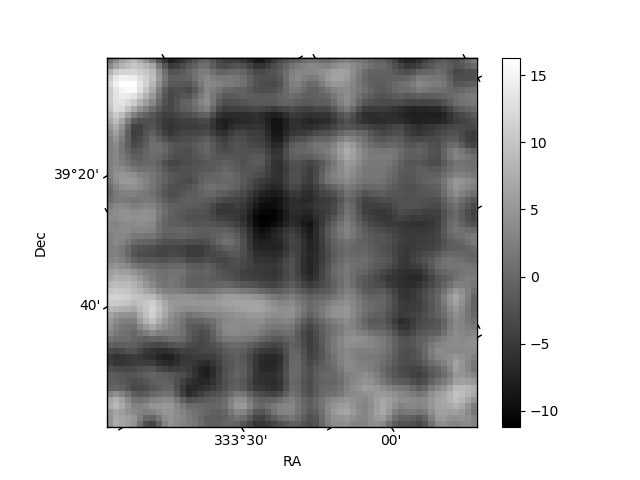
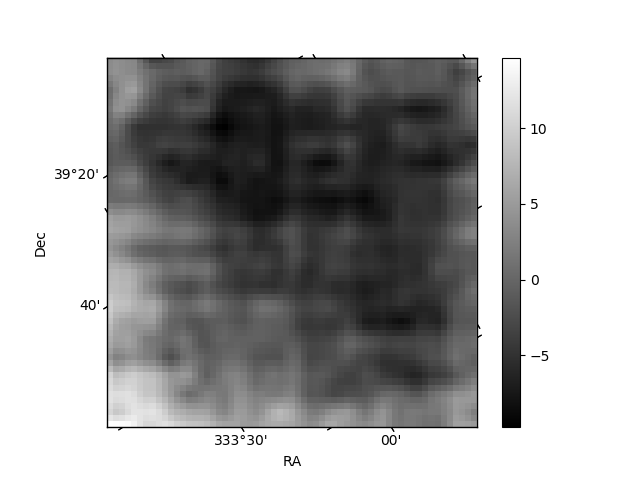
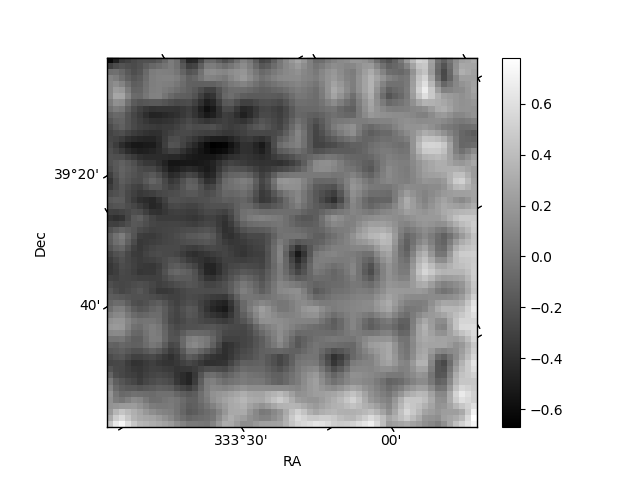
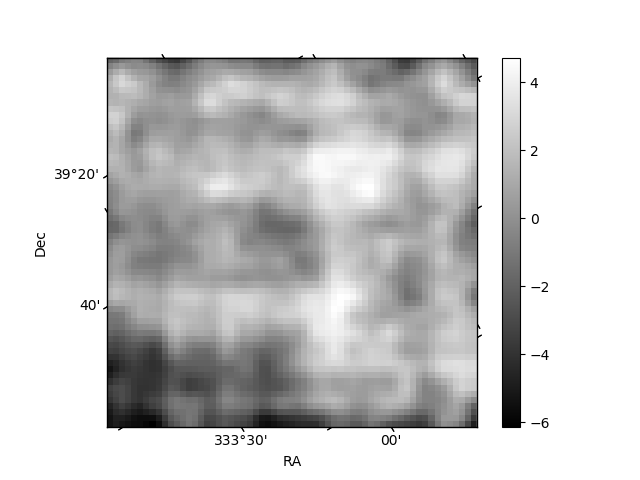
Histogram calculated using DETX and DETY for each event in the final _common_clean file
| Quadrant A | 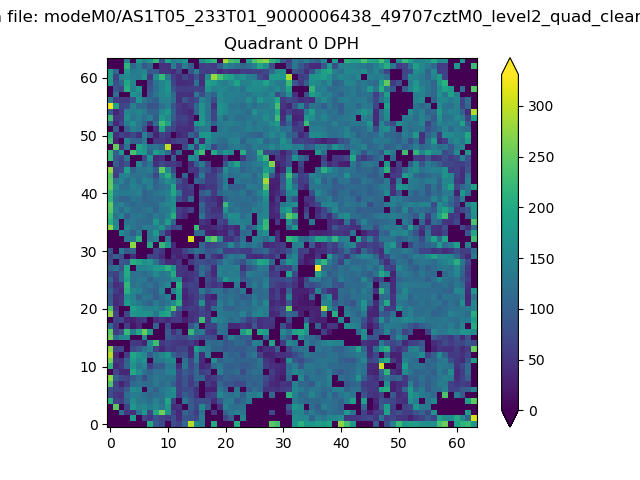 |
 |
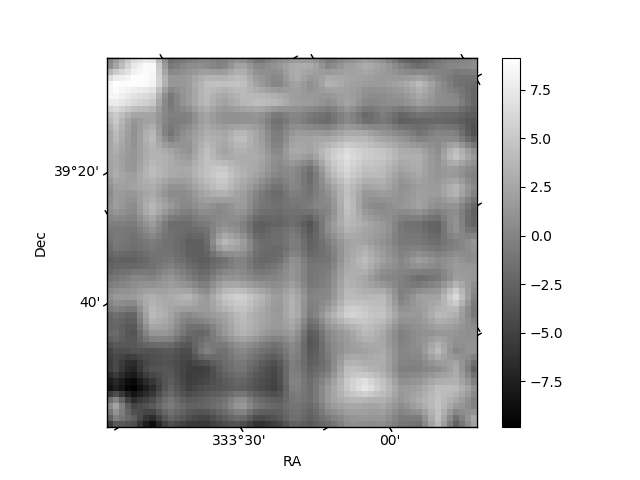
Quadrant B |
|---|---|---|---|
| Quadrant D | 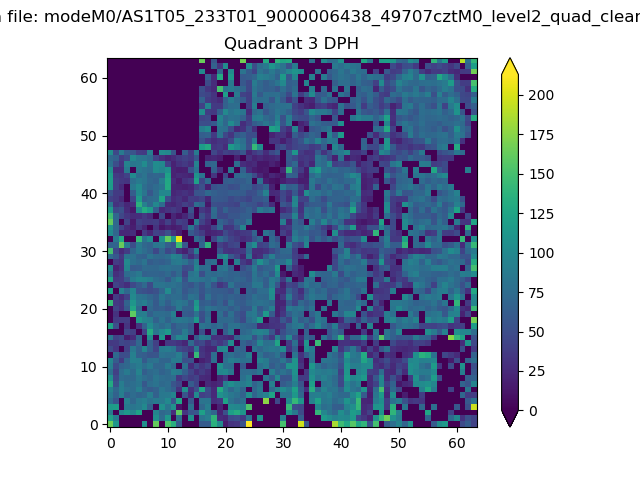 |
 |
Quadrant C |
| Plot type | Count rate plots | Images |
|---|---|---|
| Comparison with Poisson distribution Blue bars denote a histogram of data divided into 1 sec bins. Red curve is a Poisson curve with rate = median count rate of data. |
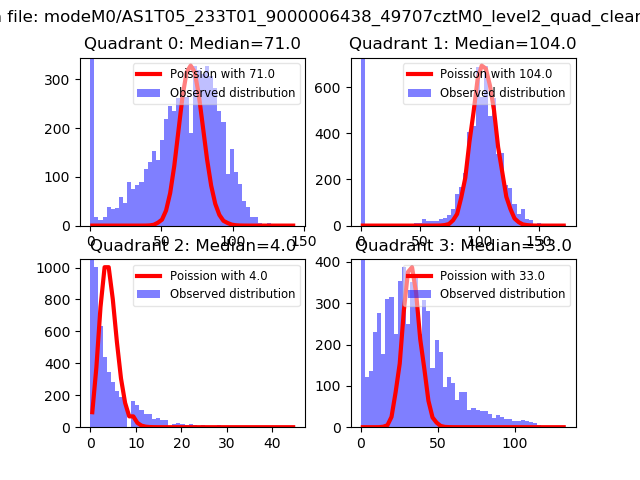 |
 |
| Quadrant-wise count rates Data is divided into 100 sec bins |
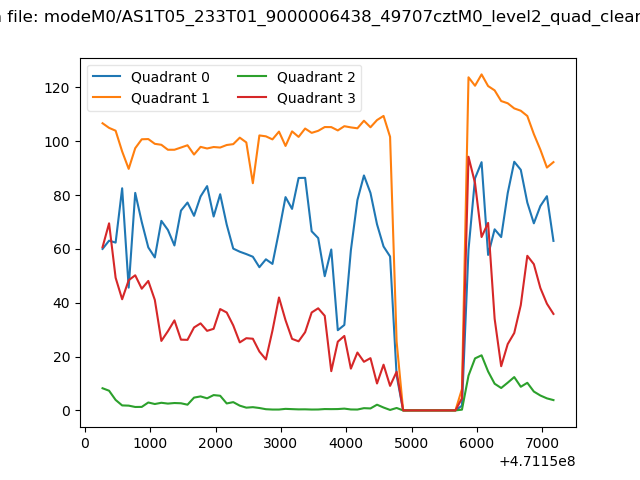 |
|
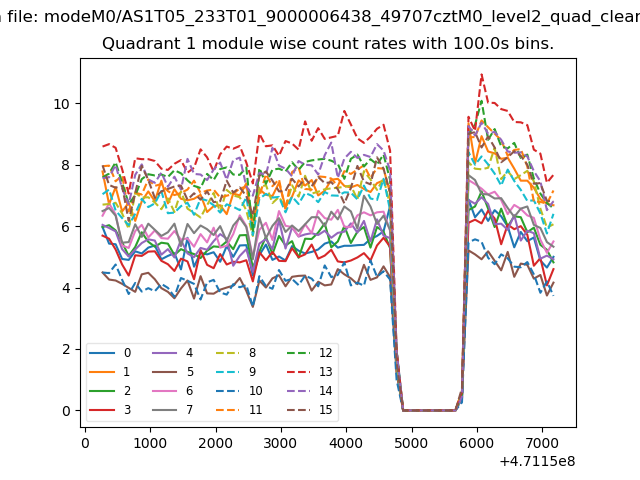
| Module-wise count rates for Quadrant A Data is divided into 100 sec bins |
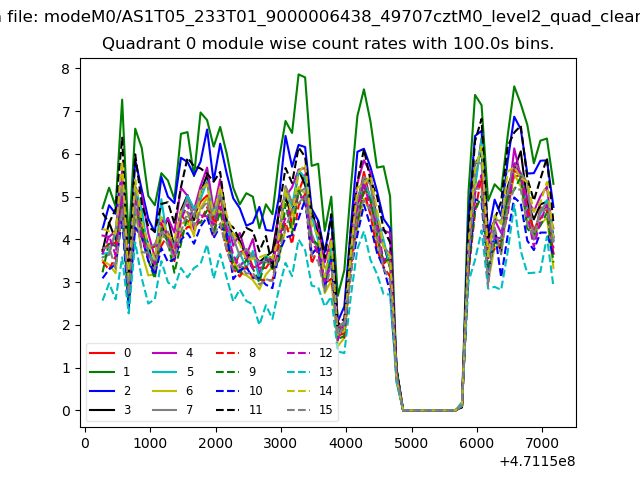 |
 |
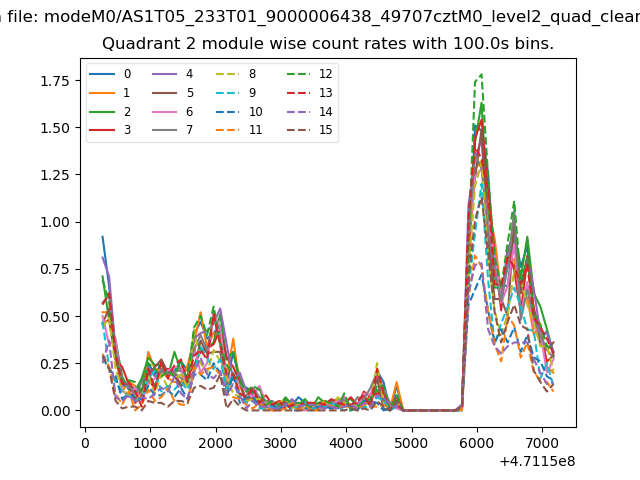
| Module-wise count rates for Quadrant B Data is divided into 100 sec bins |
 |
 |
| Module-wise count rates for Quadrant C Data is divided into 100 sec bins |
 |
 |
| Module-wise count rates for Quadrant D Data is divided into 100 sec bins |
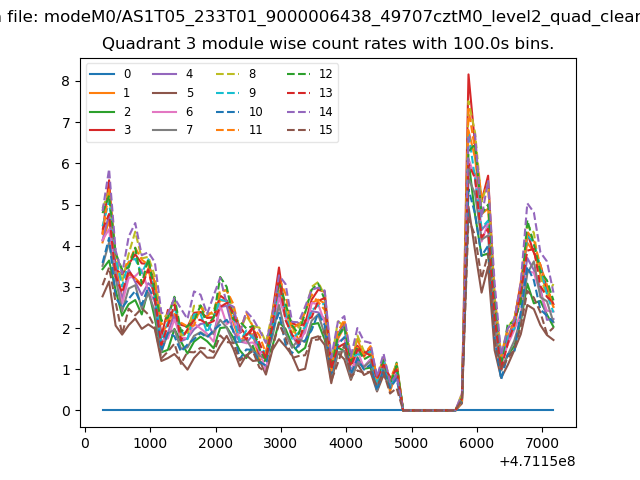 |
 |
| Parameter | Plot |
|---|---|
| CZT HV Monitor | 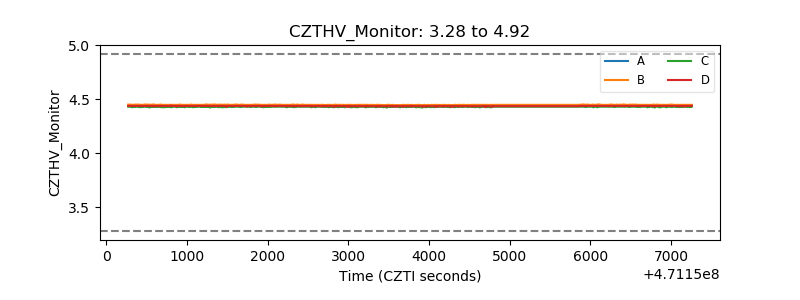 |
| D_VDD | 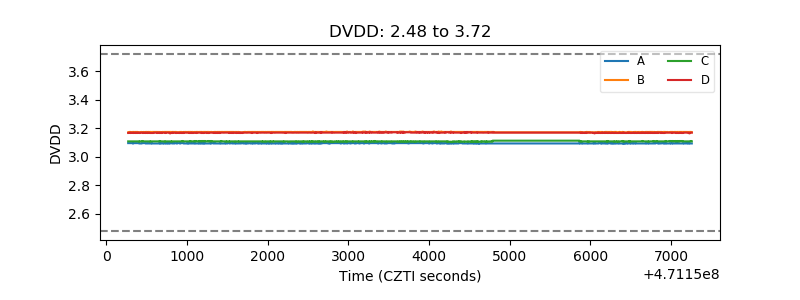 |
| Temperature 1 | 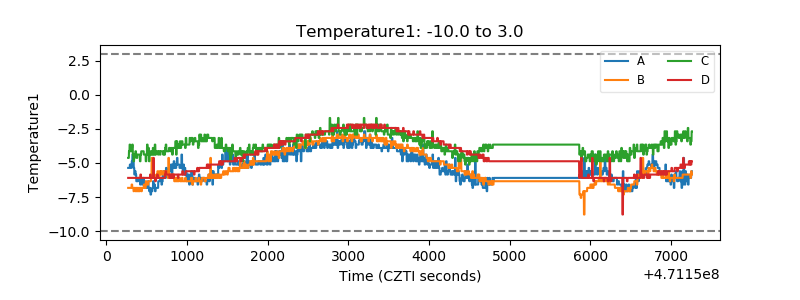 |
| Veto HV Monitor | 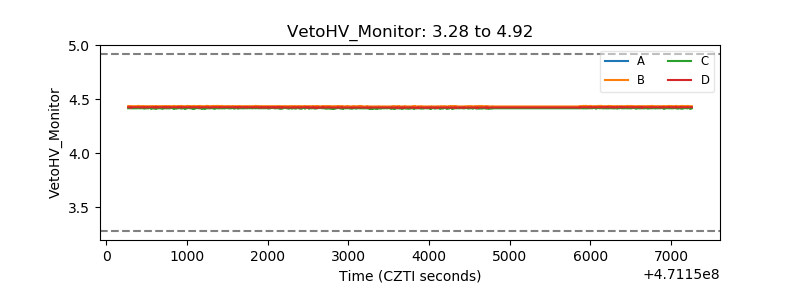 |
| Veto LLD | 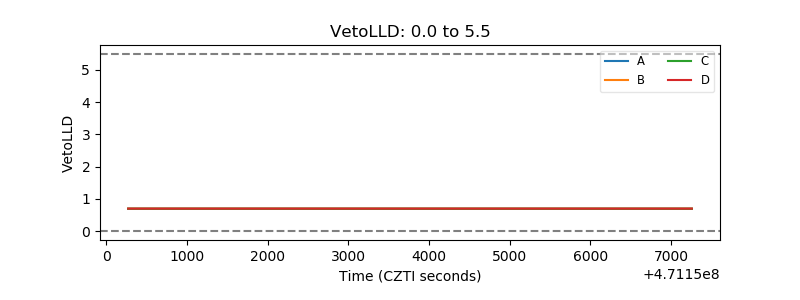 |
| Alpha Counter | 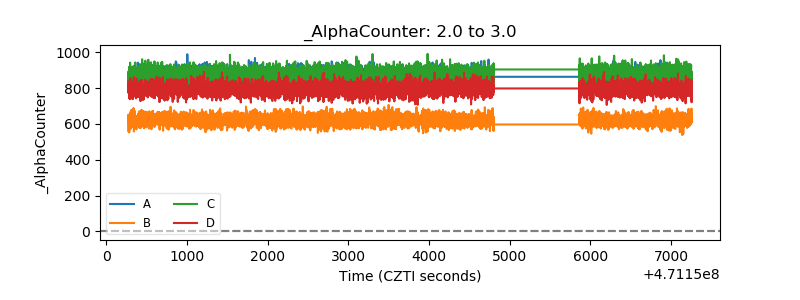 |
| _CPM_Rate | 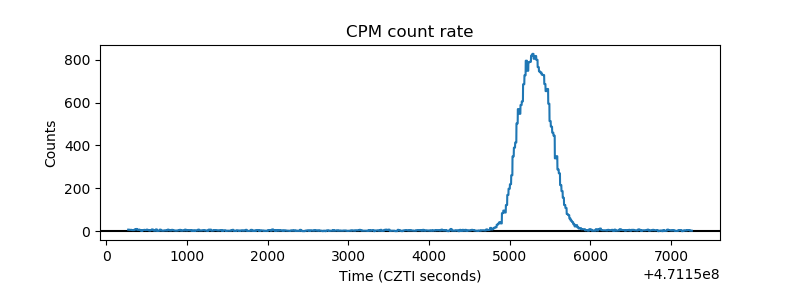 |
| CZT Counter | 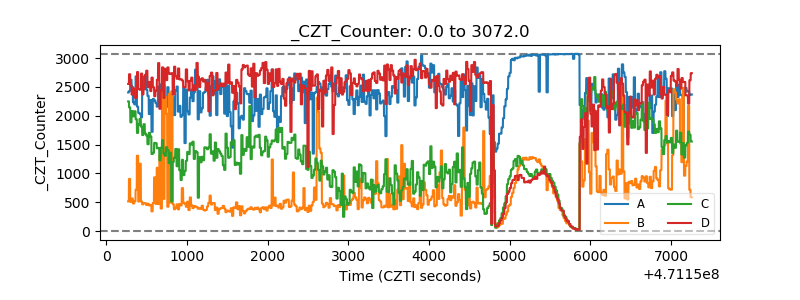 |
| +2.5 Volts monitor | 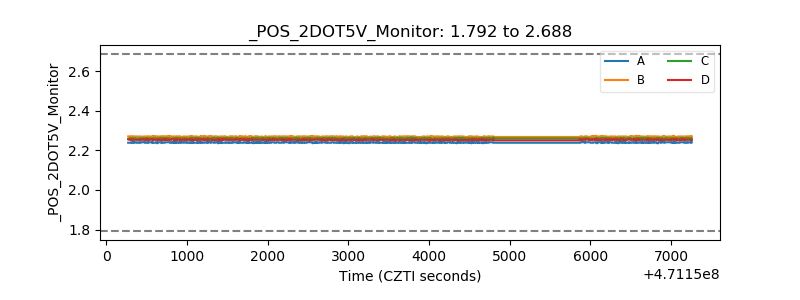 |
| +5 Volts monitor | 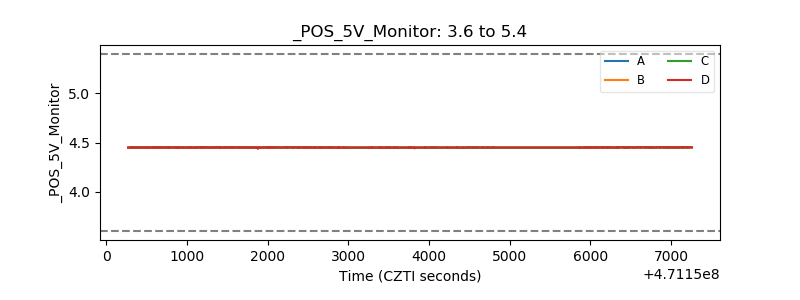 |
| _ROLL_ROT | 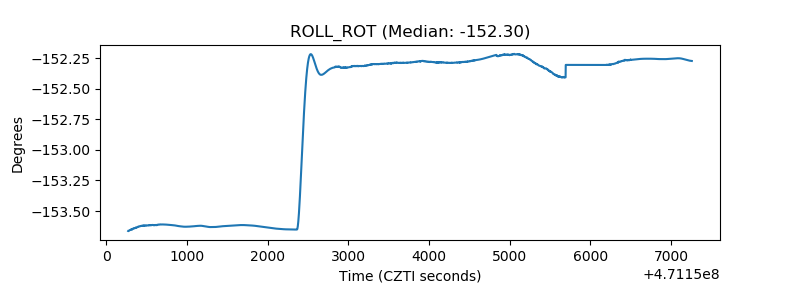 |
| _Roll_DEC | 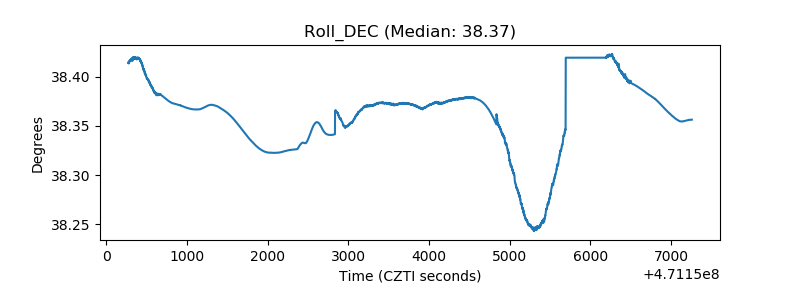 |
| _Roll_RA | 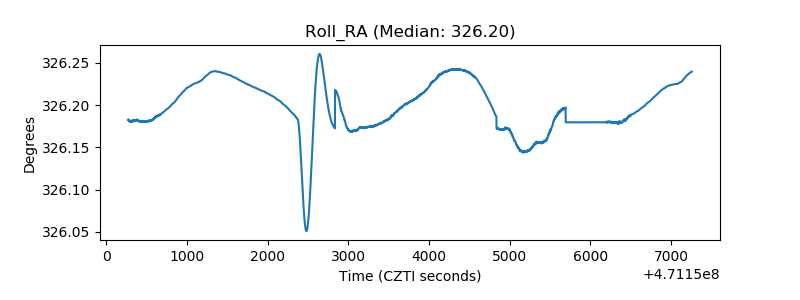 |
| Veto Counter | 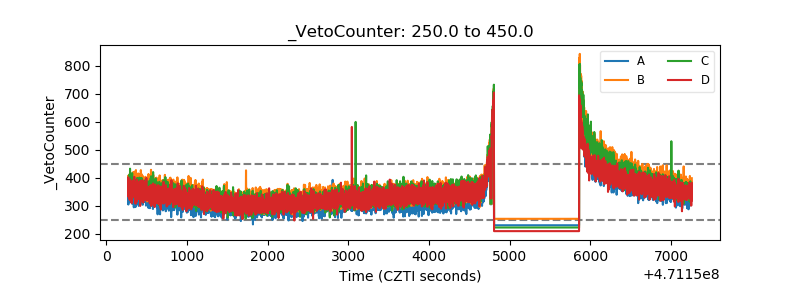 |